Back to Journals » Drug Design, Development and Therapy » Volume 15
Charge-Transfer Complex of Linifanib with 2,3-dichloro-3,5-dicyano-1,4-benzoquinone: Synthesis, Spectroscopic Characterization, Computational Molecular Modelling and Application in the Development of Novel 96-microwell Spectrophotometric Assay
Authors Darwish IA ![]() , Khalil NY, Alsaif NA
, Khalil NY, Alsaif NA ![]() , Herqash RN, Sayed AYA, Abdel-Rahman HM
, Herqash RN, Sayed AYA, Abdel-Rahman HM ![]()
Received 9 December 2020
Accepted for publication 19 February 2021
Published 12 March 2021 Volume 2021:15 Pages 1167—1180
DOI https://doi.org/10.2147/DDDT.S296502
Checked for plagiarism Yes
Review by Single anonymous peer review
Peer reviewer comments 2
Editor who approved publication: Prof. Dr. Georgios Panos
Ibrahim A Darwish,1 Nasr Y Khalil,1 Nawaf A Alsaif,1 Rashed N Herqash,2 Ahmed YA Sayed,1 Hamdy M Abdel-Rahman3,4
1Department of Pharmaceutical Chemistry, College of Pharmacy, King Saud University, Riyadh, 11451, Saudi Arabia; 2Medicinal Aromatic and Poisonous Plant Research Centre, College of Pharmacy, King Saud University, Riyadh, 11451, Saudi Arabia; 3Department of Medicinal Chemistry, Faculty of Pharmacy, Assiut University, Assiut, 71526, Egypt; 4Department of Medicinal Chemistry, College of Pharmacy, Nahda University, Banisuef, Egypt
Correspondence: Ibrahim A Darwish
Department of Pharmaceutical Chemistry, College of Pharmacy, King Saud University, PO Box 2457, Riyadh, 11451, Saudi Arabia
Tel +966 114677348
Fax +966 114676220
Email [email protected]
Background: Linifanib (LFB) is a multi‐targeted receptor tyrosine kinase inhibitor used in the treatment of hepatocellular carcinoma and other types of cancer. The charge-transfer (CT) interaction of LFB is important in studying its receptor binding mechanisms and useful in the development of a reliable CT-based spectrophotometric assay for LFB in its pharmaceutical formulation to assure its therapeutic benefits.
Purpose: The aim of this study was to investigate the CT reaction of LFB with 2,3-dichloro-3,5-dicyano-1,4-benzoquinone (DDQ) and its application in the development of a novel 96-microwell spectrophotometric assay for LFB.
Methods: The reaction was investigated, its conditions were optimized, the physicochemical and constants of the CT complex and stoichiometric ratio of the complex were determined. The solid-state LFB-DDQ complex was synthesized and its structure was analyzed by UV-visible, FT-IR, and 1H-NMR spectroscopic techniques, and also by the computational molecular modeling. The reaction was employed in the development of a novel 96-microwell spectrophotometric assay for LFB.
Results: The reaction resulted in the formation of a red-colored product, and the spectrophotometric investigations confirmed that the reaction had a CT nature. The molar absorptivity of the complex was linearly correlated with the dielectric constant and polarity index of the solvent; the correlation coefficients were 0.9526 and 0.9459, respectively. The stoichiometric ratio of LFB:DDQ was 1:2. The spectroscopic and computational data confirmed the sites of interaction on the LFB molecule, and accordingly, the reaction mechanism was postulated. The reaction was utilized in the development of the first 96-microwell spectrophotometric assay for LFB. The assay limits of detection and quantitation were 1.31 and 3.96 μg/well, respectively. The assay was successfully applied to the analysis of LFB in its bulk and tablets with high accuracy and precision.
Conclusion: The assay is simple, rapid, accurate, eco-friendly as it consumes low volumes of organic solvent, and has high analysis throughput.
Keywords: linifanib, 2,3-dichloro-3,5-dicyano-1,4-benzoquinone, charge-transfer reaction, spectroscopic techniques, 96-microwell spectrophotometric assay, high-throughput pharmaceutical analysis
Introduction
The concept of charge-transfer (CT) reactions was introduced by Mulliken and Pearson1 and then discussed widely by Foster.2 In CT reactions, electronic charge is partially transferred from an electron donor molecule to an electron acceptor molecule.1–3 The chemistry of CT interactions and CT complex formation, especially with drugs, has attracted the attention of pharmacists, chemists, and biologists. Their interest in CT complexes is attributed to the great usefulness of these complexes and their wide range of applications in different fields such as chemical, biological, pharmaceutical, industrial, and technological. For example, CT complexes have been used in electrical, optical, magnetic, and biological applications, in studying pharmaceutical receptor binding mechanisms, and in solar energy storage applications.4–9 The formation of CT complexes was also used as the basis for development of simple, rapid, and reliable methods for the qualitative detection and quantitative determination of drugs in bulk and/or pharmaceutical dosage forms.10–19 The properties and characteristics of the CT complexes such as their crystallographic properties, thermal stabilities, and effects of solvents, reagent concentration, temperature, and other parameters have also been intensively described and discussed.20–25
Over the past years, we have been involved in studying the formation and applications of CT complexes of several drugs, such as macrolide antibiotics, cephalosporines, crizotinib, olmesartan medoxamil, losartan potassium, cediranib, rosuvastatin calcium, and atorvastatin calcium with different acceptors.10–19 The aim of our studies was to understand the chemistry behind the CT complexation of these drugs and to learn more about their electron donation behaviors toward several electron acceptors.
In the present work, we investigated linifanib (LFB) as an important drug used for treatment of different types of cancer. LFB is chemically named as 1-(4-(3-amino-1H-indazol-4-yl)phenyl)-3-(2-fluoro-5-methylphenyl)urea (Figure 1). The molecular formula of LFB is C21H18FN5O and its molecular weight is 375.4 g/mol.26 LFB is an orally bioavailable, small molecule drug that belongs to a group of receptor tyrosine kinase inhibitors (RTKIs). LFB is considered as a multi‐targeted RTKI and has high specificity to the vascular endothelial growth factor receptor (VEGFR)27–29 and platelet-derived growth factor receptor (PDGFR). These receptors (VEGFR and PDGFR) stimulate the angiogenesis process which is the creation and maintaining of new blood vessels required for the growth and metastasis of normal and malignant cells. In addition, they contribute to cancer development and progression by both autocrine and paracrine signaling mechanisms.30,31 Therefore, blocking of multiple pro‐angiogenetic signaling pathways by LFB is considered a very important strategy in the treatment of cancers.27 LFB showed antitumor activity against different tumors, mainly hepatocellular carcinoma.32–34 LFB, in combination therapy with other chemotherapeutic agents, has demonstrated clinical success in treatment of other types of cancers such as non‐small-cell lung cancer,35–37 gastric cancer38 and renal cancer.39 In addition, LFB can enhances the radiotherapy of head and neck squamous cell carcinoma.40 Moreover, LFB has shown antiangiogenic activity for pharmacotherapy of retinal disorders.41 Studies demonstrated that LFB does not cause unexpected side effects or undesirable interactions on the enzymes that metabolize drugs. The clearance of LFB is linear with no evidence of drug accumulation. Furthermore, LFB is tolerable by its continuous once-daily administration.42
 |
Figure 1 The chemical structures of linifanib (LFB) and 2,3-dichloro-3,5-dicyano-1,4-benzoquinone (DDQ). |
Because of the therapeutic importance of LFB, the chemistry of its binding to different organic targets has been a subject of considerable research.43,44 Owing to the presence of multiple N-based functional groups, LFB molecules can be readily immobilized on a metal substrate for immersible biosensors or on gold nanoparticle (AuNP) nanocarriers for targeted controlled drug delivery (CDD), as shown recently for various highly toxic chemotherapeutic drugs, like gemcitabine,45 dabrafenib,46 azacitidine and decitabine.47 However, the CT reaction of LFB has not been reported. The CT interaction of LFB was considered in this work based on its expected good electron-donating ability which is due to the presence of multiple potentially electron-donating sites (three nitrogen atoms and one carbonyl oxygen atom) that make it a versatile polyfunctional ligand and form CT complexes with electron acceptors (Figure 1). In a previous study involving CT reactions with many polyhalo-/polycyanoquinone electron acceptors, Alzoman et al17 demonstrated that 2,3-dichloro-5,6-dicyano-1,4-benzoquinone (DDQ) is the most reactive acceptor. Therefore, DDQ was selected as an acceptor to carry out the investigations described herein. In this investigation, first, LFB was reacted with DDQ in organic media, the reaction conditions were optimized, the association constant of the complex and the stoichiometric ratio of LFB:DDQ were determined. Second, the LFB-DDQ complex was isolated and its structure was ascertained using ultraviolet (UV)-visible, Fourier-transform infrared (FT-IR), and proton-nuclear magnetic resonance (1H-NMR) spectroscopic techniques. Third, computational molecular modeling for the complex was conducted, the sites on LFB molecule that contributed to the formation of the complex were determined, and the mechanism of the reaction was postulated. Fourth, the reaction was employed as a basis for the development of a novel 96-microwell assay with high-throughput for determination of LFB in bulk and pharmaceutical dosage form.
Materials and Methods
Apparatus
UV-VIS spectrophotometer (UV-1601 PC: Shimadzu, Kyoto, Japan), double beam with matched 1-cm quartz cells. PerkinElmer FT-IR spectrum BX apparatus (PerkinElmer, Norwalk, CT, USA). Bruker NMR spectrometer (Bruker Corporation, Billerica, MA, USA) operating at 700 MHz. Microplate absorbance reader (ELx808: Bio-Tek Instruments Inc., Winooski, VT, USA) empowered by KC Junior software, provided with the instrument. 96-Microwell assay plates were a product of Corning/Costar Inc. (Cambridge, MA, USA). Adjustable 8-channel pipette was obtained from Sigma Chemical Co. (St Louis, MO, USA).
Chemicals and Materials
LFB was purchased from Weihua Pharma Co. Limited (Hangzhou, Zhejiang, China) and used as received. Its claimed purity was >99% and the solution was stable for at least one week when kept refrigerated. DDQ (Sigma-Aldrich Corporation, St Louis, MO, USA). Finnpipette adjustable single and 8-channel pipettes were products of Sigma-Aldrich Co. (St Louis, MO, USA). Solvents and other reagents were of analytical grade (Thermo Fisher Scientific, Waltham, MA, USA).
Preparation of Standard LFB Solutions
A stock solution was prepared by dissolving 10 mg (2.66×10⁻⁵ mole) of LFB in 10 mL methanol. This stock solution (2.66×10⁻³ M) was diluted with the appropriate solvent to obtain LFB concentrations suitable for the corresponding study.
Determination of Formation Constant
Series of LFB solutions (2.66×10⁻⁵–1.86×10⁻⁴ M) were mixed with DDQ solution of a fixed concentration (4.4×10⁻³ M); both LFB and DDQ solutions were prepared in methanol. These mixed solutions were allowed to reach equilibrium (~10 min) at room temperature (25±2°C). The absorbance of the solutions was measured at 432 nm against reagent blanks treated similarly. The measured absorbances were used to generate the Benesi–Hildebrand plot48 of LFB-DDQ CT complex. Linear regression analysis was conducted for the data using the Benesi–Hildebrand equation, from which the formation constant of the complex was determined.
Determination of DDQ:LFB Molar Ratio
Job’s continuous variation49 and spectrophotometric titration50 methods were employed. For Job’s method, master equimolar solutions (2.66×10⁻³ M) of LFB and DDQ reagent were prepared in methanol. A series of 100-µL portions of the master solutions of LFB with the DDQ reagent were made up comprising different complementary proportions (0:100, 10:90, … … … …, 90:10, 100:0, inclusive) in the 96-microwell assay plate. The reaction was allowed to proceed for 10 min at room temperature (25±2°C) and then the absorbances were measured at by the absorbance plate reader at 432 nm.
For the spectrophotometric titration method, master solutions of LFB (2.66×10⁻³ M) and DDQ (2.128×10⁻² M) were prepared (ie molar concentration of DDQ was eightfold that of LFB). Series of the master solutions of LFB with DDQ were made up comprising LFB solution of a fixed concentration (2.66×10⁻³ M) and varying DDQ concentrations (2.66×10⁻³–2.128×10⁻² M); LFB:DDQ molar ratio was 1:8. The reaction was allowed to proceed at room temperature (25±2°C) for 10 min. The absorbances of the developed colors were measured at 432 nm against blanks treated similarly except methanol was used instead of LFB sample. The measured absorbances were plotted as a function of LFB:DDQ molar ratio. The generated plot was used for determination the molar ratio of the reaction between LFB and DDQ.
Molecular Modelling for the CT Complex of LFB with DDQ
The molecular modeling for the CT complex was performed by using the Molecular Operating Environment (MOE) software, version 2014 (Chemical Computing Group ULC, Montreal, Canada).
Synthesis of LFB-DDQ CT Complex
The LFB-DDQ CT complex was synthesized by mixing 10-mL solutions containing 37.54 mg (0.1 mmol) of LFB and 45.5 mg (0.2 mmol) of DDQ in methanol. The mixture solution was allowed to proceed with a continuously magnetic stirring for 60 min at room temperature (25±2°C). Then, solvent was evaporated by bubbling of helium gas in the reaction solution, and the resulting residue was dried in a vacuum desiccator over anhydrous calcium chloride. The dried residue was subjected to analysis by FT-IR and 1H-NMR spectroscopy.
Preparation of LFB Tablet Sample Solution
A quantity of a laboratory-made tablets that was equivalent to 20 mg of LFB was completely dissolved in 10 mL methanol with the aid of shaking and sonication. The solution was filtered and a measured volume of the filtrate was diluted with methanol to yield LFB concentrations in the range of 2–1000 μg/mL.
Procedure of the 96-microwell Spectrophotometric Assay
Accurately measured aliquots (100 µL) of the standard or tablet sample solution containing varying amounts of LFB (0.2–100 µg) were transferred into wells of 96-microwell assay plates. One hundred microliters of DDQ solution (0.5%, w/v) were added, and the reaction was allowed to proceed at room temperature (25±2°C) for 10 min. The absorbances of the resulting solutions were measured at 432 nm by the microwell-plate reader.
Statistical Analysis
The statistical analysis was performed by Microsoft Excel Software, version 2018, of the Microsoft Office 365 (Microsoft Corporation, Redmond, WA, USA). All the collected spectrophotometric measurements were presented as mean ±SD or relative standard deviation (RSD). Regression analysis of the calibration curve of the assay was performed by the data analysis package embedded in the Excel software at a probability value (p-value) <0.05. Analysis included the calculation of the line’s parameters which included the intercept, slope, correlation coefficient, and variance. The slope (b) and SD of the intercept (SDa) were used for calculating the limits of detection (LOD) and quantitation (LOQ) using the formula: LOD or LOQ=x SDa/b, where x=3.3 and 10 for LOD and LOQ, respectively.
Results
UV-Visible Absorption Spectra and Bandgap Energy
The UV-visible absorption spectra of methanolic solutions of LFB (1.33×10⁻⁴ M), DDQ (1.39×10⁻³ M) and their reaction mixture were recorded in the region 200–800 nm (Figure 2). LFB displayed three absorption bands at 210, 266 and 321 nm. DDQ displayed two absorption bands at 221 and 262 nm. When LFB solution was mixed with DDQ solution and the reaction was allowed to proceed at room temperature (25±2°C), the reaction solution turned a red color and its absorption spectrum showed three new absorption bands at much longer wavelengths than those of both LFB and DDQ at 432, 547, and 588 nm. The intensity of the band at 432 nm was ~1.5-fold of those at 547, and 588 nm whose intensities were comparable. The absorption intensities of these new absorption bands increased with time LFB concentrations in the reaction solution.
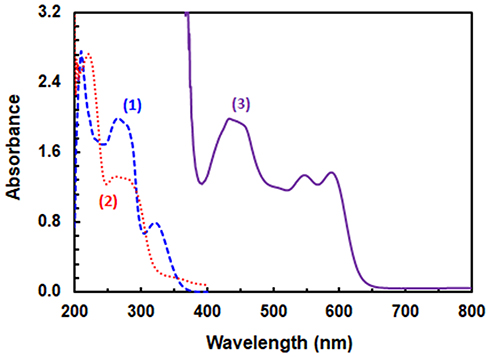 |
Figure 2 Absorption spectra of (1): LFB (1.33×10⁻⁴ M), (2): DDQ (1.39×10⁻³ M) and (3): reaction mixture of LFB and DDQ. LFB, DDQ and their reaction mixture were in methanol. |
The bandgap energy (Eg) is the minimum energy needed to excite an electron and promote it from the lower energy valence band into the higher energy to participate in formation of a conduction band.51 For calculation of Eg, a Tauc plot was generated from the absorption spectrum of the LFB-DDQ complex (Figure 2) by plotting energy values (hυ, in eV) against (αhυ)2 (Figure 3A). The equation enabling the analysis of the Tauc plot (Figure 2) and determination of Eg was:
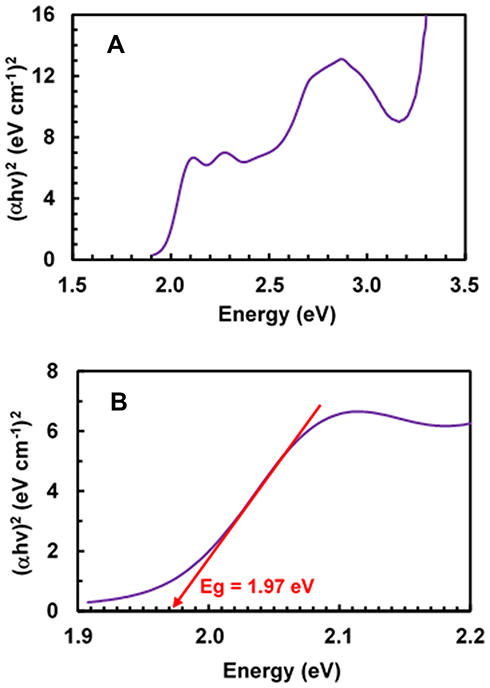 |
Figure 3 Tauc plot of energy (hυ) against (αhυ)2 against for CT complex of LFB with DDQ in methanol solvent (A). A segment of the same plot at in the energy range of 1.9–2.2 eV (B). |
(αhυ)2=k (hυ–Eg)
Where α was the absorption coefficient, h was the Planck’s constant, defined as the quantum of electromagnetic action that relates a photon’s energy to its frequency (6.62607004×10⁻³⁴ m2 kg/s), υ was the photon’s frequency, k was relation constant, and Eg was the bandgap energy.
The value of Eg was obtained by extrapolating the linear portion of the plot to (αhυ)2=0.52 The value of Eg was found to be 1.97 eV (Figure 3B).
Optimization of Reaction Conditions
The results of variations in DDQ concentrations and reaction time at room temperature (25±2°C) indicated that the optimum DDQ concentration was in the range of 0.4–1% (w/v) and 10 min was adequate for reaching the reaction equilibrium (Figure 4). For higher precise readings, DDQ was used at a concentration of 0.5% (w/v) and the reaction was allowed to proceed for 10 min. In order to optimize the solvent, the reaction of LFB with DDQ was allowed to proceed in different solvents of varying dielectric constants and polarity indexes and the absorption spectra were recorded. The maximum absorption peaks (λmax) and molar absorptivity (ε) were determined in each solvent. Shifts in the values of the maximum absorption peak (λmax) were observed, and the molar absorptivity (ε) values were also influenced; the obtained values were given in Figure 5 and Table 1. The interaction in polar solvents with high dielectric constants (acetonitrile, methanol, etc) gave ε values higher than those obtained in low-polar solvents with low dielectric constants (eg toluene and 1.4-dioxane); however, the reaction did not proceed at all in nonpolar solvent (eg chloroform). The values of ε were correlated with both the dielectric constants53 and polarity indexes54 of the solvent in which the reaction was performed (Figure 6); determination coefficients (R2) were=0.9047 and 0.8947 for dielectric constants and polarity indexes, respectively. Acetonitrile gave a relatively higher ε value; however, the stability of the color was not good as that obtained in methanol, thus we preferred to use methanol.
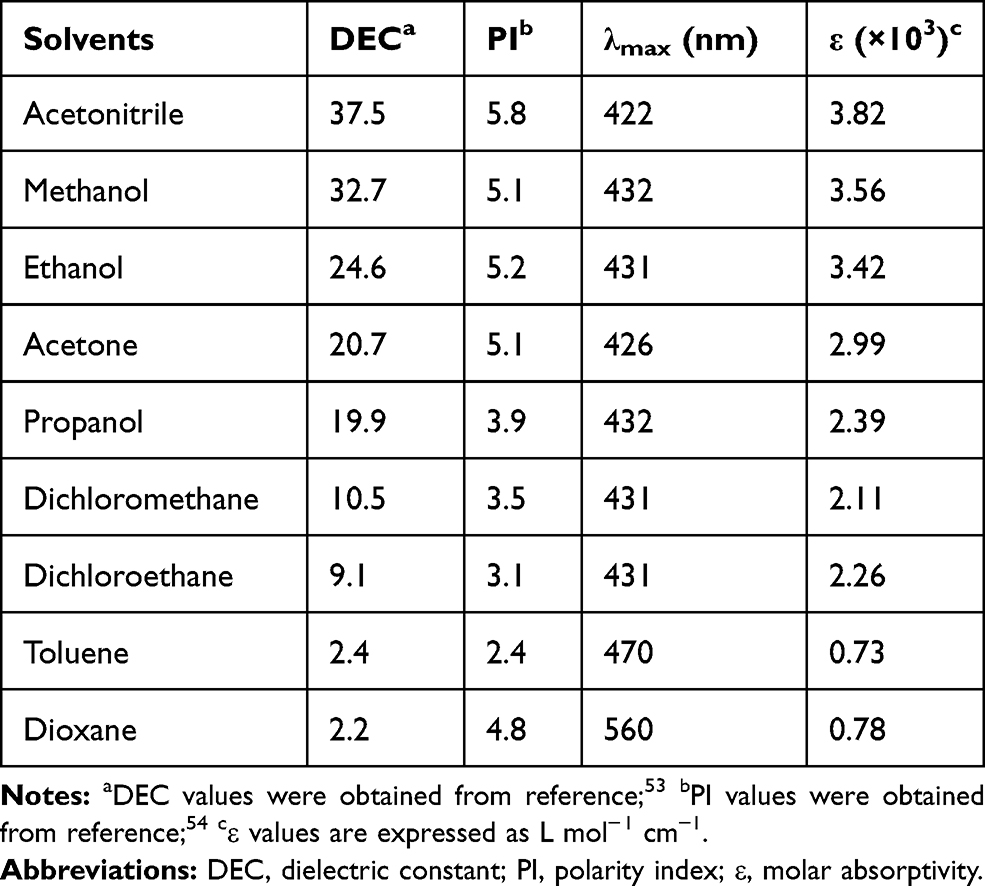 |
Table 1 Effect of Solvents on the Position and Intensity of Absorption of the Reaction Mixtures of LFB with DDQ |
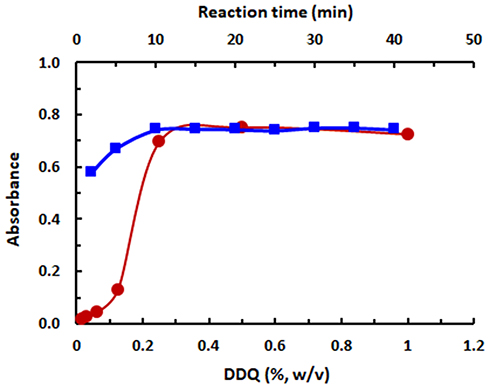 |
Figure 4 Effect of DDQ concentration (●) and time (■) on the CT reaction of LFB and DDQ. |
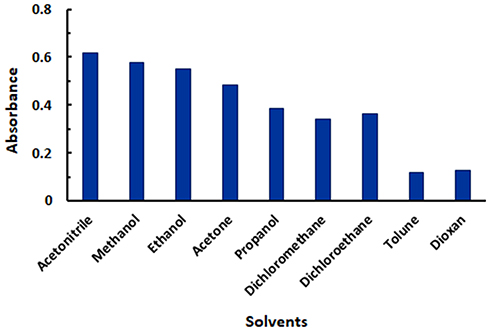 |
Figure 5 Effect of solvent on the CT reaction of LFB and DDQ. |
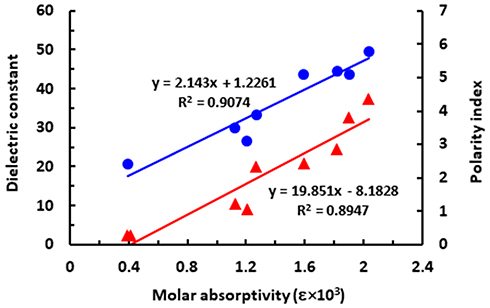 |
Figure 6 Correlation of molar absorptivity (ε) of LFB-DDQ CT complex versus dielectric constant (●, on left axis) and polarity index (▲, on right axis) of the solvent used for the reaction. Linear fitting equations and correlation coefficients (r) are given on the regression lines. |
Formation Constant and Free Energy Change
The formation constant of LFB-DDQ complex was determined by the Benesi–Hildebrand method.48 A straight line was obtained (Figure 7), for which linear regression analysis was performed. From the regression analysis, the formation constant, correlation coefficient, and the molar absorptivity (ε) of the LFB–DDQ complex were calculated. The molar absorptivity and formation constant of the complex were found to be 3.05×10³ L mol−1 cm−1 and 1.2×10³ L mol−1, respectively.
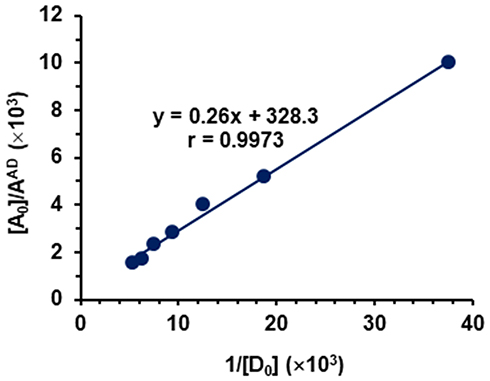 |
Figure 7 Benesi–Hildebrand plot of the CT complex of LFB with DDQ and the linear fitting equation with correlation coefficient (r), AAD and [D0] are the molar concentration of DDQ, absorbance of the complex reaction mixture, and molar concentration of LFB, respectively. |
The standard free energy change (ΔG0) of the CT complex is related to its formation constant and it can be calculated by the following formula: ΔG0=−2.303 RT log Kc.
where ΔG0 is the standard free energy change of the complex (kJ mol–1), R is the gas constant (8.314 kJ mol–1), T is the absolute temperature in kelvin (°C+273) and Kc is the formation constant of the complex (L mol–1). ΔG0 value was calculated and found to be −1.77×10⁴ J mol–1. The negative value of ΔG0 suggests that the interaction between LFB and DDQ took place spontaneously, exothermic and the complex was reasonably stable.55
Molar Ratio, Molecular Modeling, Sites of Interaction and Reaction Mechanism
The molar ratio of DDQ to LFB was determined both by Job’s continuous variation49 and spectrophotometric titration50 methods and it was found that the DDQ:LFB ratio was 2:1 in both methods (Figure 8). Energy minimization for LFB molecule was conducted and the electron density on each atom was calculated. The calculated electron densities located on each of LFB atoms are given on the energy-minimized LFB molecule (Figure 9A). The values indicated that the electron densities located on the nitrogen atom of the primary amino group (–NH2) attached to the 3-position of the indazole ring and the tertiary nitrogen atom of the indazole ring (2-position) are the highest electron densities among all LFB atoms. These densities were –0.883 and –0.707, respectively; the negative signs indicate the electron densities. Upon energy minimization of one molecule of LFB with two molecules of DDQ, one DDQ molecule was adjacent to the primary amino group (–NH2) attached to the 3-position of the indazole ring and the second DDQ molecule was adjacent to the tertiary nitrogen atom of the indazole ring (2-position); the atoms having the highest electron densities (Figure 9B). Based on these results, the scheme of the CT reaction of LFB with DDQ was postulated to proceed as described in Figure 10.
 |
Figure 8 Job’s continuous variation (A) and spectrophotometric titration (B) plots for determination of molar ratio of the CT reaction of LFB with DDQ. |
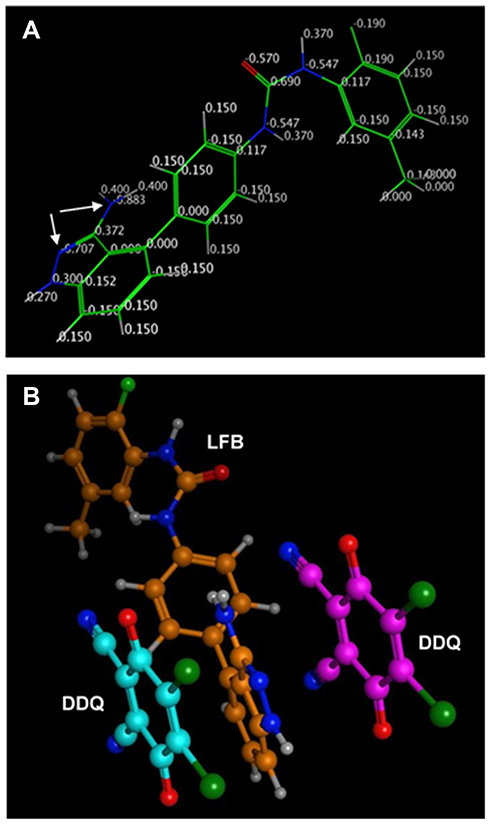 |
Figure 9 Energy-minimized LFB with charges on each atom (A) and the CT complex of LFB with DDQ (B) (one molecule of LFB and two molecules of DDQ). In panel (A), arrows point to the atoms having the highest electron densities. |
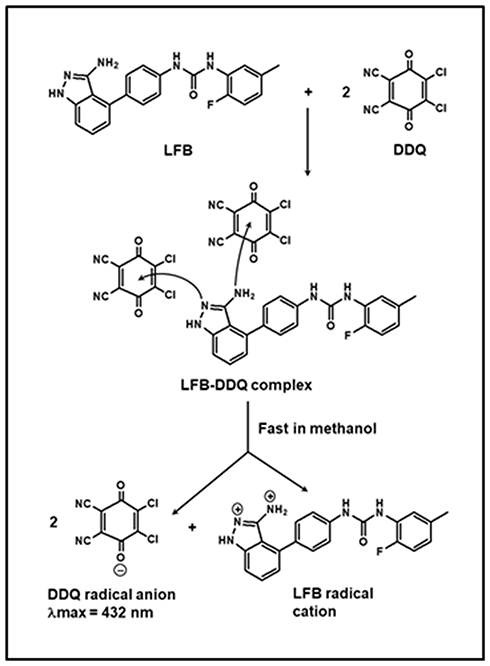 |
Figure 10 Scheme for the CT reaction pathway of LFB with DDQ. |
Spectroscopic Characterization of LFB-DDQ CT Complex
The structure of the CT complex was investigated by UV-visible, FT-IR and 1H-NMR spectroscopic techniques. The UV-visible spectrum generated from the methanolic solution of prepared solid CT complex was identical to that of the reaction mixture of LFB and DDQ (Figure 2). The FT-IR spectra of DDQ, LFB and the complex were recorded (Figure 11) and the assignments of the characteristic bands are given in Table 2. The 1H-NMR spectrum the CT complex of LFB with DDQ was recorded in d6-DMSO, the chemical shift (δ) values were derived and compared with those of the free LFB (Table 3).
 |
Table 2 The Characteristic Bands in FT-IR Spectra of DDQ, LFB and Their CT Complex |
 |
Table 3 1H-NMR Data of LFB and LFB-DDQ CT Complex (in DMSO-D6) |
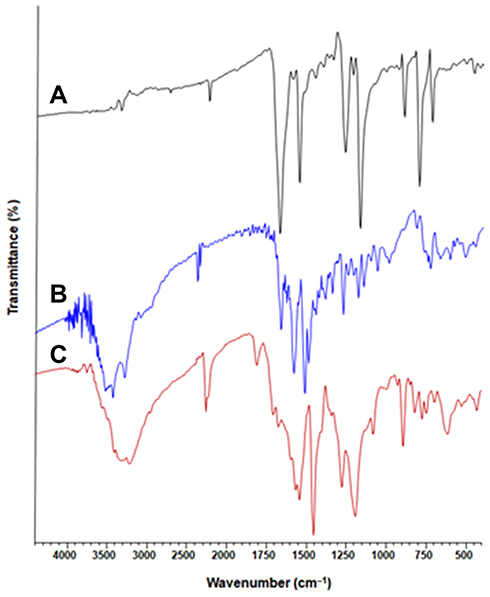 |
Figure 11 FT-IR spectra of DDQ (A), LFB (B) and CT complex of DDQ and LFB (C). |
Development of 96-microwell Spectrophotometric Assay
The assay conditions were optimized by carrying out the reaction in the 96-microwell assay plate by altering each reaction variable in a turn while keeping the other variables constant. The measurements were carried out at the λmax of the LFB-DDQ CT complex (432 nm). The investigated conditions were concentration of DDQ reagent, reaction time, and temperature. The studied range of these conditions and the optimum values which selected for the assay development are given in Table 4.
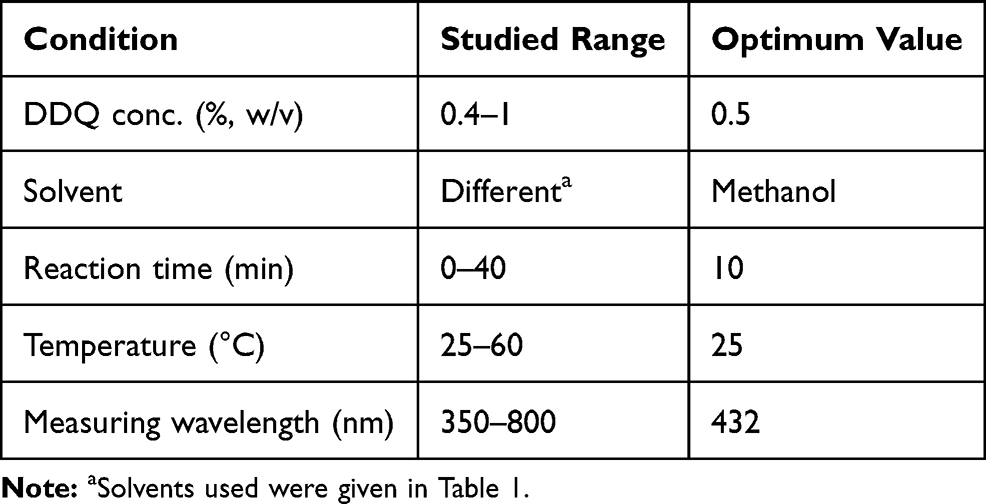 |
Table 4 Optimization of Experimental Conditions for the 96-microwell Spectrophotometric Assay for LFB Based on Its Formation of Colored CT Complex with DDQ |
Assay Validation and Application
The optimized assay procedures were carried out using calibration standard LFB samples and the color signals was generated (Figure 12A). The calibration curve was constructed (Figure 12B), and linear regression of the data was carried out by the least-squares method. The curve was linear in the range of 2–100 μg/well (100 μL). The calibration equation was: Y= –0.004+0.0106 X (R2=0.9990), where Y, X, and r are the absorbance, concentration of LFB and correlation coefficient, respectively. The International Conference on Harmonization (ICH) guidelines56 was used to calculate the limits of detection (LOD) and quantitation (LOQ), and their values were found to be 1.31 and 3.96 μg/well, respectively. The calibration parameters of the proposed microwell assay are given in Table 5.
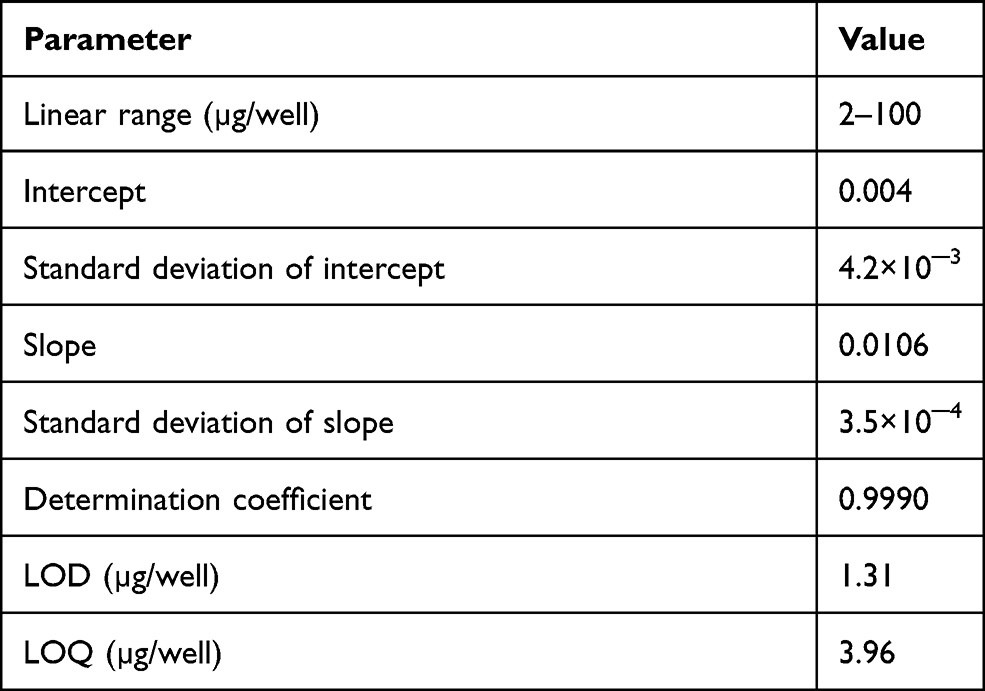 |
Table 5 Calibration Parameters for the Analysis of LFB by the 96-microwell Spectrophotometric Assay Based on the CT Reaction of LFB with DDQ |
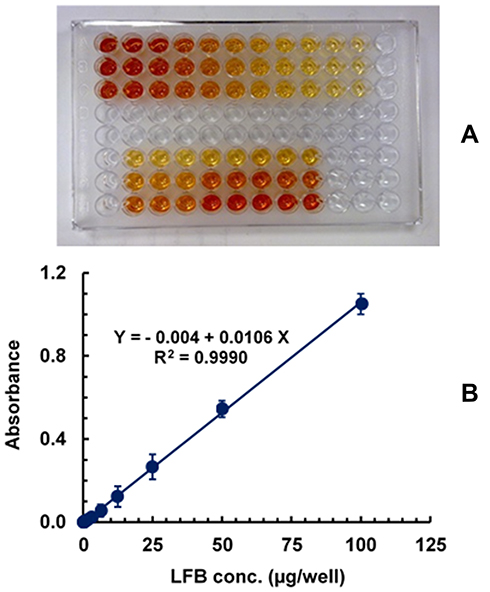 |
Figure 12 The 96-microwell spectrophotometric assay for determination of LFB based on its CT reaction with DDQ. Panel (A) an image of the assay plate containing the calibration solutions of varying LFB concentrations (upper wells) and test samples (lower wells). Panel (B) the generated calibration curve with the fitting equation and determination coefficient (r2). |
Replicate analysis for the samples of LFB solutions at varying concentration levels (Table 6) was conducted for assessing the assay precisions. The RSD were 0.64–1.46 and 0.85–1.78 for the intra- and interassay precision, respectively. These low RSD values proved the high precisions of the assay.
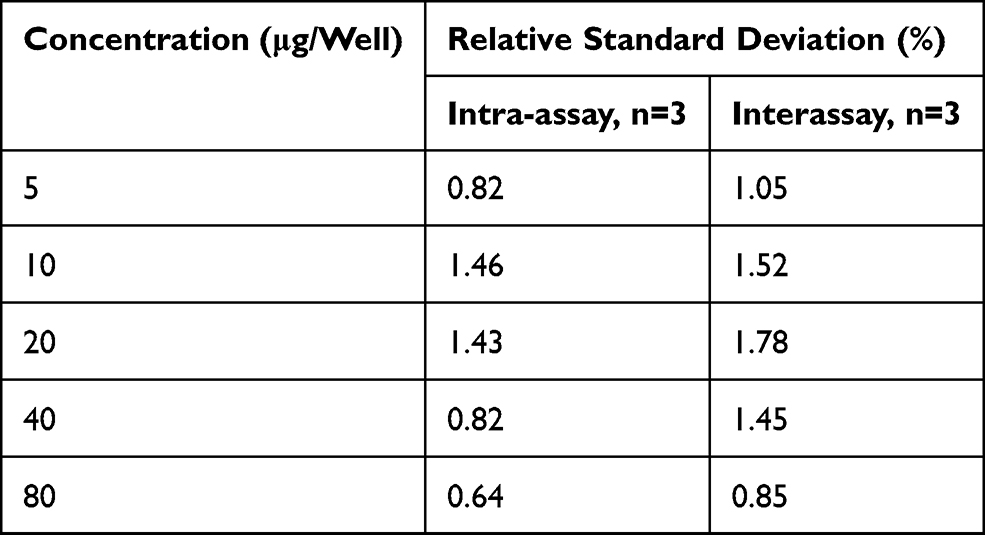 |
Table 6 Precision of the Proposed 96-microwell Spectrophotometric Assay at Different LFB Concentration Levels |
The accuracy of the proposed assay was evaluated by the recovery studies for varying LFB concentrations (Table 7). The recovery values were 97.8–101.4±1.04–1.54%, indicating the accuracy of the proposed assay.
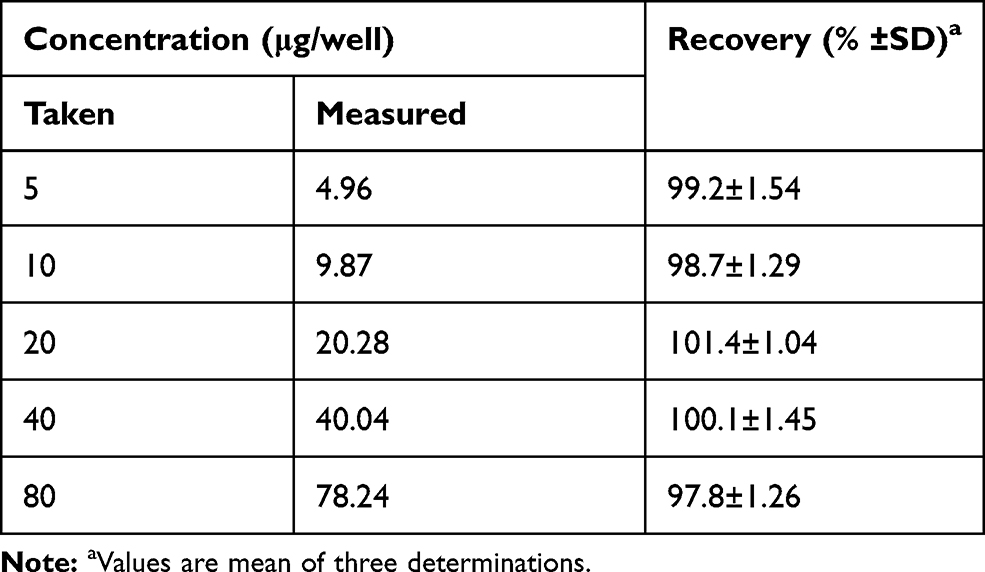 |
Table 7 Recovery Study for Determination of LFB by the Proposed 96-microwell Spectrophotometric Assay |
The proposed assay was conducted with small changes in its experimental conditions, and it was found that these small changes do not significantly affect the results of the assay; recovery values ranged from 97.9–101.5±1.02–2.13% (Table 8). This confirmed the convenience of the proposed assay for routine application for the analysis of LFB.
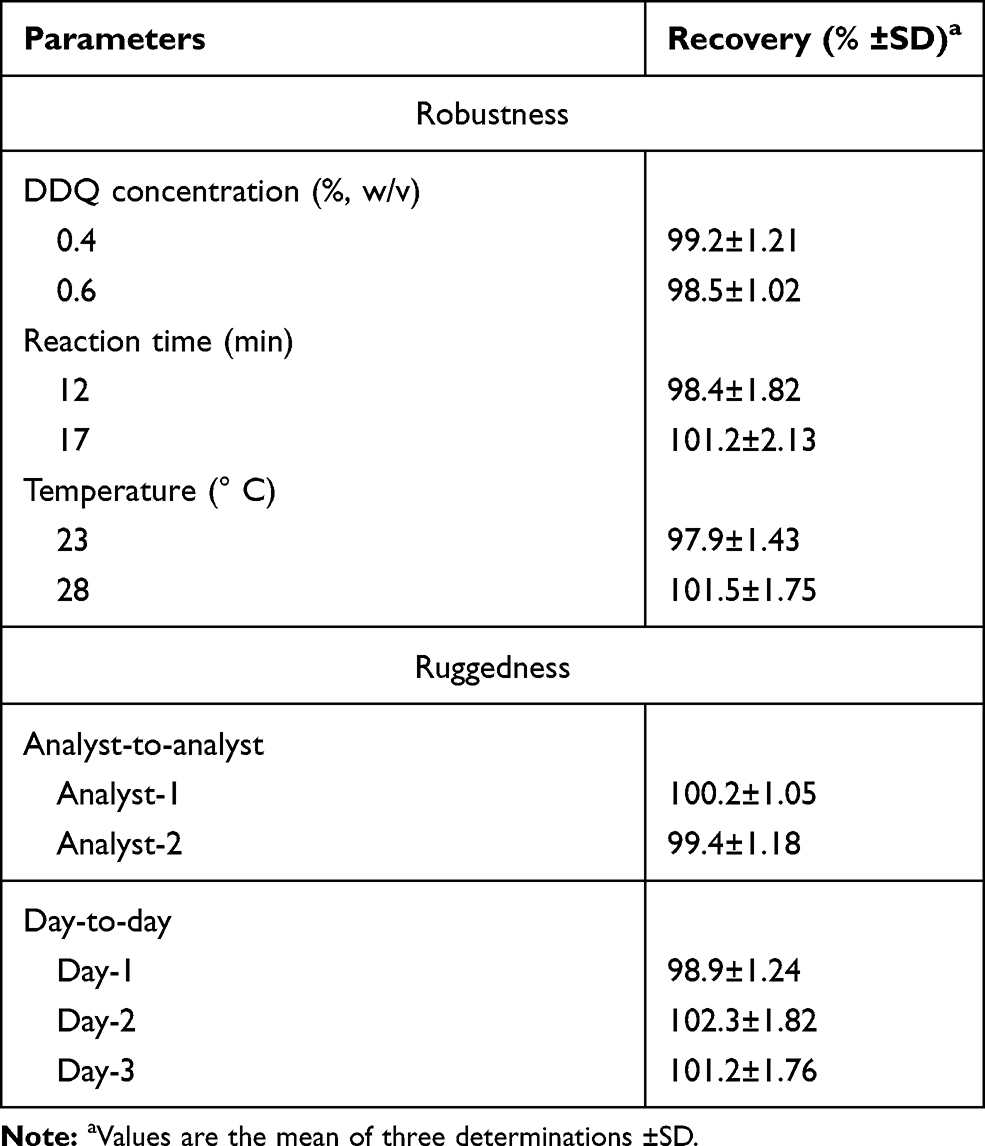 |
Table 8 Robustness and Ruggedness of the Proposed 96-microwell Spectrophotometric Assay for Determination of LFB |
Ruggedness was also tested by carrying out the assay by two different analysts on three different days. Results obtained from analyst-to-analyst and day-to-day variations were reproducible, as the RSD values did not exceed 2% (Table 8).
The laboratory-made tablets were prepared and subjected to the analysis by the proposed assay for their LFB content. The obtained mean percentage recovery, relative to the claimed amounts, was 100.58±1.14%. This good recovery value indicated the reliability of the proposed assay for routine application for the accurate determination of LFB in its tablets.
Discussion
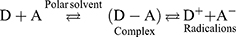
This appearance of a new absorption band upon the reaction of LFB with DDQ, and the gradual continuous increase in this band with the reaction time and LFB concentrations was confirmative for the formation of LFB-DDQ product. The shape and pattern of the resulting absorption bands of LFB with DDQ are similar to that of radical anion of the DDQ acceptor obtained by the reduction method and coincide with the reported literature.57,58 Therefore, the reaction product was postulated to be a CT complex between LFB as an electron donor (D) and DDQ as a π-electron acceptor (A), and the reaction proceeded in polar solvent (methanol) to form the CT complex (D-A), which was subsequently dissociated by the high ionizing power of the polar solvent and formed the radical anion of the acceptor:
For further confirmation of the CT nature of the reaction, the red color disappeared upon acidification of the reaction mixture with mineral acids. All these observations are confirmative for the formation of the CT complex between LFB and DDQ.
The good correlations of ε values obtained for the reaction different solvents with both the dielectric constants53 and polarity indexes54 of the solvents was attributed to the complete electron transfer from LFB (electron donor; D) to DDQ (electron acceptor; A) that takes place in the polar solvents. For subsequent experiments, methanol was selected for the subsequent experiments because it also offered high ε value. This was attributed to the relatively high dielectric constant of methanol that promotes maximum yield of radical anion of DDQ, in addition to its high solvating power for both LFB and DDQ.
The DDQ:LFB ration (2:1) suggested that two electron-donating sites on the LFB molecule participated in the formation of the colored CT complex with DDQ, and two DDQ molecules were required for formation of the complex. In order to assign these two sites among the multiple electron-donating sites which are available on the LFB molecule (Figure 1), energy minimization for the LFB molecule was conducted and the electron density on each atom was calculated. The calculated electron densities located on each of the LFB atoms are given on the energy-minimized LFB molecule (Figure 9A). These cumulative results (the molar ratio and computational molecular modeling), confirmed that the nitrogen atom of the primary amino group (–NH2) attached to the 3-position of the indazole ring and the nitrogen atom of the 2-position of the indazole ring itself are the electron-donating sites on LFB molecules which involved in the formation of its CT complex with DDQ. The other anticipated atoms did not participate in the formation of the CT complex. This was explained by the fact that certain electron density and geometrical conformation space were required for participation in CT reaction and successful formation of CT complexes.3
The formation of the CT complex was strongly evidenced by the presence of the main characteristic bands of the donor (LFB) and acceptor (DDQ) in the FT-IR spectrum of the CT complex. The interpretation of the FT-IR spectrum of the CT complex was concerned with the changes in intensities and shifts in vibrational frequencies compared with those of the LFB and DDQ.2
In the FT-IR spectrum of free DDQ (Figure 11), the vibration of C≡N occurred at 2255 cm−1, while in the complex, it occurred at 2249 cm−1 (Table 2). The presence of C≡N of DDQ at lower frequency in the spectrum of the complex indicated that the group did not form covalent hydrogen bonding upon complexation with LFB. The DDQ intensities and vibration frequencies of C=O (at 1674 cm−1) and C-Cl (at 893 and 800 cm−1) exhibited decrease in intensities and shifts to lower frequencies upon complexation as the C=O occurred at 1667 cm−1 and the C-Cl occurred at 891 and 764 cm−1. These observations clearly confirm that the C≡N group of DDQ participates in the complexation process. In addition, the two C≡N groups of DDQ are electron-withdrawing and exist in conjugated bonding system making the aromatic ring an electron-withdrawing region and the π*-CN charge transfer from LFB more easily. This assumes that the complexation of DDQ and LFB occurred via n-π* and/or π-π* charge transfer from the highest occupied molecule orbital (HOMO) of LFB to the lowest unoccupied molecular orbital (LUMO) of DDQ.
The characteristic band of N-H stretching of the primary aromatic amine of free LFB is observed at 3468 and 3383 cm−1, and the band of N-H stretching of the 1-position of the indazole ring is observed at 3244 cm−1. The N-H stretching frequency is observed at 1611 cm−1 that overlapped with that of the aromatic C=C stretching. The C-N stretching is observed at 1317 and 1227 cm−1. In the CT complex, all these bands were shifted to lower frequencies (Table 2). Deformation of the N-H of both aromatic -NH2 and N-H of the indazole ring is observed in the spectrum of the complex (Figure 11).
In the 1H-NMR spectra of the CT complexes, the protons of the donor are generally shifted to lower fields.11 Downfield shifts (Δδ=0.0.27–0.45 ppm) of the protons of both the aromatic -NH2 and N-H of the indazole ring were observed in the spectrum of the LFB-DDQ CT complex, which appeared at δ 3.85–3.9 (s, 2H) and 11.73 (s, 1 H) ppm, respectively; compared with 4.12–4.35 and 11.43 ppm (respectively) in the spectrum of LFB alone. The 1H-NMR spectrum of the LFB-DDQ CT complex showed no considerable shifts in the signals of urea protons or the aromatic protons of the 2-fluoro-5-methylphenyl moiety.
These complementary observations, taking the results of molecular modelling in account, confirmed that the nitrogen atoms of the aromatic –NH2 and tertiary nitrogen of the indazole ring are the two electron-donating sites on LFB molecule that participated in the formation of the CT complex with DDQ.
Our interest in developing a CT-based spectrophotometric assay for LFB because of the inherent simplicity of the technique and absence of literature from any spectrophotometric assay for LFB. Besides, the existing UPLC-MS/MS59,60 and spectrofluorimetric61 assays are either instrumentally intensive, have limited throughputs or were not validated for analysis of LFB bulk and dosage forms. Because the conventional CT-based spectrophotometric assays have limited throughput and consume large volumes of organic solvents, which are expensive and more importantly cause toxic effects to the analysts,62–64 the present study was devoted to developing a new spectrophotometric assay for LFB, devoid of these drawbacks, by carrying out its CT reaction with DDQ in a 96-microwell assay plate and measuring the color intensities by an absorbance microplate reader. This methodological approach uses small volumes of organic solvents and offers high-throughput analysis that meets the demand of pharmaceutical quality control laboratories because it allows the analyst to quickly conduct large numbers of samples and collect massive data, which may exhaust resources in terms of time, effort and reagent.65,66
The validation parameters obtained from the validation studies of the 96-microwell assay described in this article confirmed the reliability of the assay for its routine use in QC of LFB in pharmaceutical industries.
Conclusion
The formation of CT complex of LFB and DDQ was studied, and its optimum experimental conditions were established. The complex was characterized by spectrometric techniques. The spectral data indicated that the interaction between LFB and DDQ occur through n → π* interaction with a molar ratio of 1:2 (LFB:DDQ). According to the reaction stoichiometry and computational molecular modeling of the complex, the reaction pathway was postulated. The results showed that the investigated CT-complex is stable, exothermic and spontaneous. The reaction was adapted as a basis for a new 96-microwell spectrophotometric assay for determination of LFB in its bulk and dosage form (tablets). The developed assay is the first report presenting a spectrophotometric assay for LFB. The assay provided a high throughput that enables analysis of large a number of samples in a relatively short time. In addition, the assay is considered eco-friendly as it consumes low volumes of organic solvents when applied in pharmaceutical quality control laboratories.
Abbreviations
CT, charge transfer; LFB, linifanib; QC, quality control; DDQ, 2,3-dichloro-3,5-dicyano-1,4-benzoquinone; RTKIs, receptor tyrosine kinase inhibitors; VEGFR, vascular endothelial growth factor receptor; PDGFR, platelet-derived growth factor receptor; LOD, limit of detection; LOQ, limit of quantitation; RSD, relative standard deviation.
Acknowledgments
The authors would like to extend their appreciation to the Deanship of Scientific Research at King Saud University for its funding of this research through the research group project No. RGP-225.
Disclosure
The authors report no conflicts of interest in this work.
References
1. Mulliken RS, Pearson WB. Molecular Complexes. Wiley Publishers; 1969.
2. Foster R. Organic Charge-Transfer Complexes. Academic Press; 1969.
3. Das SK, Krishnamorthy G, Dofra SK. Excited state intramolecular proton transfer in 2-(2’-hydroxyphenyl)-1H-naphth-[2,3-d]-imidazole: effects of solvents and pH. Can J Chem. 2000;78(2):191–205. doi:10.1139/v99-244
4. Datta AS, Bagchi S, Chakrabortty A, et al. Studies on the weak interactions and CT complex formations between chloranilic acid, 2,3-dichloro-5,6-dicyano-p-benzoquinone, tetracyanoethylene and papaverine in acetonitrile and their thermodynamic properties, theoretically, spectrophotometrically aided by FTIR. Spectrochim Acta A. 2015;146:119–128.
5. Liu H, Liu Z, Jiang W, et al. Tuning the charge transfer properties by optimized donor –acceptor cocrystal for FET applications: from P type to N type. J Solid State Chem. 2019;274:47–51. doi:10.1016/j.jssc.2019.03.017
6. Murugesan V, Saravanabhavan M, Sekar M. Synthesis, spectral, structural analysis and biological evaluation of a new hydrogen-bonded charge-transfer complex: 2,3-dimethylquinoxalinium-p-toluenesulfonate. J Photochem Photobiol B. 2014;140:20–27. doi:10.1016/j.jphotobiol.2014.07.003
7. Singh N, Khan IM, Ahmad A, et al. Preparation, spectral investigation and spectrophotometric studies of proton transfer complex of 2,2′-bipyridine with 3,5-dinitrobenzoic acid in various polar solvents. J Mol Struct. 2014;1065–1066:74–85. doi:10.1016/j.molstruc.2014.02.017
8. Almalki ASA, Alhadhrami A, Adam AMA, et al. Preparation of elastic polymer slices have the semiconductors properties for use in solar cells as a source of new and renewable energy. J Photochem Photobiol A. 2018;361:76–85. doi:10.1016/j.jphotochem.2018.05.001
9. Almalki ASA, Alhadhrami A, Obaid RJ, et al. Preparation of some compounds and study their thermal stability for use in dye sensitized solar cells. J Mol Liq. 2018;261:565–582. doi:10.1016/j.molliq.2018.04.057
10. Darwish IA, Wani TA, Khalil NY, et al. Microwell spectrophotometric method with high-throughput for determination of the macrolide antibiotics in their pharmaceutical formulations. Latin Am J Pharm. 2014;33:928–934.
11. Saleh GA, Askal HF, Darwish IA, et al. Spectroscopic analytical study for the charge-transfer complexation of certain cephalosporins with chloranilic acid. Anal Sci. 2003;19(2):281–287. doi:10.2116/analsci.19.281
12. Darwish IA, Alshehri JM, Alzoman NZ, et al. Charge-transfer reaction of 1,4-benzoquinone with crizotinib: spectrophotometric study, computational molecular modeling and use in development of microwell assay for crizotinib. Spectrochim Acta A. 2014;131:347–354. doi:10.1016/j.saa.2014.04.099
13. Darwish IA, Alshehri JM, Alzoman NZ, et al. Charge-transfer reaction of chloranilic acid with crizotinib: spectrophotometric study, computational molecular modeling and use in development of microwell assay for crizotinib. J Soln Chem. 2014;43(7):1282–1295. doi:10.1007/s10953-014-0203-2
14. Darwish IA, Wani TA, Khalil NY, et al. High throughput microwell spectrophotometric assay for olmesartan medoxomil in tablets based on its charge-transfer reaction with DDQ. Acta Pharm. 2014;64(1):63–75. doi:10.2478/acph-2014-0008
15. Darwish IA, Mahmoud AM, Al-majed AA. Novel analytical approach for reducing the consumption of organic solvents in the charge transfer-based spectrophotometric analysis of losartan potassium. Int J Res Pharm Sci. 2010;1:391–395.
16. Khalil NY, Wani TA, Darwish IA, et al. Charge-transfer reaction of cediranib with 2,3-dichloro-3,5-dicyano-1,4-benzoquinone: spectrophotometric investigation and use in development of microwell assay for cediranib. Trop J Pharm Res. 2015;14:1667–1672.
17. Alzoman NZ, Sultan MA, Maher HM, et al. Analytical study for the charge-transfer complexes of rosuvastatin calcium with π-acceptors. Molecules. 2013;18(7):7711–7725. doi:10.3390/molecules18077711
18. Darwish IA, Wani TA, Khalil NY, et al. Development of a novel microwell assay with high throughput for determination of olmesartan medoxomil in its tablets. Chem Cent J. 2012;6(1):1–7. doi:10.1186/1752-153X-6-1
19. Wani TA, Ahmad A, Zargar S, et al. Use of response surface methodology for development of new microwell-based spectrophotometric method for determination of atrovastatin calcium in tablet. Chem Cent J. 2012;6(1):1–9. doi:10.1186/1752-153X-6-134
20. Man L, Li T, Wu X, et al. Synthesis, crystal structure, vibrational spectra, nonlinear optical property of an organic charge-transfer compound-4-nitrobenzyl isoquinolinium picrate based on DFT calculations. J Mol Struct. 2019;1175:971–978. doi:10.1016/j.molstruc.2018.07.054
21. Miyan L, Zulkarnain Ahmad A. Spectroscopic and spectrophotometric studies on hydrogen bonded charge transfer complex of 2-amino-4-methylthiazole with chloranilic acid at different temperatures. J Mol Liq. 2018;262:514–526. doi:10.1016/j.molliq.2018.04.084
22. Alam K, Khan IM. Crystallographic, dynamic and Hirshfeld surface studies of charge transfer complex of imidazole as a donor with 3,5-dinitrobenzoic acid as an acceptor: determination of various physical parameters. Org Electron. 2018;63:7–22. doi:10.1016/j.orgel.2018.08.037
23. Chaudhuri T, Santra S, Jana S, et al. Determination of vertical ionization potential of nitroso-benzoimidazothiazole using charge transfer interaction with a series of acceptors. Spectrochim Acta A. 2018;204:403–408. doi:10.1016/j.saa.2018.06.083
24. Gogoi P, Mohan U, Borpuzari MP, et al. UV–Vis spectroscopy and density functional study of solvent effect on the charge transfer band of the n → σ* complexes of 2-methylpyridine and 2-chloropyridine with molecular iodine. J Mol Struct. 2017;1131:114–123. doi:10.1016/j.molstruc.2016.11.040
25. Misra P, Badoga S, Chenna A, et al. Denitrogenation and desulfurization of model diesel fuel using functionalized polymer: charge transfer complex formation and adsorption isotherm study. Chem Eng J. 2017;325:176–187. doi:10.1016/j.cej.2017.05.033
26. National Library of Medicine. COVID-19 is an emerging, rapidly evolving situation; 2021. Available from: https://pubchem.ncbi.nlm.nih.gov/compound/Linifanib.
27. Faguet GB. A brief history of cancer: age-old milestones underlying our current knowledge database. Int J Cancer. 2015;136(9):2022–2036. doi:10.1002/ijc.29134
28. Glade-Bender J, Kandel JJ, Yamashiro DJ. VEGF blocking therapy in the treatment of cancer. Exper Opin Biol Ther. 2003;3(2):263–276. doi:10.1517/14712598.3.2.263
29. Zhao Y, Adjei AA. Targeting angiogenesis in cancer therapy: moving beyond vascular endothelial growth factor. Oncol. 2015;20(6):660–673. doi:10.1634/theoncologist.2014-0465
30. Yu J, Ustach C, Kim HR. Platelet-derived growth factor signaling and human cancer. J Biochem Mol Biol. 2003;36(1):49–59. doi:10.5483/bmbrep.2003.36.1.049
31. Dunn IF, Heese O, Black PM. Growth factors in glioma angiogenesis: fGFs, PDGF, EGF, and TGFs. J Neurooncol. 2000;50(1/2):121–137. doi:10.1023/A:1006436624862
32. Shieh YS, Lai CY, Kao YR, et al. Expression of Axl in lung adenocarcinoma and correlation with tumor progression. Neoplasia. 2005;7:1058–1064. doi:10.1593/neo.05640
33. Halsted WS. The results of operations for the cure of cancer of the breast performed at the Johns Hopkins hospital from June, 1889, to January, 1894. Ann Surg. 1894;20:497–555. doi:10.1097/00000658-189407000-00075
34. Fisher B, Anderson S, Bryant J, et al. Twenty-year follow-up of a randomized trial comparing total mastectomy, lumpectomy, and lumpectomy plus irradiation for the treatment of invasive breast cancer. N Engl J Med. 2002;347(16):1233–1241. doi:10.1056/NEJMoa022152
35. Hubbard SR, Miller WT. Receptor tyrosine kinases: mechanisms of activation and signaling. Curr Opin Cell Biol. 2007;19(2):117–123. doi:10.1016/j.ceb.2007.02.010
36. Horinouchi H, Yamamoto N, Nokihara H, et al. A Phase 1 study of linifanib in combination with carboplatin/paclitaxel as first-line treatment of Japanese patients with advanced or metastatic non-small cell lung cancer (NSCLC). Cancer Chemother Pharmacol. 2014;74(1):37–43. doi:10.1007/s00280-014-2478-9
37. Li BT, Barnes TA, Chan DL, et al. The addition of anti-angiogenic tyrosine kinase inhibitors to chemotherapy for patients with advanced non-small-cell lung cancers: a meta-analysis of randomized trials. Lung Cancer. 2016;102:21–27. doi:10.1016/j.lungcan.2016.10.004
38. Chen J, Guo J, Chen Z, et al. Linifanib (ABT-869) potentiates the efficacy of chemotherapeutic agents through the suppression of receptor tyrosine kinase-mediated AKT/mTOR signaling pathways in gastric cancer. Sci Rep. 2016;6(1):29382. doi:10.1038/srep29382
39. Dabney R, Devine R, Sein N, et al. New agents in renal cell carcinoma. Target Oncol. 2014;9(3):183–193. doi:10.1007/s11523-013-0303-8
40. Hsu HW, Wall NR, Hsueh CT, et al. Combination antiangiogenic therapy and radiation in head and neck cancers. Oral Oncol. 2014;50:19–26. doi:10.1016/j.oraloncology.2013.10.003
41. Paulus YM, Sodhi A. Anti-angiogenic therapy for retinal disease. Handb Pharmacol. 2017;242:271–307.
42. Wong CI, Koh TS, Soo R, et al. Phase I and biomarker study of abt-869, a multiple receptor tyrosine kinase inhibitor, in patients with refractory solid malignancies. J Clin Oncol. 2009;27:4718–4726. doi:10.1200/JCO.2008.21.7125
43. Sadeghian-Rizi S, Khodarahmi GA, Sakhteman A. Biological evaluation, docking and molecular dynamic simulation of some novel diaryl urea derivatives bearing quinoxalindione moiety. Res Pharm Sci. 2017;12(6):500–509. doi:10.4103/1735-5362.217430
44. London N, Miller RM, Krishnan S, et al. Covalent docking of large libraries for the discovery of chemical probes. Nature Chem Biol. 2014;10(12):1066–1072. doi:10.1038/nchembio.1666
45. Santiago T, DeVaux RS, Kurzatkowska K, et al. Surface-enhanced Raman scattering investigation of targeted delivery and controlled release of gemcitabine. Int J Nanomed. 2017;12:7763–7776. doi:10.2147/IJN.S149306
46. Running L, Espinal R, Hepel M. Controlled release of targeted chemotherapeutic drug dabrafenib for melanoma cancers monitored using surface-enhanced Raman scattering (SERS) spectroscopy. Mediterr J Chem. 2018;7(1):18–27. doi:10.13171/mjc71/01803171500-hepel
47. Smith M, Hepel M. Controlled release of targeted anti-leukemia drugs azacitidine and decitabine monitored using surface-enhanced Raman scattering (SERS) spectroscopy. Mediterr J Chem. 2017;6:125–132. doi:10.13171/mjc64/01706081223-hepel
48. Benesi HA, Hildebrand J. Physical Pharmacy.
49. Job P. Formation and Stability of Inorganic Complexes in Solution. Ann Chem. 1963;16:97.
50. Skoog DA. Principle of Instrumental Analysis.
51. Karipcin F, Dede B, Caglar Y, et al. A new dioxime ligand and its trinuclear copper(II) complex: synthesis, characterization and optical properties. Opt Commun. 2007;272(1):131–137. doi:10.1016/j.optcom.2006.10.079
52. Makuła P, Pacia M, Macyk W. How to correctly determine the band gap energy of modified semiconductor photocatalysts based on UV–Vis spectra. J Phys Chem Lett. 2018;9(23):6814–6817. doi:10.1021/acs.jpclett.8b02892
53. Vogel AI, Tatchell AR, Furnis BS, et al. Vogel’s Textbook of Practical Organic Chemistry.
54. Polarity Index. Burdick & Jackson solvents. Available from: http://macro.lsu.edu/howto/solvents/polarity%20index.htm.
55. Pandeeswaran M, Elango KP. Solvent effect on the charge transfer complex of oxatomide with 2,3-dichloro-5,6-dicyanobenzoquinone. Spectrochim Acta A. 2006;65(5):1148–1153. doi:10.1016/j.saa.2005.12.037
56. ICH Guideline Q2(R1). Validation of analytical procedures: text and methodology.
57. Melby LR, Patai S, Ed. The Chemistry of the Cyano Group. Interscience Publisher/John Wiley & Sons; 1970.
58. Yamagishi A. Solvation effects on the electron-transfer reaction of TCNQ anion radical and 2,3-dichloro-5,6-dicyano-p-benzoquinone. Bull Soc Jpn. 1975;48:2440–2447. doi:10.1246/bcsj.48.2440
59. Iqbal M, Ezzeldin E, Wani TA, et al. Simple, sensitive and rapid determination of linifanib (ABT-869), a novel tyrosine kinase inhibitor in rat plasma by UHPLC-MS/MS. Chem Cent J. 2014;8(1):1–8. doi:10.1186/1752-153X-8-13
60. Rodila RC, Kim JC, Ji QC, et al. High-throughput, fully automated liquid/liquid extraction liquid chromatography/mass spectrometry method for the quantitation of a new investigational drug ABT-869 and its metabolite A-849529 in Human plasma samples. Rapid Commun Mass Spectrom. 2006;20(20):3067–3075. doi:10.1002/rcm.2703
61. Zawaneh AH, Khalil NN, Ibrahim SA, et al. Micelle-enhanced direct spectrofluorimetric method for the determination of linifanib: application to stability studies. Luminescence. 2017;32(7):1162–1168. doi:10.1002/bio.3304
62. Wennborg H, Bonde JP, Stenbeck M, et al. Adverse reproduction outcomes among employee in biomedical research laboratories. J Scand Work Environ Health. 2002;28(1):5–11. doi:10.5271/sjweh.640
63. Wennborg H, Lennart B, Harri V, et al. Pregnancy outcome of personnel in Swedish biomedical research laboratories. Occup Environ Med. 2000;42(4):438–446. doi:10.1097/00043764-200004000-00022
64. Kristensen P, Hilt B, Svendsen K, et al. Incidence of lymphohaematopoietic cancer at university laboratory: a cluster investigation. Eur J Epidemiol. 2008;23(1):11–15. doi:10.1007/s10654-007-9203-5
65. Burbaum JJ. Miniaturization technologies in HTS: how fast, how small, how soon? Drug Discov Today. 1998;3(7):313–322. doi:10.1016/S1359-6446(98)01203-3
66. Sittampalam GS, Kahl SD, Janzen WP. High-throughput screening: advances in assay technologies. Curr Opin Chem Biol. 1997;1(3):384–391. doi:10.1016/S1367-5931(97)80078-6
 © 2021 The Author(s). This work is published and licensed by Dove Medical Press Limited. The
full terms of this license are available at https://www.dovepress.com/terms
and incorporate the Creative Commons Attribution
- Non Commercial (unported, 3.0) License.
By accessing the work you hereby accept the Terms. Non-commercial uses of the work are permitted
without any further permission from Dove Medical Press Limited, provided the work is properly
attributed. For permission for commercial use of this work, please see paragraphs 4.2 and 5 of our Terms.
© 2021 The Author(s). This work is published and licensed by Dove Medical Press Limited. The
full terms of this license are available at https://www.dovepress.com/terms
and incorporate the Creative Commons Attribution
- Non Commercial (unported, 3.0) License.
By accessing the work you hereby accept the Terms. Non-commercial uses of the work are permitted
without any further permission from Dove Medical Press Limited, provided the work is properly
attributed. For permission for commercial use of this work, please see paragraphs 4.2 and 5 of our Terms.