Back to Journals » OncoTargets and Therapy » Volume 13
Characterization of Triple-Negative Breast Cancer MDA-MB-231 Cell Spheroid Model
Received 14 February 2020
Accepted for publication 12 May 2020
Published 11 June 2020 Volume 2020:13 Pages 5395—5405
DOI https://doi.org/10.2147/OTT.S249756
Checked for plagiarism Yes
Review by Single anonymous peer review
Peer reviewer comments 2
Editor who approved publication: Dr Leo Jen-Liang Su
Zhaoming Huang, Panpan Yu, Jianhui Tang
Department of Medical Cosmetology, Xianning Central Hospital, The First Affiliated Hosptial of Hubei University of Science and Technology, Xianning, Hubei 437000, People’s Republic of China
Correspondence: Zhaoming Huang
Department of Medical Cosmetology, Xianning Central Hospital, The First Affiliated Hosptial of Hubei University of Science and Technology, 228 Jingui Road, Xianning, Hubei 437000, People’s Republic of China
Email [email protected]
Background: The tumor three-dimensional (3D) spheroid model in vitro is effective on detecting malignant cells and tumorigenesis, and assessing drug resistance. Compared with two-dimensional (2D) monolayer culture, breast cancer (BC) spheroids more accurately reflect the complex microenvironment in vivo, which have been extensively reported in BC research. MDA-MB-231 cells, the triple-negative breast cancer (TNBC) cell line, display representative epithelial to mesenchymal transition (EMT) associated with BC metastasis. However, the characterization of MDA-MB-231 spheroids has been largely unknown at present, which requires further attention.
Materials and Methods: Microwell array was conducted for the formation of MDA-MB-231 spheroids. In addition, H&E staining, immunohistochemistry (IHC), CellTiter-Glo® 3D cell viability assay, and flow cytometry were performed to investigate the structure and growth characteristics. Besides, Transwell and scratch healing assays were carried out to detect the migratory capacities compared with 2D culture. Western blotting and confocal fluorescence were selected to detect the expression of EMT-associated proteins. Additionally, the half maximal inhibitory concentration (IC50) values of antitumor compounds Carboplatin and Doxorubicin were measured to assess drug resistance.
Results: The MDA-MB-231 spheroids were viable, which maintained a compact structure with zonation features for up to 9 days. Moreover, those spheroids had a slower growth rate than those cultured as a monolayer and differential zones of proliferation. The migratory capacities were significantly enhanced by transferring the spheroids to 2D adherent culture. Compared with 2D culture, the levels of EMT-associated proteins were significantly up-regulated in spheroids. Furthermore, toxicity assessment showed that spheroids exhibited an increased resistance to the antitumor compounds.
Conclusion: This study develops the simple spheroids and demonstrates their structure, growth and proliferation characteristics. According to our results, the spheroids are associated with superior EMT and high resistance to toxicological response compared with the standard 2D monocultures.
Keywords: triple-negative breast cancer, spheroid, epithelial to mesenchymal transition, three-dimensional culture
Introduction
Breast cancer (BC) has post a major threat to female health worldwide, and its morbidity shows an increasing trend year by year.1 Recent statistical data suggest that, 40% BC patients still develop distant metastasis (DM) after standardized treatment, which eventually leads to death.2 Metastasis represents the fundamental feature of malignant tumor, which is associated with very complex mechanism.
Traditionally, the mechanisms of metastatic BC progression have been widely studied in the in vitro two-dimensional (2D) cultures by exposure to external stimulus and in xenograft models by manipulating various signaling pathways and molecular targets.3,4 However, these do not represent the native events of BC progression. Three-dimensional (3D) culture systems provide unique opportunities to culture cancer cells alone or in combination with other cell types in a spatially relevant manner, and they encourage cell and cell-matrix interactions that closely mimic the tumor environment.5,6 Due to these interactions, the 3D-cultured cells acquire morphological and cellular characteristics relevant to those of tumors in vivo. Spheroids are the most extensively characterized and widely applied models for various 3D culture systems.7 As demonstrated by some studies, spheroids increase the secretion of vascular endothelial growth factor (VEGF), a protein known to stimulate vasculogenesis and angiogenesis in tumor cells.8 At present, tumor spheroids remain the best characterized and widely applied 3D models for investigating various aspects in cancer biology and antitumor drug tests.9
According to several studies, the BC cell lines cultured in 3D spheroids have superior relevant functions 10–12. For instance, the BT-474 spheroids modulate the distributions of BC stem cell population and human epidermal growth factor receptor-2 (HER2), and show a higher anti-apoptotic level than those cultured in 2D monolayer.13,14 Besides, MCF-7 spheroids reveal the role of tumor microenvironment in tumor metastasis, and they are more resistant to drug treatments than those cultured as a 2D monolayer.15 Metastasis is a multi-step process involving numerous interactions between a tumor and its microenvironment. In the process of metastasis, the first step is the transient transformation of the typical characteristics of cancer epithelial cells to those of migrating and invasive cells, a process also referred to as epithelial to mesenchymal transition (EMT).16 Triple-negative breast cancer (TNBC), an aggressive phenotype associated with dismal survival, is considered as the most dangerous among all types of BC.17 TNBC MDA-MB-231 cells show representative EMT associated with cancer progression. However, there are no detailed characterizations on the structure and biological characteristics of MDA-MB-231 spheroids, which requires further attention.
This study aimed to characterize the structure and proliferation features of the TNBC spheroid model, and to examine the levels of EMT and whether spheroids showed higher resistance to drug therapies than those cultured in the traditional 2D culture. Our results demonstrated the growth and proliferation characteristics of the MDA-MB-231 spheroids, as well as their superior EMT and higher resistance to toxicological response.
Materials and Methods
Preparation of Hydrogel Microwell Arrays
Our 3D nonadhesive hydrogel microwell plate was modified to fabricate the spheroid assembly as described previously.18 In brief, the hydrogen microwell array was utilized in a microwell mould to form microwell on the agarose surface. The nonadhesive property of agarose prevented cells from adhering, and cells settled into the micropore to form a spheroid due to the action of gravity. To be specific, the agarose (Sigma) hydrogels were prepared by dissolving the 1.5% (w/v) agarose powders in water. Then, the autoclaving agarose solution was added into the cell culture plate after it was cooled to 65 °C. Afterwards, a sterilized mould was carefully placed on the top of the liquid agarose. After agarose solidification, the gels were separated from the mould in the agarose microwells plate.
Cell Culture
MDA-MB-231 cells were obtained from American Type Culture Collection (ATCC, Wuhan, China), and cultured in the Roswell Park Memorial Institute 1640 medium supplemented with 10% fetal bovine serum (FBS, Biological Industries, Israel). Meanwhile, the 2D monolayer cells were seeded into the tissue culture plate. Then, the MDA-MB-231cells (2×10⁶cells/mL) were seeded into the microwell plate to form spheroids. The culture medium was replaced once every two days and spheroids were cultured for up to 14 days. Moreover, images of spheroids in culture were taken by the phase-contrast microscopy via the 4× objective.
Histological and Immunohistochemical (IHC) Analyses
MDA-MB-231 spheroids were collected and washed with PBS, fixed in the 4% paraformaldehyde for 2 h, embedded within the 2% histolgel in 4% paraformaldehyde, and finally embedded in paraffin. Later, spheroids were cut into 3 μm sections and stained with hematoxylin and eosin (H&E). Thereafter, IHC analysis for Ki67 (1:200, Abcam, Shanghai, China) was performed to detect the cell proliferation makers.
Cell Proliferation and Apoptosis Assays
The CellTiter-Glo® 3D Cell Viability Assay (promega, Beijing, china), a test system to detect the amount of present ATP proportional to the cell number, was employed to estimate the cell proliferation. Later, the CellTiter-Glo® 3D reagent was added into each well at the equivalent volume of cell culture medium in the well. Then, the contents were mixed vigorously for 5 min to induce cell lysis, and the plate was incubated at room temperature for an additional 25 min to stabilize the luminescent signal. Afterwards, 200 µL supernatants were transferred in technical replicates into the 96-well opaque-walled plate and the luminescence was measured. In cell apoptosis assay, both 3D and 2D MDA-MB-231 cells were cultured in the serum-free medium before trypsin digestion. Then, cells were stained using the annexin V-fluorescein isothiocyanate (FITC)/propidium iodide (PI) kit (Beyotime, Beijing, China) according to the manufacturer’s instructions. Briefly, after trypsin digestion in the absence of EDTA, 5×10⁵ cells were collected and washed twice with the precooled PBS, and then 100 μL binding buffer was added for cell resuspension. Later, 5 μL annexin V-FITC and 10 μL PI standing solutions were mixed gently in dark at room temperature for 5 min, and the apoptosis level was measured by flow cytometry.
Transwell Assay
Migration assay was completed by seeding cells on the upper chambers with no membrane coating using a 24-well insert (Corning, USA), followed by overnight incubation. In invasion assay, cells were planted on the top of chambers (Corning, USA) covered by Matrigel following the manufacturer’s instructions. Briefly, the 3D spheroids and 2D cells were digested using trypsin/EDTA, then cells were planted (5 × 10⁴ cells) into the 500 μL serum-free 1640 medium and seeded onto the upper chamber. The lower chamber was filled with 1640 medium supplemented with 10% FBS as the chemoattractant. The serum-free medium was added into the upper chamber, while the medium containing 10% FBS was added into the lower chamber. At 24 h later, cells on the upper side of the membrane were wiped off, whereas those on the lower side were fixed with cold methanol for 10 min, stained with the 0.1% crystal violet solution for 20 min, and washed with PBS for thrice. Finally, 10 random fields of view (FOV) were selected and cells on each insert were counted using a microscope at ×100 magnification (Zeiss, Germany).
Scratch‑healing Migration Assay
After 9 days of culture, the spheroids were removed from the microwell plate, digested with trypsin/EDTA, and seeded (1 × 10⁵ cells/well) into the 6-well plates under the same 2D culture conditions until the cells reached 90% confluence at 24 h later. Then, cells were scratched using the 200 μL micropipette tip vertically in the middle of each well and washed for thrice to remove the suspension cells. Photographs were captured immediately (0 h) and at 24 h after the scratch assay, and the Image-J software was employed to measure the width of the scratch. The wound healing rate (%)=(scratch width at T0 h − scratch width at T24 h/scratch width at T0 h) × 100%.
Western Blotting Analysis
2D cells and 3D spheroids were resuspended in the cell lysis buffer (Thermo scientific) under sonication treatment. After centrifugation, the protein content in supernatants was determined using a BCA protein quantification kit. In brief, 60 mg proteins from spheroids or monolayer cells were added into the loading sample buffer and boiled for 10 min. Thereafter, proteins were separated by sodium dodecyl sulfate-polyacrylamide gel electrophoresis (SDS-PAGE) and transferred onto the polyvinylidene difluoride (PVDF) membranes. Afterwards, the membranes were incubated with primary antibodies, including anti-E-cadherin (1:1000, Proteintech, Wuhan, China), anti-N-cadherin, and anti-GAPDH (1:2000, Proteintech, Wuhan, China) antibodies, at 4 °C overnight. After extensive washing, the membranes were further incubated with the horseradish peroxidase (HRP)-conjugated secondary antibodies for 1 h. Eventually, the blots were developed using an enhanced chemiluminescence detection system.
Confocal Fluorescence Analysis
Spheroids were taken from the microwell plate at 9 days later. Then, spheroids or cells were fixed with 4% paraformaldehyde, washed with PBS for thrice, and then immersed in PBS containing 0.1% Triton X-100 and 1% normal goat serum for 60 min at room temperature. Afterwards, samples were incubated with the rabbit anti-E-cadherin (1:200, Proteintech, Wuhan, China) and mouse anti-N-cadherin (1:300, Proteintech, Wuhan, China) primary antibodies at 4 °C overnight, and then washed with PBS for thrice. Subsequently, samples were further incubated with FITC-conjugated goat anti-rabbit IgG or FITC anti-mouse IgG secondary antibody (1:400, Abcam, Shanghai, China) for 60 min at room temperature in dark. The nuclear DNA was stained with 4ʹ, 6-diamidino-2-phenylindole (DAPI; Boster, Wuhan, China). Images were acquired using the Leica confocal microscope (Zeiss, Germany).
Drug Studies
Both the 2D and 3D MDA-MB-231 cells were cultured for 2 days prior to treatments with antitumor compounds Carboplatin and Doxorubicin. The CellTiter-Glo® 3D Cell Viability Assay kit was utilized to assess the cell viability according to the above-mentioned protocols, which was plotted as the percentage of untreated control. Measurements were recorded at 72 h after exposure, and the IC50 values were determined using GraphPad Prism (GraphPad Software, USA).
Statistical Analysis
All values were expressed as mean± standard deviation (SD) of at least three independent experiments. One-way analysis of variance (ANOVA) was adopted for comparisons among groups using the Graphpad Prism 7 statistical software (La Jolla, CA, USA). A difference of P < 0.05 was considered as statistically significant.
Results
Formation of the Morphology and Internal Structure of MDA-MB-231 Spheroids
The MDA-MB-231 cells were assembled into the regular spheroids in the agarose microwells plate (Figure 1A and B). To analyze the internal structure, H&E staining was performed on spheroids to visualize the internal cell morphology and arrangement over 14 days. It has been widely accepted that, hypoxia is developed at distances beyond the diffusion capacity of oxygen. Beyond this distance, the innermost cells of spheroid may die due to the difficulties in accessing the oxygen supply and fresh growth medium. In line with the staining results of MDA-MB-231 spheroids, a compact and uniform structure with a well-defined outer perimeter was observed. Cells within the spheroids had organized nuclei and cytoplasm, with no sign of necrosis, although the formation of large and multiple cavities was occasionally observed on day 9 (Figure 1C). However, by day 14, a necrotic core of cavity was formed (Figure 1D), which might be ascribed to the cavities in internal cells as a result of hypoxia and necrosis.
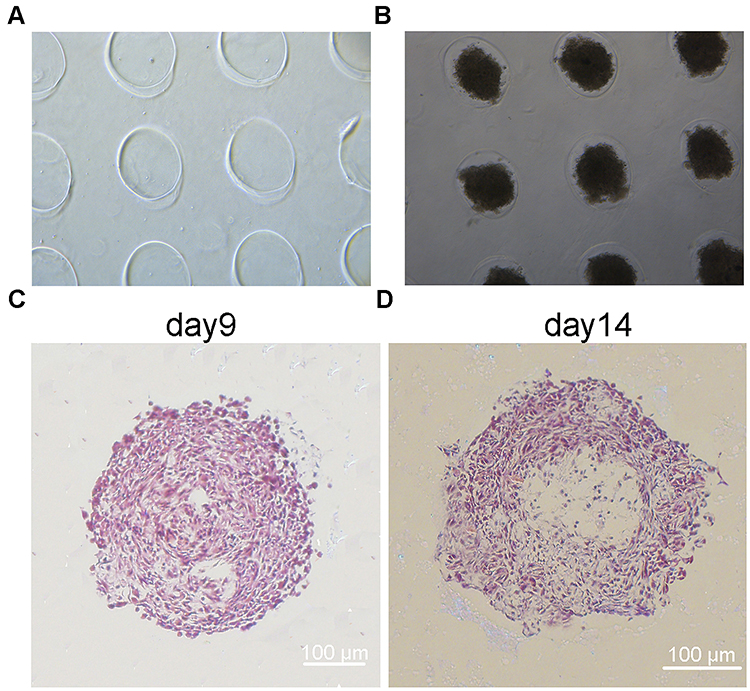 |
Figure 1 Fabrication of the morphology and structure of MDA-MB-231 spheroids. (A) Agarose microwells. (B) MDA-MB-231 spheroids in microwells. (C and D) H&E staining of MDA-MB-231 spheroids fixed at day 9 and 14. Scale bars, 100 μm. |
Proliferation Capacity and Apoptosis Characterizations of the MDA-MB-231 Spheroids
The MDA-MB-231 cells in spheroids showed a slower growth rate from day 1 to day 14. Notably, day 0 was defined as the day when cells were digested by trypsin/EDTA in the flasks and seeded onto the tissue culture plate or microwells plate. The activity index was defined as the normalized ratio of luminescence value to that on day 0. According to our results, the activity index of spheroids became significantly lower than that of 2D culture on day 3 after starting seeding. Furthermore, the activity index of spheroids increased by 1.5-fold on day 9, followed by a 1.3-fold decrease on day 14 (Figure 2A). To reveal cell proliferation within the spheroid, MDA-MB-231 cells were stained with Ki-67. As a result, the number of Ki-67 positive cells declined in spheroid cultures between days 9 and 14 (Figure 2B). Moreover, the positive cells were mainly located near to the spheroid periphery, and a necrosis zone appeared in the spheroid core after 14 days of 3D culture. Beside, this observation further confirmed the necrotic core upon H&E staining. In addition, we further measured the ratios of apoptotic and necrotic cells in 2D and 3D cultures under serum-free condition according to PI uptake and annexin V-FITC labeling assay. On days 3, 6 and 9, the percentages of viable MDA-MB-231cells of 2D and 3D spheroid origins were high, with no statistical significant difference among different groups. When cells were cultured to 14 days, 19.6±3.1% of the harvested cells were apoptotic or necrotic, which was significantly higher than the ratio of 2.69±1.6% in the 2D monolayer and those in others groups (Figure 2C).
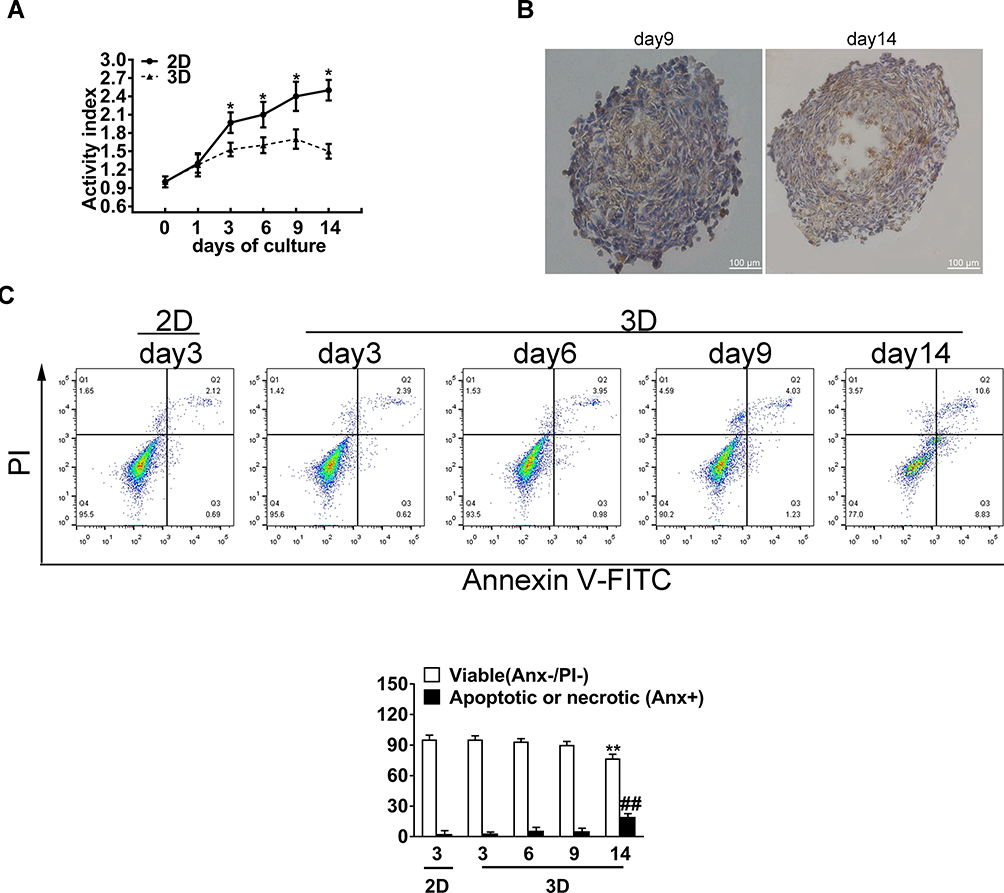 |
Figure 2 The growth characterization of MDA-MB-231 spheroid (3D) cultures. (A) CellTiter-Glo® 3D Cell Viability assays of MDA-MB-231 cells from 3D and 2D cultures. The activity index is defined as a ratio of luminescence value relative to that on the date of seeding (day 0). (B) Histological examination of spheroids, with the proliferation marker Ki67 (brown) and hematoxylin (blue) being used to stain the nuclei. Scale bars, 100 μm. (C) The viability of MDA-MB-231 cells measured by flow cytometry based on PI uptake and annexin V-FITC labeling. The percentage of apoptotic or necrotic cells was significantly higher in the 3D group after 14 days of spheroid culture. Data in (A and C) are expressed as mean ± SD from three independent replicates. *P<0.05,**P<0.01 versus the 2D group; ##P<0.01 versus the 3D group. |
The Spheroid Culture Promoted the Migration and Invasion of MDA‑MB‑231 Cells
To explore the 3D spheroid effect on cell migration and invasion, MDA-MB-231 spheroids were digested with trypsin-EDTA after 9 days of culture, and then transferred onto the monolayer (2D) for further experiments. Upon seeding the MDA‑MB‑231 spheroids back to the 2D monolayer, the cells in spheroids were adherent to tissue culture plate. Additionally, results of Transwell assay showed that, cells obtained from 3D spheroids showed significantly higher invasion and migration capacities than those in 2D culture (Figure 3A and B). Meanwhile, wound healing assay also revealed that, the spheroid-derived MDA‑MB‑231 cells had significantly enhanced migration capacity (Figure 3C)
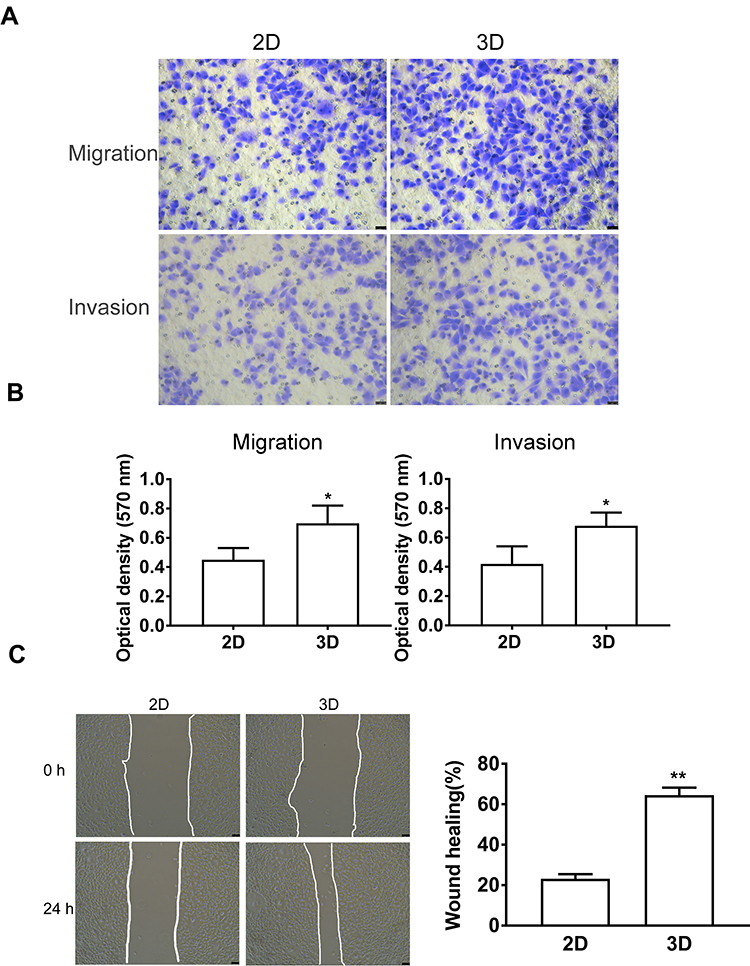 |
Figure 3 Spheroid (3D) culture promotes the migration and invasion of MDA-MB-231 cells. (A) Transwell assay showed that transferring the MDA-MB-231 spheroids to 2D culture significantly increased the migration and invasion capacities than those of 2D after 9 days of culture. Scale bars, 50 μm. (B) Quantitative analysis of the relative migration capacity by measuring the optical density of crystal violet at 570 nm. (C) MDA-MB-231 cells were scratched for 24 h under the serum-free culture condition. Scale bars, 50 μm. Then, wound healing was analyzed using the ImageJ software. Data are expressed as mean ± SD from three independent replicates. *P<0.05, **P<0.01 versus the 2D group. |
The Spheroid Culture Enhanced the Expression of EMT-Associated Proteins in MDA-MB-231 Cells
We further investigated whether the MDA-MB-231 spheroids acquired the aggressive phenotype (EMT). EMT stands for a kind of reversible change in cell phenotype, which is closely associated with cancer metastasis. Generally, the epithelial cells in various tissues are connected by tight and adhesive connection, among which, adhesive connection is formed by E-cadherin molecules on the cell surface. After the activation of the EMT process, the expression of E-cadherin is inhibited, resulting in the loss of typical epithelial polygonal and cobblestone morphology.19,20 Afterwards, the cells obtain the fusiform mesenchymal morphology, and express the mesenchymal markers, in particular for N-cadherin. In this study, we analyzed the expression of EMT-associated proteins by Western blotting assay after days of culture. Our data shown that, the epithelial marker E-cadherin was down-regulated, while the mesenchymal marker N-cadherin was up-regulated with the increase in the 3D culture days (Figure 4A and B). Also, immunofluorescence staining further verified that, compared with 2D culture, 3D spheroids significantly decreased the expression of intracellular E-cadherin, while increased that of N-cadherin in BC cells on day 9 (Figure 4C). Taken together, the up-regulation of mesenchymal marker at protein level, together with the loss of E-cadherin/gain of N-cadherin expression indicated that the conventional EMT might account for the promoted migratory capacity by spheroids.
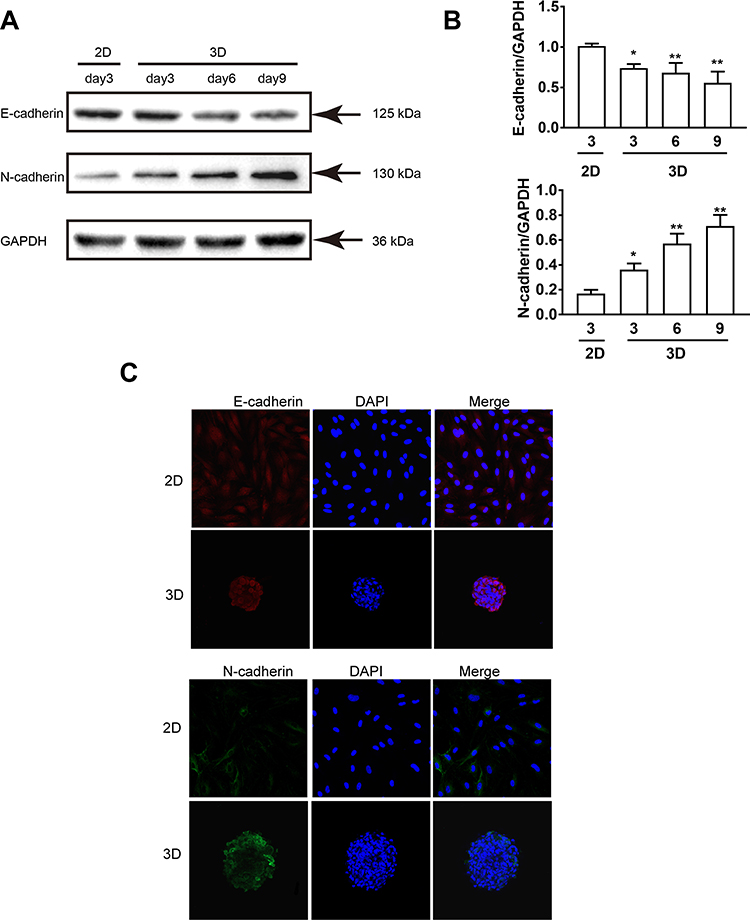 |
Figure 4 MDA-MB-231 spheroids significantly contribute to the expression levels of EMT maker compared with 2D culture. (A) Western blotting analysis on the expression of EMT-associated proteins E-cadherin and N-cadherin. GAPDH was used as the internal reference. (B) The gray value of protein was analyzed by the ImageJ software. (C) Confocal immunofluorescence staining of 3D spheroids and 2D MDA-MB-231 cells with EMT-associated cell markers E-cadherin and N-cadherin after 9 days of culture, and the cell nuclei were stained with DAPI (blue). Scale bars, 200 μm. Data are expressed as mean ± SD from three independent replicates. *P<0.05, **P<0.01 versus the 2D group. |
MDA-MB-231 Spheroids Were More Resistant to Antitumor Compounds
To investigate whether MDA-MB-231 spheroids might be used in drug discovery, the toxicities of Carboplatin and Doxorubicin were assessed during up to 72 h of treatments. As a result, the MDA-MB-231 cells in spheroid group showed drug resistance to varying degrees (Figure 5A). These findings showed the cell viability in the presence of increasing Carboplatin and Doxorubicin concentrations, which exhibited the IC50 values for spheroid and 2D cultures, respectively (Figure 5B). The IC50 values were calculated for Carboplatin and Doxorubicin in 3D spheroids and 2D monolayer culture, respectively. For example, Doxorubicin was significantly more cytotoxic to spheroids than the monolayer cultures, with the IC50 values of 118.70±1.60 µM in 3D and 87.51±2.35 µM in 2D cultures.
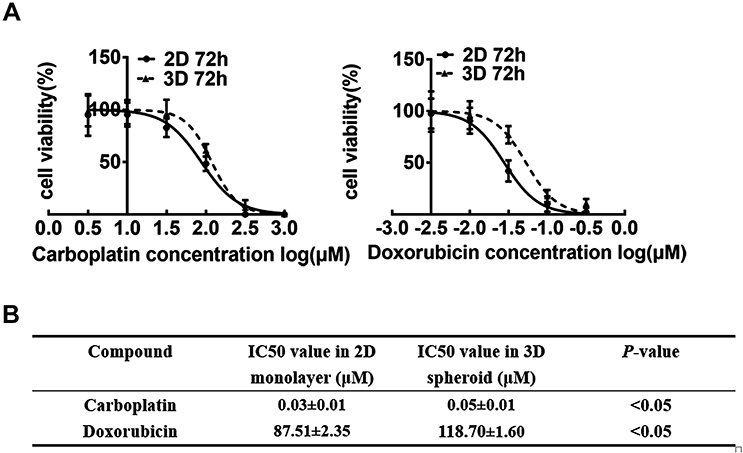 |
Figure 5 Drug-induced sensitivity of 2D and 3D cells. (A) Viability of 2D MDA-MB-231 (filled circle) and 3D MDA-MB-231 (filled triangle) cells after 72 h of compound exposure. The CellTiter-Glo® 3D Cell Viability Assay was performed to assess cytotoxicity. (B) Half-maximal inhibitory concentration (IC50) values of Carboplatin and Doxorubicin of MDA-MB-231 spheroids (3D) and monolayer culture (2D) after 72 h of drug exposure. Data are expressed as mean ± SD from three independent replicates. |
Discussion
For a number of cancers, more effective treatments are needed at present. However, it remains a great challenge to replicate the complex microenvironment in vitro so far. Although numerous drugs have exhibited encouraging results in vitro, most of them can not be transformed into the in vivo model system, and only about 5% of the newly approved anticancer drugs show antitumor activity in clinical trials.21–23 Compared with traditional 2D cultures, 3D cell culture models can better mimic the microenvironment in primary tumors. It has been well documented that, the 3D microenvironment alters numerous cellular and functional activities, including the differential zones of hypoxia, proliferation, viability, migration, differentiation (EMT), and drug sensitivity.24–28
When cultured in the 3D systems, MCF-7 cells form spheroids in vitro, up-regulate the expression of EMT markers both at gene and protein levels, and increase cell migration capacity. Additionally, MCF-7 spheroids show more realistic drug responses, and better evaluate tumor proliferation and morphological changes.15,29 Similar to these studies, MDA-MB-231 spheroids in this model also showed a variety of malignant tumor characteristics in vivo, such as hypoxia, reduced proliferation, superior EMT and elevated resistance to toxicological response. Hypoxia is a common phenomenon in malignant tumors and the rapidly developing tumors. Generally, the hypoxic environment caused by the insufficient blood supply to tumors is closely related to tumor physiological processes, including gene regulation, angiogenesis and signal transduction pathways.30,31 A spheroid can be divided into three zones, namely, the necrotic area in the interior, the quiescent area in the middle and the proliferating area in the exterior. Dead cells (quiescent and necrotic zones) can be resulted from the lack of nutrition and oxygen in the interior, whereas outer cell proliferation is carried out on the spheroid surface.15,32 Based on our HE staining and IHC results of the MDA-MB-231 spheroids, there were necrotic cavities due to hypoxia (Figures 1C and 2B). As demonstrated in previous literature reports, tumor spheroids have a slower growth rate than those cultured as a monolayer, with direct cell–cell contacts similar to the in vivo structure.33 For most types of cells, the possibilities of attachment and proliferation depend on their surrounding extracellular matrix (ECM), which is inherent with the seeded cell aggregate. Spheroid formation by MDA-MB-231 cells is attributed to the non-adherent culture conditions, high degree of confluence and nutrient/oxygen deprivation. MDA-MB-231 within spheroids have less access to oxygen and nutrients, and it is of interest to know whether more cells within the spheroid undergo apoptosis. In fact, most cells within aggregates are shown to be viable in some studies,34 consistent with our results (Figure 2).
It has been reported that, the hypoxic culture condition can enhance the metastatic capacity.35 Migration and invasion are the basic characteristics of cancer metastasis, and the cell migration capacities on 3D and 2D surfaces are distinct. It is shown in previous studies that, the migratory response of a cell population within a gradient of oxygen is correlated with its metastatic potential in vivo, which may be of certain significance for the angiogenesis-based therapies. This correlation is consistent with the existing literature, indicating that cancer cell invasion is mainly due to the metabolic needs of tumors. Our results showed that, MDA-MB-231 cells within the spheroids had even higher migration and invasion capabilities after transferring from spheroids to 2D culture (Figure 3A-C). It was mainly because that, a gradient of oxygen might be responsible for their migration and invasion in the MDA-MB-231 spheroids.
EMT represents one of the hallmark of the aggressive and metastatic phenotypes of TNBC cells. It refers to the process in which the cell phenotype transits from epithelial to mesenchymal state, including loss of cell polarity, down-regulation of E-cadherin expression, up-regulation of mesenchymal marker gene expression, and enhancement of invasive capacity.20,36 In line with these studies, we observed the loss of membranous E-cadherin and the gain of N-cadherin in spheroids compared with 2D culture, implying that the MDA-MB-231 cells acquired the aggressive malignant phenotype after spheroid formation (Figure 4). Besides, Cadherin is a class of intracellular adhesion proteins, which provide the recognition signals for cell sorting and aggregation during tissue development. Studies have shown that, spheroids formation involves the intact cell–cell contact, since the initial aggregation results in the up-regulated expression of cadherin.34,37,38 Thus, it seems that N-cadherin, rather than E-cadherin, contributes to the formation of MDA-MB-231 spheroids. Drug resistance is one of phenotypes of malignant tumor, and tumor cells can easily lose the drug resistance and function in traditional 2D culture.39 In the previously published studies, MCF-7 spheroids and MDA-MB-231 spheroids show enhanced drug resistance.29 Consistent with this, the IC50 values in 2D cultures after treatments with Carboplatin and Doxorubicin were lower than those in 3D cultures (Figure 5), suggesting that MDA-MB-231 cells were cultured as a spheroid-acquired drug resistant phenotype. Imamura et al previously investigated the utility of 3D-culture models in testing the activity of chemotherapeutic drugs.40 They discovered that three BC cell lines (BT-549, BT-474 and T-47D) performed better than the 2D-cultured cells in simulating the important tumor characteristics in vivo, including the hypoxia, dormancy and anti-apoptotic features, together with the resulting drug resistance. Interestingly, EMT also contributes to drug resistance in advanced tumors. It seems that the better drug resistance of MDA-MB-231 spheroid than the 2D-cultured cells is related to its EMT.
Spheroids resemble the avascular tumor nodules, micro-metastases, or the intervascular regions of large solid tumors, in terms of their morphological features, microenvironment, volume growth kinetics and gradients of nutrient distribution, oxygen concentration, cell proliferation and drug resistance. Some limitations should be noted in this study. The first one was that, no human primary tumor was used in our study. However, histological analysis revealed the tissue cell morphology within the spheroids, with direct cell–cell contacts similar to the in vivo tumor structure, which was different from that in 2D BC cell models where cells had altered cell morphology, including an elongated and flattened structure, with cell contacts in one plane only, therefore limiting cell signaling. Additionally, our spheroids recapitulated the zonation of primary original tumor that occurred in vivo due to the oxygen and nutrient gradients. Moreover, results of HE and IHC staining also confirmed the above finding, indicating the similarity compared with human BC. Migration, EMT and drug resistance are the hallmarks of aggressive and metastatic phenotypes of in vivo TNBC. This study confirmed that, spheroid had superior EMT and high resistance to toxicological response, which were similar to the TNBC characteristics.
In summary, MDA-MB-231 spheroids in the culture system described in this study were closely resembled in vivo with respect to their characteristics, such as structure and hypoxia. Moreover, our results demonstrated that, spheroids had the potential to enhance metastasis. Toxicological analysis of antitumor compounds indicated that, our spheroid model was able to predict the higher drug resistance than 2D monolayer cultures.
Conclusions
This study adapts a simple technique to create the MDA-MB-231 spheroids and demonstrates their structure, growth and proliferation characteristics over days. According to our findings, MDA-MB-231 cells dissociated from spheroids exhibit enhanced migration and invasion capacities. Moreover, we additionally confirm that, the spheroids have acquired the aggressive malignant phenotype. Compared with 2D monolayer cultures, spheroid are more resistant to drug therapies. Taken together, the MDA-MB-231 spheroid models can serve as the promising preclinical models to explore the mechanisms of BC progression and to screen the antitumor drugs.
Abbreviations
3D, three-dimensional; 2D, two-dimensional; TNBC, triple-negative breast cancer; EMT, epithelial-to-mesenchymal transition; IC50, half maximal inhibitory concentration.
Acknowledgments
The authors thank Jiawei Hu for his technological help in the study. This work was supported by the Key Project of Xianning Central Hospptial Scientific Research [grant/award number 2018XYA010].
Disclosure
The authors report no conflicts of interest in this work.
References
1. Anastasiadi Z, Lianos GD, Ignatiadou E, et al. Breast cancer in young women: an overview. Updates Surg. 2017;69(3):313–317. doi:10.1007/s13304-017-0424-1
2. DeSantis CE, Ma J, Goding Sauer A, et al. Breast cancer statistics, 2017, racial disparity in mortality by state. CA Cancer J Clin. 2017;67(6):439–448. doi:10.3322/caac.21412
3. Menezes ME, Das SK, Emdad L, et al. Genetically engineered mice as experimental tools to dissect the critical events in breast cancer. Adv Cancer Res. 2014;121:331–382. doi:10.1016/b978-0-12-800249-0.00008-1
4. Du L, Li X, Zhen L, et al. Everolimus inhibits breast cancer cell growth through PI3K/AKT/mTOR signaling pathway. Mol Med Rep. 2018;17(5):7163–7169. doi:10.3892/mmr.2018.8769
5. Chiew GGY, Wei N, Sultania S, et al. Bioengineered three-dimensional co-culture of cancer cells and endothelial cells: a model system for dual analysis of tumor growth and angiogenesis. Biotechnol Bioeng. 2017;114(8):1865–1877. doi:10.1002/bit.26297
6. Lazzari G, Nicolas V, Matsusaki M, et al. Multicellular spheroid based on a triple co-culture: a novel 3D model to mimic pancreatic tumor complexity. Acta Biomater. 2018;78:296–307. doi:10.1016/j.actbio.2018.08.008
7. Nath S, Devi GR. Three-dimensional culture systems in cancer research: focus on tumor spheroid model. Pharmacol Ther. 2016;163:94–108. doi:10.1016/j.pharmthera.2016.03.013
8. Valcárcel M, Arteta B, Jaureguibeitia A, et al. Three-dimensional growth as multicellular spheroid activates the proangiogenic phenotype of colorectal carcinoma cells via LFA-1-dependent VEGF: implications on hepatic micrometastasis. J Transl Med. 2008;6:57. doi:10.1186/1479-5876-6-57
9. Wan X, Li Z, Ye H, et al. Three-dimensional perfused tumour spheroid model for anti-cancer drug screening. Biotechnol Lett. 2016;38(8):1389–1395. doi:10.1007/s10529-016-2035-1
10. Balsa LM, Ruiz MC, Santa Maria de la Parra L, et al. Anticancer and antimetastatic activity of copper(II)-tropolone complex against human breast cancer cells, breast multicellular spheroids and mammospheres. J Inorg Biochem. 2019;204:110975. doi:10.1016/j.jinorgbio.2019.110975
11. Froehlich K, Haeger J-D, Heger J, et al. Generation of multicellular breast cancer tumor spheroids: comparison of different protocols. J Mammary Gland Biol Neoplasia. 2016;21(3–4):89–98. doi:10.1007/s10911-016-9359-2
12. Nagelkerke A, Bussink J, Sweep FCGJ, et al. Generation of multicellular tumor spheroids of breast cancer cells: how to go three-dimensional. Anal Biochem. 2013;437(1):17–19. doi:10.1016/j.ab.2013.02.004
13. Nunes AS, Costa EC, Barros AS, et al. Establishment of 2D cell cultures derived from 3D MCF-7 spheroids displaying a doxorubicin resistant profile. Biotechnol J. 2019;14(4):e1800268–e1800268. doi:10.1002/biot.201800268
14. Rodríguez CE, Berardi DE, Abrigo M, et al. Breast cancer stem cells are involved in Trastuzumab resistance through the HER2 modulation in 3D culture. J Cell Biochem. 2018;119(2):1381–1391. doi:10.1002/jcb.26298
15. Brancato V, Gioiella F, Imparato G, et al. 3D breast cancer microtissue reveals the role of tumor microenvironment on the transport and efficacy of free-doxorubicin in vitro. Acta Biomater. 2018;75:200–212. doi:10.1016/j.actbio.2018.05.055
16. Kalluri R, Weinberg RA. The basics of epithelial-mesenchymal transition. J Clin Invest. 2009;119(6):1420–1428. doi:10.1172/JCI39104
17. Masso-Welch P, Girald Berlingeri S, King-Lyons ND, et al. LT-IIc, a bacterial Type II heat-labile enterotoxin, induces specific lethality in triple negative breast cancer cells by modulation of autophagy and induction of apoptosis and necroptosis. Int J Mol Sci. 2018;20(1):85. doi:10.3390/ijms20010085
18. Dahlmann J, Kensah G, Kempf H, et al. The use of agarose microwells for scalable embryoid body formation and cardiac differentiation of human and murine pluripotent stem cells. Biomaterials. 2013;34(10):2463–2471. doi:10.1016/j.biomaterials.2012.12.024
19. Saitoh M. Involvement of partial EMT in cancer progression. J Biochem. 2018;164(4):257–264. doi:10.1093/jb/mvy047
20. Pastushenko I, Blanpain C. EMT transition states during tumor progression and metastasis. Trends Cell Biol. 2019;29(3):212–226. doi:10.1016/j.tcb.2018.12.001
21. Ocana A, Pandiella A, Siu LL, et al. Preclinical development of molecular-targeted agents for cancer. Nat Rev Clin Oncol. 2010;8(4):200–209. doi:10.1038/nrclinonc.2010.194
22. Hait WN. Anticancer drug development: the grand challenges. Nat Rev Drug Discov. 2010;9(4):253–254. doi:10.1038/nrd3144
23. Hutchinson L, Kirk R. High drug attrition rates–where are we going wrong? Nat Rev Clin Oncol. 2011;8(4):189–190. doi:10.1038/nrclinonc.2011.34
24. Wang C, Tang Z, Zhao Y, et al. Three-dimensional in vitro cancer models: a short review. Biofabrication. 2014;6(2):022001. doi:10.1088/1758-5082/6/2/022001
25. Wenzel C, Riefke B, Gründemann S, et al. 3D high-content screening for the identification of compounds that target cells in dormant tumor spheroid regions. Exp Cell Res. 2014;323(1):131–143. doi:10.1016/j.yexcr.2014.01.017
26. Singh M, Close DA, Mukundan S, et al. Production of uniform 3D microtumors in hydrogel microwell arrays for measurement of viability, morphology, and signaling pathway activation. Assay Drug Dev Technol. 2015;13(9):570–583. doi:10.1089/adt.2015.662
27. Friedrich J, Seidel C, Ebner R, et al. Spheroid-based drug screen: considerations and practical approach. Nat Protoc. 2009;4(3):309–324. doi:10.1038/nprot.2008.226
28. Lovitt CJ, Shelper TB, Avery VM. Miniaturized three-dimensional cancer model for drug evaluation. Assay Drug Dev Technol. 2013;11(7):435–448. doi:10.1089/adt.2012.483
29. Boo L, Ho WY, Mohd Ali N, et al. Phenotypic and microRNA transcriptomic profiling of the MDA-MB-231 spheroid-enriched CSCs with comparison of MCF-7 microRNA profiling dataset. PeerJ. 2017;5:e3551–e3551. doi:10.7717/peerj.3551
30. Pugh CW, Ratcliffe PJ. New horizons in hypoxia signaling pathways. Exp Cell Res. 2017;356(2):116–121. doi:10.1016/j.yexcr.2017.03.008
31. Manoochehri Khoshinani H, Afshar S, Najafi R. Hypoxia: a double-edged sword in cancer therapy. Cancer Invest. 2016;34(10):536–545. doi:10.1080/07357907.2016.1245317
32. Han M, Oba M, Nishiyama N, et al. Enhanced percolation and gene expression in tumor hypoxia by PEGylated polyplex micelles. Mol Ther. 2009;17(8):1404–1410. doi:10.1038/mt.2009.119
33. Szade K, Zukowska M, Szade A, et al. Spheroid-plug model as a tool to study tumor development, angiogenesis, and heterogeneity in vivo. Tumour Biol. 2016;37(2):2481–2496. doi:10.1007/s13277-015-4065-z
34. Santini MT, Rainaldi G, Indovina PL. Apoptosis, cell adhesion and the extracellular matrix in the three-dimensional growth of multicellular tumor spheroids. Crit Rev Oncol Hematol. 2000;36(2–3):75–87. doi:10.1016/s1040-8428(00)00078-0
35. Nobre AR, Entenberg D, Wang Y, et al. The different routes to metastasis via hypoxia-regulated programs. Trends Cell Biol. 2018;28(11):941–956. doi:10.1016/j.tcb.2018.06.008
36. Sannino G, Marchetto A, Kirchner T, et al. Epithelial-to-mesenchymal and mesenchymal-to-epithelial transition in mesenchymal tumors: a paradox in sarcomas? Cancer Res. 2017;77(17):4556–4561. doi:10.1158/0008-5472.CAN-17-0032
37. Takebe N, Warren RQ, Ivy SP. Breast cancer growth and metastasis: interplay between cancer stem cells, embryonic signaling pathways and epithelial-to-mesenchymal transition. Breast Cancer Res. 2011;13(3):211. doi:10.1186/bcr2876
38. Cui X, Hartanto Y, Zhang H. Advances in multicellular spheroids formation. J R Soc Interface. 2017;14(127). doi:10.1098/rsif.2016.0877
39. Du B, Shim JS. Targeting Epithelial-Mesenchymal Transition (EMT) to overcome drug resistance in cancer. Molecules. 2016;21(7):965. doi:10.3390/molecules21070965
40. Imamura Y, Mukohara T, Shimono Y, et al. Comparison of 2D- and 3D-culture models as drug-testing platforms in breast cancer. Oncol Rep. 2015;33(4):1837–1843. doi:10.3892/or.2015.3767
 © 2020 The Author(s). This work is published and licensed by Dove Medical Press Limited. The
full terms of this license are available at https://www.dovepress.com/terms
and incorporate the Creative Commons Attribution
- Non Commercial (unported, 3.0) License.
By accessing the work you hereby accept the Terms. Non-commercial uses of the work are permitted
without any further permission from Dove Medical Press Limited, provided the work is properly
attributed. For permission for commercial use of this work, please see paragraphs 4.2 and 5 of our Terms.
© 2020 The Author(s). This work is published and licensed by Dove Medical Press Limited. The
full terms of this license are available at https://www.dovepress.com/terms
and incorporate the Creative Commons Attribution
- Non Commercial (unported, 3.0) License.
By accessing the work you hereby accept the Terms. Non-commercial uses of the work are permitted
without any further permission from Dove Medical Press Limited, provided the work is properly
attributed. For permission for commercial use of this work, please see paragraphs 4.2 and 5 of our Terms.