Back to Journals » Journal of Pain Research » Volume 10
Characterization of cortical source generators based on electroencephalography during tonic pain
Authors Hansen TM, Mark EB, Olesen SS, Gram M, Frøkjær JB ![]() , Drewes AM
, Drewes AM
Received 21 January 2017
Accepted for publication 7 April 2017
Published 7 June 2017 Volume 2017:10 Pages 1401—1409
DOI https://doi.org/10.2147/JPR.S132909
Checked for plagiarism Yes
Review by Single anonymous peer review
Peer reviewer comments 4
Editor who approved publication: Professor E Alfonso Romero-Sandoval
Tine Maria Hansen,1,2 Esben Bolvig Mark,1,3 Søren Schou Olesen,2,3 Mikkel Gram,3 Jens Brøndum Frøkjær,1,2 Asbjørn Mohr Drewes2,3
1Mech-Sense, Department of Radiology, Aalborg University Hospital, 2Department of Clinical Medicine, Aalborg University, 3Mech-Sense, Department of Gastroenterology and Hepatology, Aalborg University Hospital, Aalborg, Denmark
Objective: The aim of the present study was to characterize the cortical source generators evoked by experimental tonic pain.
Methods: Electroencephalography (EEG) was recorded on two separate days during rest and with immersion of the hand in ice water for 2 minutes (cold pressor test). Exact low-resolution brain electromagnetic tomography source localization was performed in 31 healthy volunteers to characterize the cortical source generators.
Results: Reliability was high in all eight frequency bands during rest and cold pressor conditions (intraclass coefficients =0.47–0.83 in the cingulate and insula). Tonic pain increased cortical activities in the delta (1–4 Hz), theta (4–8 Hz), beta1 (12–18 Hz), beta2 (18–24 Hz), beta3 (24–32 Hz), and gamma (32–60 Hz) bands (all P<0.011) in widespread areas mainly in the limbic system, whereas decreased cortical activities were found in cingulate and pre- and postcentral gyri in the alpha2 (10–12 Hz) band (P=0.007). The pain intensity was correlated with cingulate activity in the beta2, beta3, and gamma bands (all P<0.04).
Conclusion: Source localization of EEG is a reliable method to estimate cortical source generators. Activities in different brain regions, mainly in the limbic system, showed fluctuations in various frequency bands. Cingulate changes were correlated with pain intensity.
Significance: This method might add information to the objective assessment of the cortical pain response in future experimental pain studies.
Keywords: EEG, tonic pain, source localization, cingulate cortex, eLORETA
Introduction
In order to identify the underlying mechanisms of human pain, the identification of the neuronal activity is mandatory. This requires robust and reliable experimental models to mimic clinical pain as well as valid methods to assess the pain response. It has been demonstrated that tonic pain models reflect clinical pain to a higher degree, and they are more sensitive to analgesic treatments.1–6 The cold pressor test (immersion of hand in ice water) can be used to evoke tonic pain with reproducible pain ratings.7,8 Several techniques have been used for objective assessment of the evoked brain response. These techniques include electroencephalography (EEG) and magnetic resonance imaging (MRI), which have different advantages and disadvantages and reveal supplementary information about the pain response. EEG spectral analysis with frequency band analysis of the tonic pain–evoked EEG response has been proven to be reliable,8 but spatial information about activated cortical areas was not assessed. Inverse modeling of the EEG can provide information about the underlying source generators and is a feasible and low-cost method. Furthermore, it is possible to extract information related to the frequency band content using source localization methods such as exact low-resolution brain electromagnetic tomography (eLORETA).9
The present study hypothesized that underlying cortical source generators evoked by tonic pain during a cold pressor test can be identified by using eLORETA analysis of the EEG. Thus, the following were the aims of this study: 1) to investigate the reliability of the eLORETA source localization in different frequency bands during rest and cold pressor pain, 2) to characterize changes in the EEG frequency bands in different brain regions during cold pressor pain, and 3) to explore the association between cortical source generators and the pain intensity.
Methods
The study was carried out at Mech-Sense, Department of Gastroenterology, Aalborg University Hospital, Denmark, from November 2010 to April 2012, and this was a substudy of a larger study, which was approved by the North Denmark Region Committee on Health Research Ethics (reference number: N-20100046) and the Danish Medicines Agency (reference number: 2612–4319) and registered at ClinicalTrials.gov (NCT01245244, EUDRACT number: 2010-020894-17). Other data from the study were reported previously.6,8,10–16
In total, 39 subjects were included in this study. Informed consent was obtained from all the subjects. Inclusion criteria were the following: aged between 20 and 65 years and had no previous pain-related diseases or psychiatric disorders, and the subjects were barred from using strong analgesics during the entire study. The use of over-the-counter analgesics was not allowed 24 hours prior to the experimental sessions. A routine health examination was conducted by a medical doctor before enrolment into the study. All the subjects were compensated for participation.
Experimental protocol
Two identical experimental sessions were conducted for each subject with a gap of at least 1 week. An EEG was recorded during resting state and cold pressor test for each experimental session. Prior to the first session, a training session was conducted in order to familiarize the subjects to the laboratory environment. The two experimental sessions were carried out at the same time of the day and by the same well-trained experimenters in a quiet room. Female subjects were tested in the same phase of their individual menstrual cycle in order to control for variations in hormone levels.
Cold pressor test
The cold pressor test was performed by using a circulated water bath at a temperature of 2°C (Grant, Fischer Scientific, Slangerup, Denmark). The subjects immersed their left hand to the wrist for 2 minutes in the cold water and rated the sensory perception on a handheld electronic device with a visual analogue scale (VAS). The subjects used a button to slide on the scale on the handheld device. The sensory ratings were continuously sampled electronically at a frequency of 10 Hz on a scale from 0 to 10, where 5= the pain detection threshold.17 The area under the VAS curve was used as an expression of the pain intensity for the entire pain stimulus.
EEG recordings
During each session, a resting-state EEG was recorded with open eyes in a dimly lit room for 2.5 minutes and followed by an EEG recording during the cold pressor test (in which the subject immersed the hand in cold water). A standard 62-channel cap (Quick-Cap International, Compumedics® Neuroscan™, El Paso, TX, USA) mounted according to the extended 10–20 system was used for recording, and the EEG signal was amplified digitally on a SynAmps 2 system.
EEG data were preprocessed offline by using Neuroscan 4.3.1 (Compumedics) in the following steps: 1) zero-phase shift notch filtering (49–51 Hz, 24 dB/octave); 2) zero-phase shift band-pass filtering (1–70 Hz, 12 dB/octave); 3) electrodes displaying abnormal signals with respect to signal level were replaced by signals interpolated from neighboring electrodes; 4) re-referencing to the average electrode; and 5) finally, 2 minutes of artifact-free (eyeblinks were allowed) EEG was selected from the resting-state EEG recording. The EEG recordings during the cold pressor test were 2 minutes long, and the entire signal was kept. Additional four steps of EEG signal preprocessing were performed offline using MATLAB (MathWorks Inc., Natick, MA, USA) Version R2015b; 6) the first 15 seconds of the cold pressor EEG recordings were discarded due to muscle contractions caused by the immediate pain after immersing the hand in cold water,8 resulting in a total of 105 seconds of EEG; 7) the EEG data length was further reduced to 102 seconds to ensure the same signal length for all the subjects; 8) the EEG signals were downsampled to 250 Hz to decrease memory requirement in the source localization; and 9) the source localization analysis requires at least 2 seconds of continuous EEG recordings in each epoch, and the EEG signals were divided into 51 epochs of 2 seconds corresponding to 500 samples per epoch.
Source localization
The eLORETA was used to analyze the cortical distribution of current source density (http://www.uzh.ch/keyinst/loreta). The eLORETA method is an inverse modeling method, and the result is a three-dimensional distribution of electric cortical activity at any location in the brain with no error under optimal noise-free conditions.9 The head model and electrode coordinates used in the eLORETA are based on the Montreal Neurological Institute average MRI brain map (MNI152).18 The eLORETA solution space is limited to include the cortical gray matter, which is divided into 6,239 voxels of a 5-mm cubic spatial resolution. The eLORETA analysis was performed on a group level in eight frequency bands: delta (1–4 Hz), theta (4–8 Hz), alpha1 (8–10 Hz), alpha2 (10–12 Hz), beta1 (12–18 Hz), beta2 (18–24 Hz), beta3 (24–32 Hz), and gamma (32–60 Hz).
Statistics
- EEG source localizations of global cortical activity (whole brain analysis) were evaluated by comparing the eLORETA analysis for the same conditions between the two different sessions (Rest Session 1 versus Rest Session 2 and Cold Pressor Session 1 versus Cold Pressor Session 2). Furthermore, the data were extracted from the eLORETA analysis for each subject in distinct cortical areas including the anterior cingulate cortex (Brodmann area [BA] 24, 32, and 33) and the posterior insula (BA 13), which are frequently activated during pain processing.19 Then, these two areas were selected for reproducibility and correlation analysis. Reproducibility was determined by a three-step procedure: first, paired t-tests were used to assess significant differences in intrasubject between-session variance. Second, intersubject and intrasubject reliabilities were analyzed by using the intraclass correlation coefficient (ICC). The parameter ranges from 0 to 1, with values closest to 1 indicating the highest reproducibility. An ICC <0.4 was considered poor agreement; 0.4–0.59, fair agreement; 0.6–0.75, good agreement; and >0.75, excellent agreement.20 Finally, limits of agreement (LoAs) between sessions were calculated as proposed by Bland and Altman.21
- EEG source localizations of global cortical activity (whole brain analysis) were employed for all the subjects between different conditions (rest versus cold pressor) for each EEG frequency band.
- Pearson’s correlation coefficient was used to explore the association between the pain intensity (area under the VAS curve) and evoked brain activation during the cold pressor test in the different frequency bands in the anterior cingulate cortex and the posterior insula cortex.
The comparisons of global cortical activities were made by using the statistical module included in the eLORETA software. The cortical activities under the different conditions were compared by using a two-tailed t-test with paired groups, and no normalization methods were applied. A statistical significance threshold of P<0.05 was chosen. The statistical nonparametric mapping randomization method was used to automatically adjust for multiple comparisons with a Fisher’s random permutation test with 5,000 randomizations.22 The reproducibility steps and the correlations were calculated by using STATA Version 14.2 (StataCorp LP, College Station, TX, USA). All data were presented as means ± standard deviation unless otherwise indicated.
Results
In total, 39 subjects were included in this study (18 women and 21 men; average age: 26.9±6.5 years). Five subjects were excluded as they did not tolerate the cold pressor test for 2 minutes, and three subjects were excluded due to poor data quality of the EEG. Thus, data from 31 subjects were included in the analysis. Spectral analyses of the data and the pain intensity (area under the VAS curve) have been presented by Gram et al and good data quality and reproducibility were demonstrated.8
Reproducibility of resting-state and cold pressor EEG source activities
The eLORETA analysis revealed no significant differences in global cortical activities between Sessions 1 and 2 during resting-state EEG (P>0.7 for all frequency bands) and between Sessions 1 and 2 during cold pressor EEG (P>0.2 for all frequency bands). In agreement with this, the reproducibility of cingulate activity (ICC =0.59–0.80) and insular activity (ICC =0.58–0.83) for the resting state conditions were good, and the corresponding LoAs were narrow (Table 1). During the cold pressor test, the reproducibility was slightly lower compared to the resting state condition. However, a fair to good agreement between sessions was observed for most frequency bands; cingulate cortex (ICC =0.63–0.70), insula cortex (ICC =0.47–0.66), and again the corresponding LoAs were narrow (Table 1).
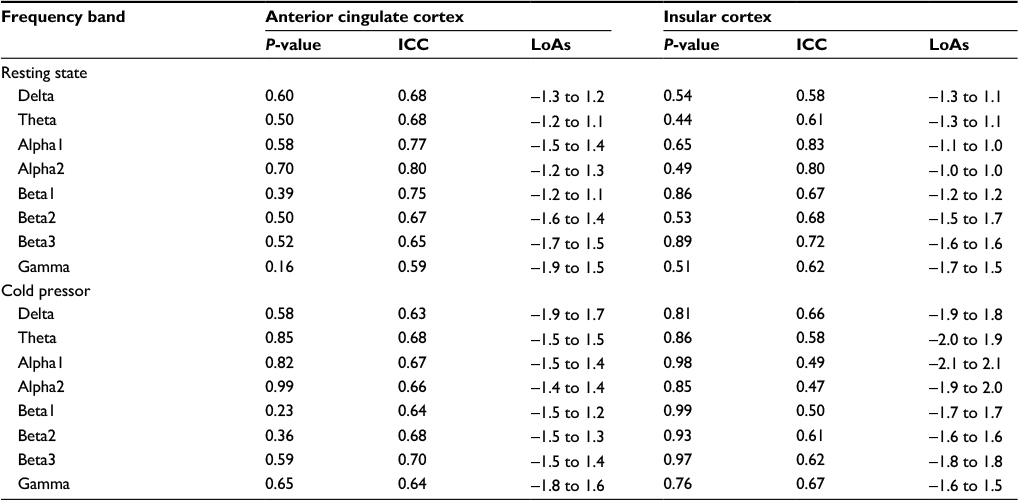 | Table 1 Between-session reproducibility of cortical activities in two regions of interests (the anterior cingulate cortex and the insular cortex) Note: P-values from paired t-tests. Abbreviations: ICC, intraclass correlation coefficient; LoAs, limits of agreement. |
EEG source activity during cold pressor pain
As there were no significant differences in cortical activities between sessions, only results from one study session (Session 2) are presented. Compared to resting-state EEG, the cold pressor pain induced increased global cortical activities in the delta (P=0.002), theta (P=0.011), beta1 (P=0.0004), beta2 (P=0.0008), beta3 (P=0.002), and gamma (P=0.0004) bands, and decreased cortical activities were found in the alpha2 band (P=0.007). No change was observed in the alpha1 band (P=0.06). The increased delta activities were confined to the cingulate, frontal, temporal, insula, and parahippocampal regions, whereas increased theta activities were observed in the cingulate, frontal, and temporal regions. Decreased activities were found in the cingulate and pre- and postcentral gyral regions in the alpha2 band. Cortical activities in the beta1, beta2, beta3, and gamma bands revealed more widespread changes (Figure 1 and Table 2).
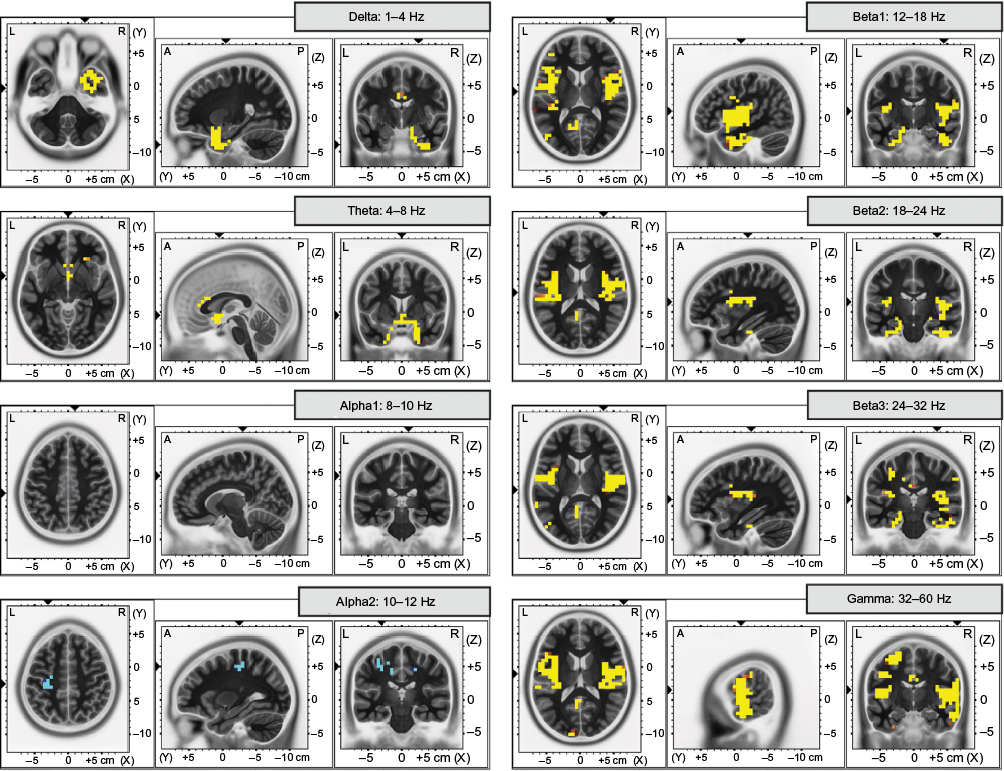 | Figure 1 Cortical source activities evoked by cold pressor pain for the eight frequency bands. Notes: Yellow and orange colors represent cortical areas with increased activity, whereas blue color represents cortical areas with decreased activity. Voxels colored orange and dark blue indicate areas with t-values closest to the threshold value, that is, the least significant findings. |
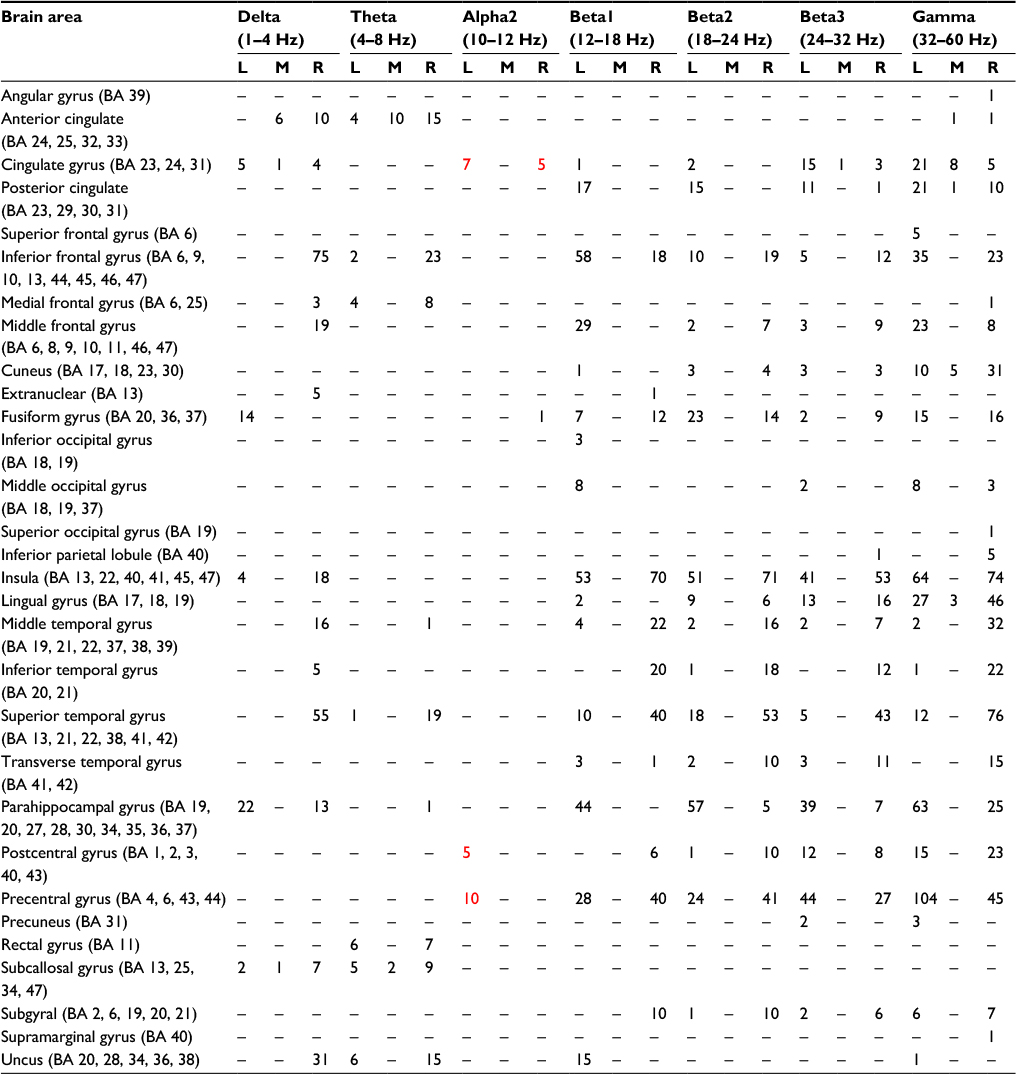 | Table 2 Overview of cortical activities evoked by the cold pressor test in different frequency bands Notes: The numbers of voxels that are significantly increased (indicated with black numbers) or decreased (indicated with red numbers) are reported in the activated brain areas for the different frequency bands. ; “–” indicates no significant changes. Abbreviations: BA, Brodmann area (can be included in more than one brain area); L, left; M, middle; R, right. |
Correlations between pain intensity and local brain activation
Finally, the present study explored the association between pain intensity (area under the VAS curve) of the cold pressor test and activities of the cingulate and insular cortex. Only frequency bands that showed significant changes in these areas were used for correlation. Correlations between pain intensity and the beta2 (r=0.40, P=0.03), beta3 (r=0.36, P=0.04), and gamma (r=−0.38, P=0.03) bands were observed in the cingulate cortex. No correlations were found between the pain intensity and the insular activation.
Discussion
The present study used source localization of the EEG during rest and tonic pain in healthy volunteers to investigate brain activation. Test–retest reliability was found to be high under both conditions in two predefined areas (the anterior cingulate and posterior insular cortex). During the cold pressor test, increased cortical activities were found in the low- and high-frequency bands in widespread areas including cingulate, frontal, temporal, insula, parahippocampal, pre- and postcentral gyral, occipital, and parietal regions, whereas decreased cortical activities were found in the mid-frequency band (alpha2) in cingulate and pre- and postcentral gyral regions. Correlations between pain intensity and cingulate cortical activities in the high-frequency bands (namely beta2, beta3, and gamma) were evident, indicating that the method can be used to explore pain mechanisms in future experimental studies.
EEG source activity during cold pressor pain
The effect of tonic cold pain on brain activity in healthy subjects has previously been evaluated by using functional MRI (fMRI) and spectral analysis of the EEG. Cold pressor–induced changes in brain activity using fMRI have shown increased activities in anterior cingulate cortex, insula, and other major pain-related areas.23,24 Gram et al also performed EEG spectral analysis following the cold pressor test. Most of the subjects of this study were also included in the current study.8 Gram et al found the absolute spectral indices to be increased in low- and high-frequency bands and to be decreased in the mid-frequency bands, which is consistent with the eLORETA findings of the present study. This is also in agreement with other studies based on EEG spectral analysis, which consistently found that tonic pain was associated with increased low- and high-frequency oscillations.25–30 Using the absolute EEG power spectra, Chang et al demonstrated that increased low-frequency activity was pronounced in the frontal regions, and the increased high-frequency activity was pronounced in the bilateral frontotemporal regions. Decreased activity in the mid-frequency bands was found in the posterior, parietal, and occipital regions.26 In contrast to this present study, increased activity in the alpha bands has also been observed during tonic pain.25,28 However, the test conditions had different attention levels, and the attention can affect the alpha band power.28 In addition to the spectral analysis of the EEG, source localization can provide information about source generators. Previous studies have also used source localization techniques to characterize the generators during experimental tonic pain. Accordingly, Shao et al performed a standardized low-resolution brain electromagnetic tomography analysis of a tonic cold pain condition (with the hand immersed into ~10°C cold water compared with a no-pain control condition of 10 minutes each) and found decreased cortical activities in pain-related areas in the alpha band and increased cortical activities in higher frequency bands.30 With shorter stimulus duration (2 minutes) and colder stimulus temperature (2°C), the present study demonstrated similar findings of decreased activities in cingulate and pre- and postcentral gyral regions in the alpha2 band and increased activities in cingulate, frontal, temporal, occipital, parietal, insula, parahippocampal, and pre- and postcentral regions in the high-frequency bands. Increased oscillatory activity in a group of neurons can be explained by synchronization of their firing pattern. The cortical activities evoked by the cold pressor test may be a result of both pain-related activation and other differences in the EEG activities, such as different attention levels, the motor response, activation of tactile receptors in the hand, cognitive processes, and noise, during the cold pressor test and the resting state condition; for example, muscle artifacts are more pronounced in the high-frequency bands.28 This may result in more widespread and unspecific activation. The parallel design where the subjects are individually compared during both rest and cold pressor conditions to some degree counteracts these confounders, but they still have to be considered. Enhanced low-frequency-band activity during tonic pain has been suggested to be related to cortical inhibition of the incoming information from afferent neurons and to be related to the motivational regulation of the frontal regions.25–27 The decreased mid-frequency activation has been suggested to be related to increased cellular excitability in the thalamocortical system, and reduced mid-frequency may be relevant to the attention of the pain.26
Regions such as the cingulate and insular cortex are frequently reported to be involved in pain processing. Studies have shown that these areas are not unique for nociception but also present a reflection of non-nociceptive-specific cognitive processes elicited by nociceptive stimulation.31,32 However, these areas were selected as most previous studies have shown a consistent activation during different pain stimuli and across various imaging and electrophysiological modalities.11,16,33,34 This validates the method used in the present study. Furthermore, a previous study using a comparable methodology showed that remifentanil, a strong opioid that attenuated experimental pain, also changes brain activities in regions normally related to nociceptive and cognitive processing.35
Studies on spectral analysis have previously shown high-frequency oscillations to be correlated to the pain perception.8,31,36 However, the underlying source generators were not investigated using the spectral analysis. Tiemann et al demonstrated that the attentional effects of pain are related to gamma band oscillations.37 The design of the present study did not allow differentiating between intensity and attention, but as stated above the cingulate cortex is important in pain activation, and the present results support that this structure is an important contributor in different aspects related to perception of pain.
Methodological considerations
The spectral analysis of the EEG recorded during cold pressor test has previously been shown to be a reproducible and valid method for the assessment of brain activity during experimental tonic pain.8 The present study showed that in addition to conventional spectral analysis, eLORETA source localization of the EEG during resting state and experimental tonic pain (cold pressor test) also was reproducible in areas typically activated during pain. However, the reproducibility was slightly lower for the cold pressor EEG than for the resting-state EEG. This may be explained by the cold pressor test being painful, and it was more difficult for the subjects to minimize eyeblinks and muscle and cable movements, which may contaminate the EEG and introduce between-session variability. Furthermore, different confounders can affect cortical activity, especially during the cold pressor test, and other pain tests can be investigated in future studies to confirm the pain-related activity using eLORETA.
The fact that the cold pressor EEG recording contained more noise than the resting EEG may also be reflected in the EEG source activities. Manually performed noise and artifact rejections are often highly subjective, interobserver-dependent, and time consuming. Automatic artifact rejection was performed in some studies using a rejection threshold based upon the corresponding standard deviation of the EEG signal.35 This can, however, lead to the rejection of signals otherwise regarded physiologic. The current study included 102 seconds of EEG signal per exam; hence, the included eyeblink artifacts represented only a fraction of the included data and were likely not of importance. Furthermore, eyeblink artifacts would increase activity in the delta band around the frontal cortical regions.38 The eLORETA source analysis could also be affected by eyes movements and muscle artifacts from head and neck muscles during tonic pain. However, although the frequency ranges of delta and theta (for eyeblinks) and gamma (for muscle artifacts) somewhat overlap, differences were also found for the three beta bands and the alpha band. In addition, the direction of change (increase/decrease) for all frequency bands matches with the previous findings. It is difficult to discern between simple correlation and causation based on the data presented in the present study, and further studies are required to validate the results further.
Bias from the features of the subjects (eg, age, gender, pain levels, mental state, and anxiety) was minimized as the average age and distribution between women and men were very homogeneous (26.9±6.5 years; 18 women and 21 men, respectively); all the subjects were screened by a medical doctor before enrolment to rule out any history of previous pain causing diseases or psychiatric disorders, went through a training session prior to the first experimental session in order to familiarize the subject to the laboratory environment and to reduce anxiety, and filled out a pain catastrophizing questionnaire prior to the experimental sessions.10 Furthermore, the subjects were in their own control as the EEG recordings during resting state and cold pressor testing were compared. Thus, the presented results may be a representative for a similar population, but maybe not for a healthy population in general.
Conclusion
The eLORETA source localization analysis of EEG during a tonic pain cold pressor test provided a reliable and reproducible estimate of brain activity, which provides information on pain-related brain activation in distinct frequency bands. Increased cortical activities were present in widespread brain regions including pain-related areas such as the anterior cingulate cortex and insular cortex in the low- and high-frequency bands, whereas decreased brain activities were present in the cingulate and pre- and postcentral gyral regions in the mid-frequency band. Furthermore, the pain intensity was correlated with the cortical activity in the high-frequency bands for the anterior cingulate cortex. As pain is a highly subjective experience, it cannot easily be reduced to a unidimensional variable, but it is conceivable that information from different methods could be considered in a clinical application as they provide complementary information. Source localization of EEG during tonic pain might be useful to add information to objectively assess the cortical response in future studies on health and disease.
Acknowledgment
This work was supported by the Innovation Fund Denmark – Individuals, Disease and Society (#10-092786/DSF) and the Obel Family Foundation.
Authors’ contribution
TMH was involved in conception and design of the study; acquisition of data; analysis and interpretation of data; drafting the article; and revising it critically for important intellectual content and final approval of the version to be published. EBM, SSO, and MG were involved in the analysis and interpretation of data and revised them critically for important intellectual content and final approval of the version to be published. JBF and AMD were involved in conception and design of the study; analysis and interpretation of data; and revising them critically for important intellectual content and final approval of the version to be published. All the authors discussed the results and commented on the manuscript.
Disclosure
The authors report no conflicts of interest in this work.
References
Staahl C, Olesen AE, Andresen T, Arendt-Nielsen L, Drewes AM. Assessing analgesic actions of opioids by experimental pain models in healthy volunteers – an updated review. Br J Clin Pharmacol. 2009;68(2):149–168. | ||
Rainville P, Feine JS, Buchnell MC, Duncan GH. A psychophysical comparison of sensory and affective responses to four modalities of experimental pain. Somatosens Mot Res. 1992;9(4):265–277. | ||
Olesen AE, Andresen T, Staahl C, Drewes AM. Human experimental pain models for assessing the therapeutic efficacy of analgesic drugs. Pharmacol Rev. 2012;64(3):722–779. | ||
Nir RR, Sinai A, Raz E, Sprecher E, Yarnitsky D. Pain assessment by continuous EEG: association between subjective perception of tonic pain and peak frequency of alpha oscillations during stimulation and at rest. Brain Res. 2010;1344:77–86. | ||
Nir RR, Sinai A, Moont R, Harari E, Yarnitsky D. Tonic pain and continuous EEG: prediction of subjective pain perception by alpha-1 power during stimulation and at rest. Clin Neurophysiol. 2012;123(3):605–612. | ||
Olesen AE, Brock C, Sverrisdóttir E, Larsen IM, Drewes AM. Sensitivity of quantitative sensory models to morphine analgesia in humans. J Pain Res. 2014;7:717–726. | ||
Lewis GN, Heales L, Rice DA, Rome K, McNair PJ. Reliability of the conditioned pain modulation paradigm to assess endogenous inhibitory pain pathways. 2012;17(2):98–102. | ||
Gram M, Graversen C, Olesen SS, Drewes AM. Dynamic spectral indices of the electroencephalogram provide new insights into tonic pain. Clin Neurophysiol. 2015;126(4):763–771. | ||
Pascual-Marqui RD, Lehmann D, Koukkou M, et al. Assessing interactions in the brain with exact low-resolution electromagnetic tomography. Philos Trans A Math Phys Eng Sci. 2011;369(1952):3768–3784. | ||
Kristiansen FL, Olesen AE, Brock C, et al. The role of pain catastrophizing in experimental pain perception. Pain Pract. 2014;14(3): E136–E145. | ||
Hansen TM, Olesen AE, Graversen C, Drewes AM, Frøkjaer JB. The effect of oral morphine on pain-related brain activation – an experimental functional magnetic resonance imaging study. Basic Clin Pharmacol Toxicol. 2015;117(5):316–322. | ||
Hansen TM, Graversen C, Frøkjaer JB, Olesen AE, Valeriani M, Drewes AM. Single-sweep spectral analysis of contact heat evoked potentials: a novel approach to identify altered cortical processing after morphine treatment. Br J Clin Pharmacol. 2015;79(6):926–936. | ||
Hansen TM, Olesen AE, Simonsen CW, Drewes AM, Frøkjær JB. Cingulate metabolites during pain and morphine treatment as assessed by magnetic resonance spectroscopy. J Pain Res. 2014;7:269–276. | ||
Gram M, Graversen C, Olesen AE, Drewes AM. Machine learning on encephalographic activity may predict opioid analgesia. Eur J pain. 2015;19(10):1552–1561. | ||
Sverrisdóttir E, Foster DJ, Upton RN, et al. Modelling concentration-analgesia relationships for morphine to evaluate experimental pain models. Eur J Pharm Sci. 2015;66:50–58. | ||
Lelic D, Olesen AE, Gregersen H, Dahan A, Kolesnikov Y, Drewes AM. Morphine modifies the cingulate-operculum network underlying painful rectal evoked potentials. Neuropharmacology. 2014;77:422–427. | ||
Drewes AM, Gregersen H, Arendt-Nielsen L. Experimental pain in gastroenterology: a reappraisal of human studies. Scand J Gastroenterol. 2003; 38(11):1115–1130. | ||
Mazziotta J, Toga A, Evans A, et al. A probabilistic atlas and reference system for the human brain: International Consortium for Brain Mapping (ICBM). Philos Trans R Soc Lond B Biol Sci. 2001;356(1412):1293–1322. | ||
Duerden EG, Albanese MC. Localization of pain-related brain activation: a meta-analysis of neuroimaging data. Hum Brain Mapp. 2013;34(1):109–149. | ||
Fleiss JL. Design and Analysis of Clinical Experiments. John Wiley and Sons, New York, USA; 1986. | ||
Atkinson G, Nevill AM. Statistical methods for assessing measurement error (reliability) in variables relevant to sports medicine. Sports Med. 1998;26(4):217–238. | ||
Nichols TE, Holmes AP. Nonparametric permutation tests for functional neuroimaging : a primer with examples. 2002;15(1):1–25. | ||
La Cesa S, Tinelli E, Toschi N, et al. fMRI pain activation in the periaqueductal gray in healthy volunteers during the cold pressor test. Magn Reson Imaging. 2014;32(3):236–240. | ||
Frankenstein UN, Richter W, McIntyre MC, Rémy F. Distraction modulates anterior cingulate gyrus activations during the cold pressor test. Neuroimage. 2001;14(4):827–836. | ||
Le Pera D, Svensson P, Valeriani M, Watanabe I, Arendt-Nielsen L, Chen AC. Long-lasting effect evoked by tonic muscle pain on parietal EEG activity in humans. Clin Neurophysiol. 2000;111(12):2130–2137. | ||
Chang PF, Arendt-Nielsen L, Chen AC. Dynamic changes and spatial correlation of EEG activities during cold pressor test in man. Brain Res Bull. 2002;57(5):667–675. | ||
Ferracuti S, Seri S, Mattia D, Cruccu G. Quantitative EEG modifications during the cold water pressor test: hemispheric and hand differences. Int J Psychophysiol. 1994;17(3):261–268. | ||
Dowman R, Rissacher D, Schuckers S. EEG indices of tonic pain-related activity in the somatosensory cortices. Clin Neurophysiol. 2008;119(5):1201–1212. | ||
Jensen MP, Hakimian S, Sherlin LH, Fregni F. New insights into neuromodulatory approaches for the treatment of pain. J Pain. 2008;9(3):193–199. | ||
Shao S, Shen K, Yu K, Wilder-Smith EP, Li X. Frequency-domain EEG source analysis for acute tonic cold pain perception. Clin Neurophysiol. 2012;123(10):2042–2049. | ||
Zhang ZG, Hu L, Hung YS, Mouraux A, Iannetti GD. Gamma-band oscillations in the primary somatosensory cortex–a direct and obligatory correlate of subjective pain intensity. J Neurosci. 2012;32(22):7429–7438. | ||
Mouraux A, Diukova A, Lee MC, Wise RG, Iannetti GD. A multisensory investigation of the functional significance of the “pain matrix”. Neuroimage. 2011;54(3):2237–2249. | ||
Brooks JC, Nurmikko TJ, Bimson WE, Singh KD, Roberts N. fMRI of thermal pain: effects of stimulus laterality and attention. Neuroimage. 2002;15(2):293–301. | ||
Christmann C, Koeppe C, Braus DF, Ruf M, Flor H. A simultaneous EEG-fMRI study of painful electric stimulation. Neuroimage. 2007;34(4):1428–1437. | ||
Khodayari-Rostamabad A, Graversen C, Malver LP, et al. A cortical source localization analysis of resting EEG data after remifentanil infusion. Clin Neurophysiol. 2015;126(5):898–905. | ||
Peng W, Hu L, Zhang Z, Hu Y. Changes of spontaneous oscillatory activity to tonic heat pain. PLoS One. 2014;9(3):e91052. | ||
Tiemann L, Schulz E, Gross J, Ploner M. Gamma oscillations as a neuronal correlate of the attentional effects of pain. Pain. 2010;150(2):302–308. | ||
Pascual-Marqui RD, Biscay RJ, Bosch-Bayard J, et al. Assessing direct paths of intracortical causal information flow of oscillatory activity with the isolated effective coherence (iCoh). Front Hum Neurosci. 2014;8:448. |
 © 2017 The Author(s). This work is published and licensed by Dove Medical Press Limited. The
full terms of this license are available at https://www.dovepress.com/terms
and incorporate the Creative Commons Attribution
- Non Commercial (unported, 3.0) License.
By accessing the work you hereby accept the Terms. Non-commercial uses of the work are permitted
without any further permission from Dove Medical Press Limited, provided the work is properly
attributed. For permission for commercial use of this work, please see paragraphs 4.2 and 5 of our Terms.
© 2017 The Author(s). This work is published and licensed by Dove Medical Press Limited. The
full terms of this license are available at https://www.dovepress.com/terms
and incorporate the Creative Commons Attribution
- Non Commercial (unported, 3.0) License.
By accessing the work you hereby accept the Terms. Non-commercial uses of the work are permitted
without any further permission from Dove Medical Press Limited, provided the work is properly
attributed. For permission for commercial use of this work, please see paragraphs 4.2 and 5 of our Terms.