Back to Journals » Diabetes, Metabolic Syndrome and Obesity » Volume 15
Characteristics of OGTT and Correlation Between the Insulin to C-Peptide Molar Ratio, HOMA-IR, and Insulin Antibodies in T2DM Patients
Authors Hua KF ![]() , Zhang MY
, Zhang MY ![]() , Zhang Y
, Zhang Y ![]() , Ren BJ
, Ren BJ ![]() , Wu YH
, Wu YH ![]()
Received 14 May 2022
Accepted for publication 26 July 2022
Published 9 August 2022 Volume 2022:15 Pages 2417—2425
DOI https://doi.org/10.2147/DMSO.S373475
Checked for plagiarism Yes
Review by Single anonymous peer review
Peer reviewer comments 3
Editor who approved publication: Prof. Dr. Antonio Brunetti
Kai-Fang Hua,1,2 Ming-You Zhang,2 Yao Zhang,2 Bing-Jie Ren,2 Yan-Hui Wu1
1Department of Endocrinology, Xiang’ an Hospital of Xiamen University, Xiamen, Fujian, People’ s Republic of China; 2School of Medicine, Xiamen University, Xiamen, Fujian, People’ s Republic of China
Correspondence: Yan-Hui Wu, Department of Endocrinology, Xiang’ an Hospital of Xiamen University, 2000 Xiang’ an East Road, Xiamen, Fujian, 361102, People’ s Republic of China, Tel +86 13089998806, Email [email protected]
Purpose: The purpose of our study was to analyze the characteristics of OGTT and the correlation between the insulin to C-peptide molar ratio (ICPR), HOMA-IR and insulin antibodies (IAs) in T2DM patients.
Patients and Methods: A total of 77 T2DM patients were included and divided into the IA+ group (25 patients) and IA- group (52 patients). The values of serum glucose, insulin, and C-peptide testing during 2-h OGTT were summarized comparatively, and ROC was made to analyze the predictive value of ICPR for IAs.
Results: At each time point of OGTT, there was no significant difference in serum glucose and C-peptide changes (p> 0.05). Serum insulin levels in positive patients were elevated or not at different time points of the OGTT but ICPR was significantly different (P< 0.05) in the two groups. Spearman correlation coefficient analysis showed that the presence of insulin antibodies was correlated with ICPR, but not with HOMA-IR, and ICPR-2h had a better prediction capacity (AUC=0.735, the optimal cutoff-point=0.11, Se=0.760, Sp=0.635).
Conclusion: T2DM patients with IAs showed no difference in serum glucose and serum C-peptide changes, but elevated or not insulin levels on the OGTTs, compared with negative patients. ICPR-2h can be a preliminary diagnostic index to timely predict IAs in T2DM patients.
Keywords: insulin therapy, insulin resistance, oral glucose tolerance test, receiver operating characteristic curve
Plain Language Summary
The original research article was aimed at insulin therapy for type 2 diabetes patients. As we know, diabetes is a chronic disease with elevated blood sugar as its main clinical manifestation. As a drug, insulin can decrease blood sugar in patients and control complications. However, insulin is a foreign protein (foreign antigen) for the human body and the immune system will produce corresponding antibodies to bind to it, thus making it ineffective, which is what we do not want to see.
The OGTT (oral glucose tolerance test) is a routine test to a patient’s glucose tolerance in clinical practice. It continuously detects blood glucose, insulin, and C-peptide through continuous periods (0h, 0.5h, 1.0h, 2.0h). We innovatively observed the characteristics of OGTT in type 2 diabetes patients with insulin antibodies. By further analyzing the characteristics of OGTT compared with negative patients, we found significantly increased levels in the insulin to C-peptide molar ratio (ICPR, insulin (pmol /L)/C-peptide(nmol/L) ×1000). This means that we can preliminarily determine whether the patient has insulin antibodies by analyzing the patient’s OGTT in the future, especially in some primary hospitals without antibody detection equipment.
Through our study, you can better understand the new application of OGTT in patients with type 2 diabetes and understand its early diagnosis of adverse reactions to insulin use in those patients. It helps us standardize the usage of insulin to treat diabetic patients and reduce complications.
Introduction
The usage of exogenous insulin preparations is particularly common in the treatment of patients with type 2 diabetes mellitus (T2DM), and different types of insulin preparations or analogs often induce insulin antibodies (IAs) in patients.1 In T2DM patients, high circulating insulin antibodies increase mean amplitude glycemic excursion (MAGE)2 and also disrupt insulin secretion to maintain blood glucose homeostasis, causing fluctuations in blood glucose levels. Two main disorders associated with IAs in clinical practice are endogenous insulin antibody syndrome (IAS) and exogenous insulin antibody syndrome (EIAS). IAS is an uncommon cause of hyperinsulinemic hypoglycemia characterized by autoantibodies to endogenous insulin in individuals without previous exposure to exogenous insulin.3 EIAS is a condition that IAs induced by exogenous insulin in T2DM patients are associated with symptoms like hypoglycemia4 or insulin resistance.5,6 It is worth noting that many insulin antibody-positive T2DM patients do not show obvious and recurrent hypoglycemia, but only have a certain degree of insulin resistance when using insulin preparations,7 which can be considered atypical EIAS. Nevertheless, the presence of insulin antibodies in serum often interferes with the therapeutic effect of insulin preparations. Therefore, when a T2DM patient exposed to exogenous insulin develops symptoms such as insulin resistance and hypoglycemia, it is particularly important to detect serum insulin antibodies for the subsequent administration of insulin.
The oral glucose tolerance tests (OGTTs) are standardized by establishing an oral glucose load of 75 g and 2-h postglucoseload glycemia (2hPG), according to the Expert Committee of the American Diabetes Association (ADA).8 It is applied to diagnose impaired glucose tolerance and/or type 2 diabetes mellitus in individuals.9 The insulin to C-peptide molar ratio (ICPR) has been recommended by some scholars as a method for diagnosing insulin antibodies,10 and also an aid to the diagnosis of hypoglycemia due to exogenous insulin antibodies.11 The homeostasis model assessment of insulin resistance (HOMA-IR) is classically considered a good index of insulin resistance (IR) in acromegaly (ACRO).12 As mentioned above, IR often occurs in T2DM patients with IAs. So we innovatively hypothesized that ICPR and HOMA-IR might be different between T2DM patients with and without IAs, and explored the correlation between the insulin to C-peptide molar ratio (ICPR), HOMA-IR and IAs.
There has been a significant proliferation of case reports and reviews in IAS and EIAS in recent years. However, few studies focused on the characteristics of T2DM patients with IAs on the OGTTs. To the best of our knowledge, it was the first study to analyze the characteristics of OGTTs and the correlation between ICPR, HOMA-IR and IAs.
Materials and Methods
Study Design
This retrospective study was approved by the Ethics Committee of Xiang’an Hospital of Xiamen University, and all patients participating in the study gave informed consent. Our procedures were in accordance with the Declaration of Helsinki guidelines, including any relevant details.
T2DM patients from April 2019 to March 2022 in the National Metabolic Management Center of Xiang’an Hospital of Xiamen University were selected as the research subjects. Inclusion criteria for the IA+ group patients included the following:
(1) Patient age was ≥18 years, (2) BMI (body mass index) was between 18 and 35 kg/m2, (3) diabetes course ≥3 months, (4) HbA1c ≥6.5%, (5) had a clear history of exogenous insulin usage and Insulin antibody test positive, (6) had oral glucose tolerance test during hospitalization, (7) met the WHO diagnostic criteria for T2DM.13
Patients were excluded if patients (1) were diagnosed with type 1 diabetes, gestational diabetes, or other types of diabetes; (2) had severe diabetes complications such as ketoacidosis or lactic acidosis; (3) had an autoimmune disease such as systemic lupus erythematosus or graves’ disease. Patients with heart failure, liver and kidney insufficiency, cancer, and other serious organic diseases were also excluded. The control group had the same inclusion and exclusion criteria as the IA+ group except for negative insulin antibodies, matched for age, sex, BMI, and HbA1c during the same period.
Data Collection
All laboratory tests were conducted in the Department of Laboratory Medicine in Xiang’an Hospital of Xiamen University. Patients were advised not to exercise the day before the exam. The OGTT was performed at 6:00 am, after a 12 h overnight fast with 0‐, 30‐, 60‐and 120‐minute samplings to establish serum glucose, insulin, and C-peptide levels. Most of the OGTTs of our inpatients were selected during treatment to evaluate the basic blood sugar regulation and treatment effect from medical records. For multiple OGTTs in a patient, we selected the earliest reported result based on medical records.
We measured height and weight and calculated BMIs (weight [kg]/height2 [m2]), and HbA1c levels were measured by high-performance liquid chromatography, using automatic analyzers (D-10, Bole, American). Serum insulin and C-peptide concentrations were measured by electrochemiluminescence immunoassay using an automatic analyzer (Cobas e801, Roche, Germany). Serum glucose levels were measured by the Hexokinase Method using an automatic analyzer (Cobas e702, Roche, Germany). Serum insulin antibodies were measured by the radioimmunoassay Method (Zhongke Zhongjia GC-1500 Reagent: Northern Institute of Biotechnology, Beijing). Qualitative tests (positive or negative) were performed for insulin antibodies, and the instrument will be judged as IA+ status when the insulin antibody titer exceeds 1.1COI. The insulin to C-peptide molar ratio (ICPR) was calculated by the formula: insulin (pmol /L)/C-peptide(nmol/L) ×1000. HOMA-IR was calculated as glucose0 (mmol/L) × insulin0 (mU/L)/22.5 (Glucose0 is fasting blood glucose and Insulin0 is fasting insulin).14
Statistical Analysis
The sorting and cleaning of the raw data were carried out in Microsoft Excel software. The statistical analysis was performed using RStudio software (Version 1.4.1717) and SPSS version 19.0 (SPSS, Chicago, IL, USA). Most of the data in our study were continuous variables, including age, body mass index (BMI), glycated hemoglobin (HbA1c), HOMA-IR, serum glucose, insulin, and C-peptide levels in OGTTs at each timepoint. Gender and insulin antibodies were binary variables. All continuous data were tested for normality using the Kolmogorov–Smirnov test. Variables that were not normally distributed are expressed as the median (interquartile range), the comparison between the two groups was performed using Wilcoxon Rank Sum and Signed Rank Tests. Statistical analyses were two-sided, and a p-value <0.05 was considered statistically significant.
Results
Baseline Characteristics of Patients in Two Groups
In total, 712 medical records of T2DM patients were screened in total. After our strict inclusion and exclusion, 39 T2DM patients with IAs were recruited into the present study, 14 of whom were excluded because of type 1 diabetes or gestational diabetes. Finally, 25 patients were enrolled in the IA+ group (15 males and 10 females; age 58.20±10.29 years, BMI 25.27±2.32 kg/m2, and HbA1c 8.96±1.79%).
Correspondingly, we selected 52 matched subjects from 673 IA- T2DM patients (30 males and 22 females; age 57.73±10.39 years, BMI 24.75±3.17 kg/m2, and HbA1c 8.96±1.89%). There were no significant differences in age, BMI, and HBcA1 between the two groups with and without insulin antibodies (p>0.05, all).
The Characteristics of OGTTs in Two Groups
The fluctuations of serum glucose, insulin, and C-peptide levels in OGTTs at each timepoint in two groups are presented in Table 1. As for serum glucose levels, they were not significantly different between patients with and without IAs at each time point during all the periods of OGTTs. From the fluctuations of glucose in Figure 1A, we can also observe it intuitively. As Table 1 had already shown, serum insulin levels of the positive patients were higher or not than the negative group (0h: P=0.039, 0.5h: P=0.061, 1h: P=0.071, 2h: P=0.024) (Figure 1B). By calculating the p-value, we found that C-peptide levels were not significantly different between the two groups during different time points in OGTTs (Figure 1C).
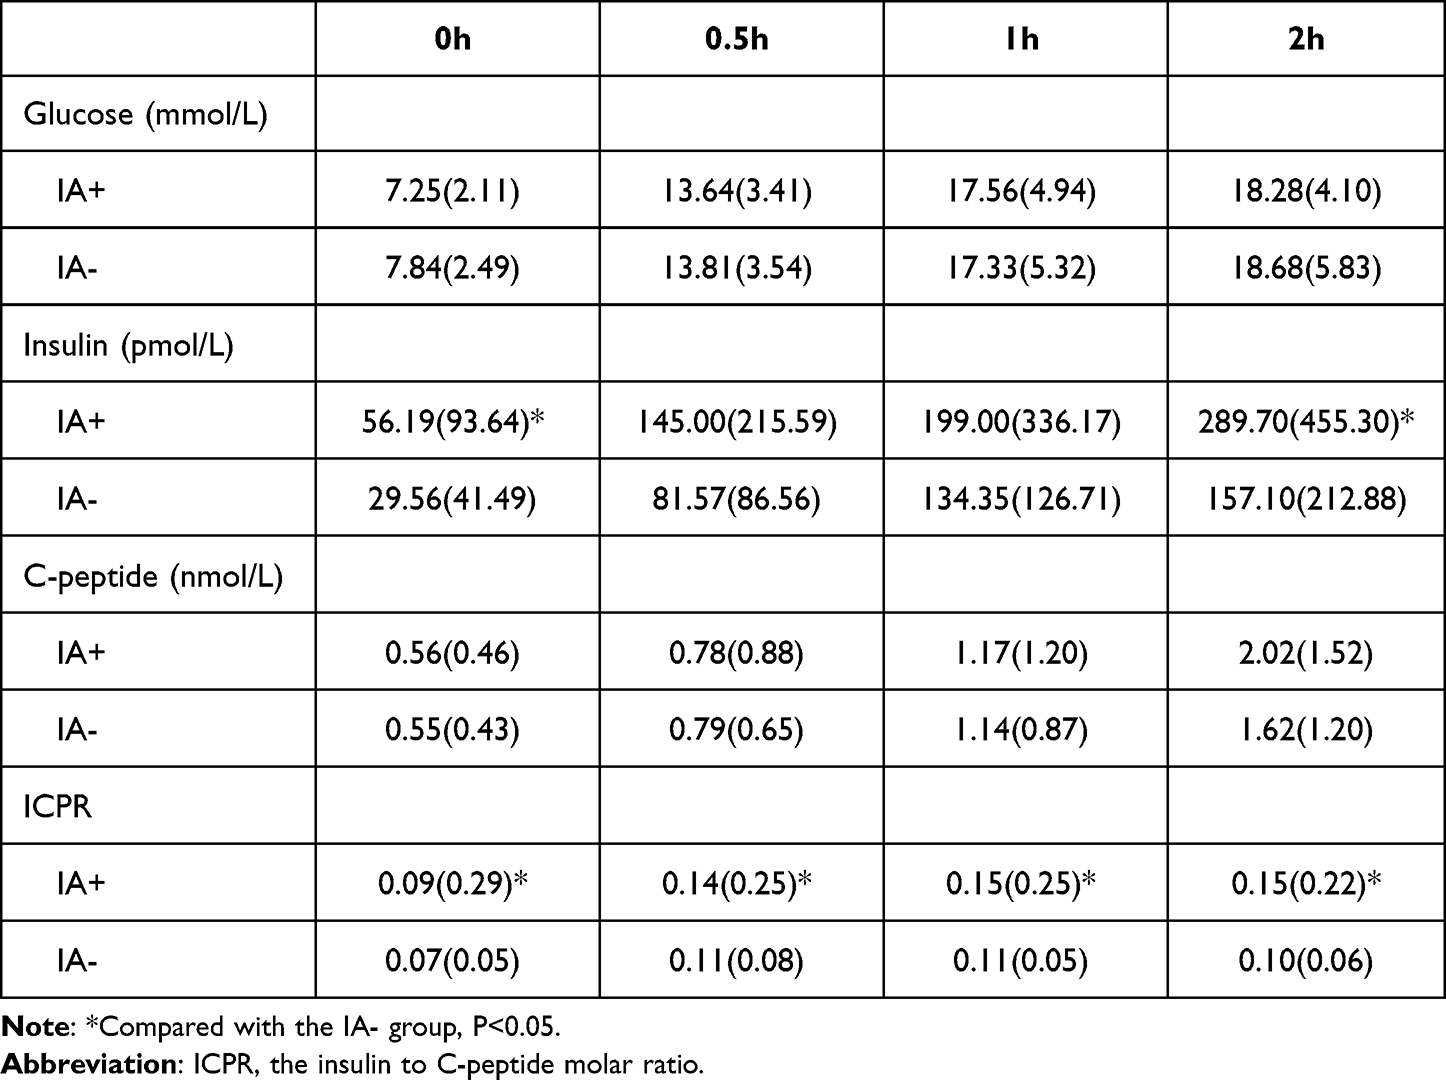 |
Table 1 Serum Glucose, Insulin, C-Peptide and ICPR Values in OGTTs Between the Two Groups (Median (Interquartile Range)) |
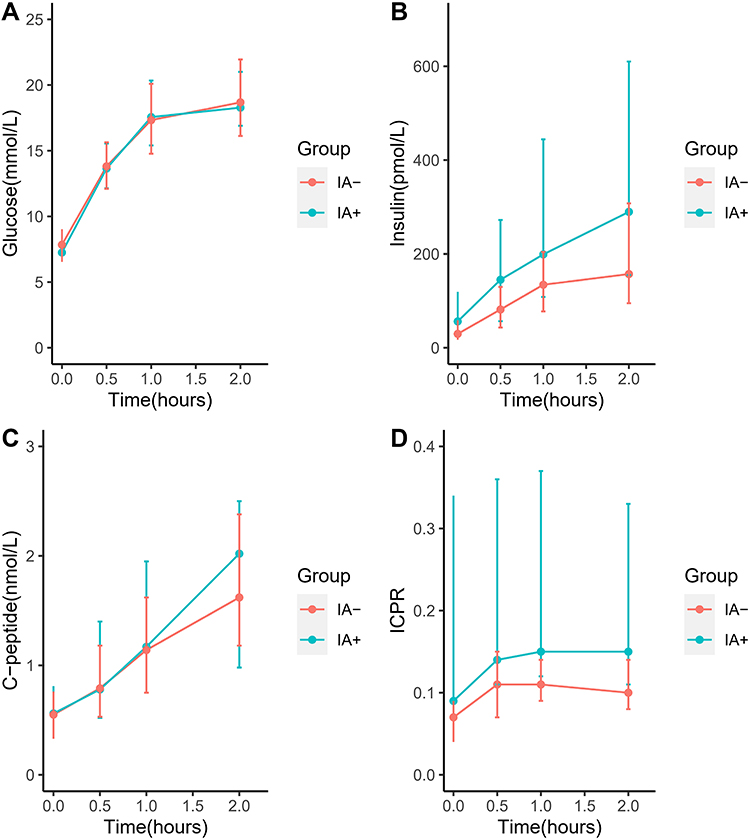 |
Figure 1 Changing trends of serum glucose, insulin, C-peptide levels, and ICPR values in OGTTs between the IA+ group and IA- group in T2DM patients. Notes: (A) serum glucose levels; (B) serum insulin levels. (C) serum C-peptide levels. (D) ICPR, the insulin to C-peptide molar ratio. Data are presented as median (interquartile range). |
The Difference in ICPR and HOMA-IR Values in the Two Groups
Whether from Table 1 or Figure 1D, these insulin antibody-positive patients had significantly elevated ICPR values versus those without insulin antibodies at each time point during OGTTs (p<0.05, all). In addition, as for HOMAI-R, there was no significant difference in the value of HOMA-IR between the IA+ group and the IA- group, 2.63 (1.06, 5.84) versus 1.44 (0.81, 2.54).
The Predictive Capacity of ICPR and HOMA-IR for IAs
From the Spearman correlation analysis of ICPR-0h, ICPR-2h, and HOMA-IR with IAs in Table 2, it could be preliminarily concluded that HOMA-IR and IAs did not have a significant correlation (p=0.054>0.05). As for ICPR at different time points, ICPR-0h and ICPR-2h showed a clear positive correlation with IA (P=0.005, P<0.001, respectively), but from the value of the correlation coefficient, the association strength of ICPR-2h with IA was better than that of ICPR-0h (r=0.381, r=0.319, respectively).
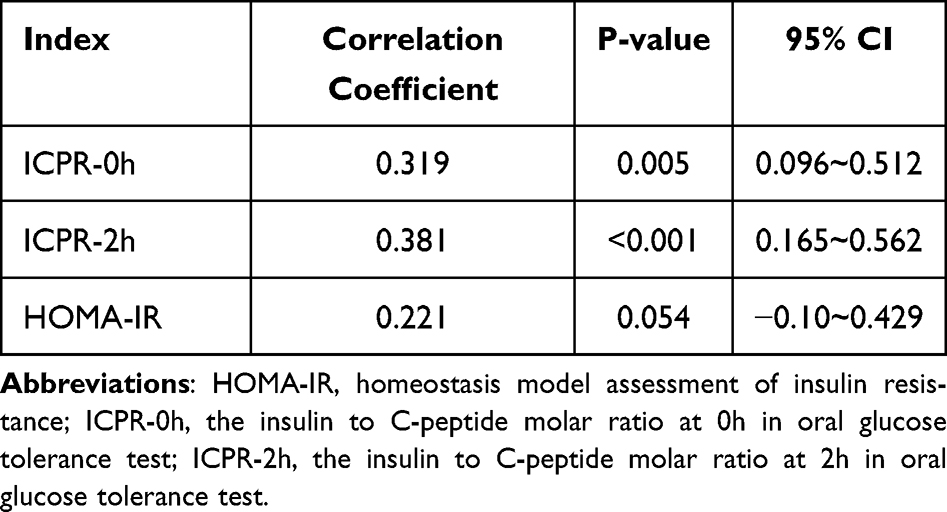 |
Table 2 Correlation Analysis of ICPR, HOMA-IR, and IAs |
Then, we performed a ROC curve analysis of ICPR-0h and ICPR-2h with IA (Figure 2), which had a statistically significant correlation in the Spearman correlation analysis. The results (Table 3) show that the AUC for ICPR-0h and ICPR-2h predicted the presence of IA were 0.697 and 0.735, respectively. Compared with ICPR-0h, ICPR-2h has a higher Youden index with AUC >0.7, indicating that ICPR-2h has a better predictive capacity for the presence of insulin antibodies.
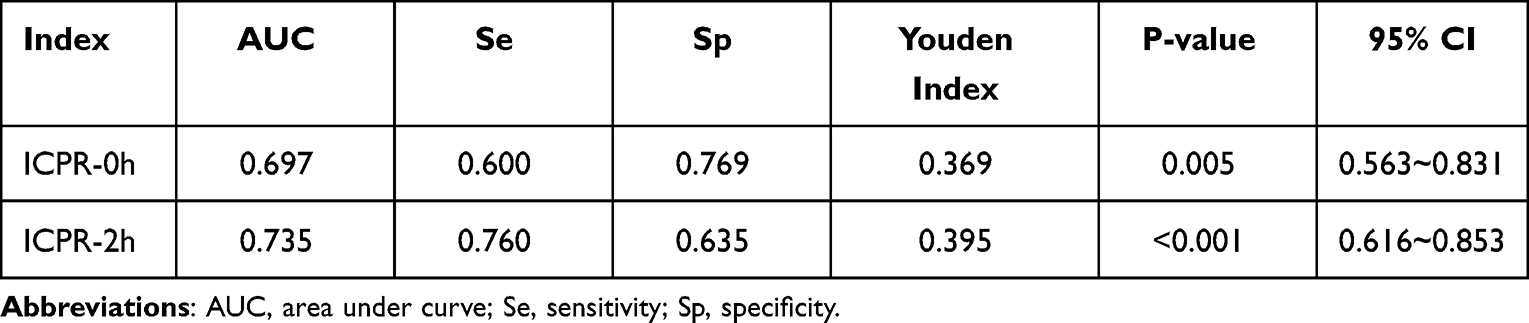 |
Table 3 ROC Analysis of ICPR-0h, ICPR-2h for Predicting the Presence of IAs |
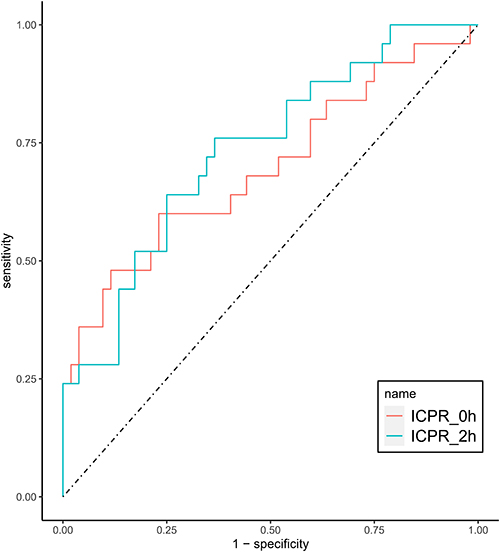 |
Figure 2 ROC curves of ICPR-0h and ICPR-2h for the predictive value of IA. |
Generally, the coordinate point in the ROC that is closest to the upper left corner of the coordinate can satisfy the relatively optimal sensitivity and specificity of the diagnostic experiment at the same time, which we call the optimal cutoff-point. We determined that the optimal cutoff-point of ICPR-2h was 0.11 (Se=0.760, Sp=0.635, Youden index =0.395) by using the “OptimalCutpoints” R package.
Discussion
The present study revealed a novel observation that the differences in OGTTs in T2DM patients with and without IAs. The OGTT is usually used to determine the dynamic changes of glucose, insulin, and C-peptide fluctuations in the reaction,15 to analyze whether there is an interference of insulin antibodies theoretically.
The main symptom of EIAS is blood glucose fluctuation,16,17 which is one of the reasons why scholars have paid attention in recent years. In our study, the changes in serum glucose levels were not significantly different between the two groups. It takes time for insulin antibodies to bind to endogenous insulin molecules, rendering them unavailable to exert their effects. On the flip side, due to methodological limitations, maybe there were some patients who had long-term use of insulin preparations, oral hypoglycemic drugs, or other unknown factors, which masked the effect of insulin antibodies on blood sugar regulation. Indeed, as mentioned above, it is rare for patients with IAs to manifest short-term drastic blood glucose fluctuations,18 most of them tend to have hypoglycemia at night and hyperglycemia during the day.19 Hyperinsulinemia is also one of the clinical manifestations of patients with IAs,20 but their C-peptide and proinsulin levels may or may not increase.21 In the present study, as our results are shown in Table 2, the serum insulin levels of positive patients were just significantly higher than those of IA- patients at 0h and 2h, while no significant difference in C-peptide levels. This result indicated that Insulin antibodies raised serum total insulin concentrations, but they had little effect on the process of insulin secretion by islet β cells themselves. In other words, C-peptide levels were largely unaffected, which had also been demonstrated in our results. At these points, our present result was in agreement with the previous studies.22 It is well known that insulin and C-peptide are released into the blood circulation in a 1:1 relationship. This suggests that patients with IAs have more insulin release during blood glucose regulation in OGTTs. The reason for the over-insulin release may be attributed to the disruption of insulin antibodies. The action of exogenous antibodies that bind with insulin is that the initial pancreatic response to an increase in blood glucose would be ineffective in lowering the blood glucose level as insulin resistance, which in turn results in prolonged pancreatic secretion of insulin and C-peptide in equimolar amounts until the endogenous antibodies’ binding capacity is exceeded.23 The decrease in insulin sensitivity, that is the decrease in insulin’s ability to respond to an increase in blood sugar, may lead to a delay in insulin secretion.24 Increased late-phase insulin levels after a glucose load may compensate for the lack of early-phase insulin secretion to regulate glucose homeostasis.25 What is more, due to the combination of insulin and IAs, the half-life of insulin increases from 5 minutes to hours, while the half-life of C-peptide usually remains unaffected (30–35 minutes).26 It is also an important cause of the relative increase in plasma insulin levels in patients.
As mentioned above, on the one hand, the interference of insulin antibodies increases the secretion of insulin, and on the other hand, insulin antibodies act as insulin pools, which greatly prolongs the half-life of insulin.27 It is not difficult to imagine that the above changes in insulin and C-peptide will directly lead to a large increase in ICPR values in patients with IAs. From Figure 1D and Table 1, we could intuitively observe the difference in ICPR between the two groups, our theoretical analysis was consistent with the results presented in the data.
As for the correlation between ICPR, HOMA-IR and insulin antibodies in T2DM patients, there was no significant correlation between HOMA-IR and IAs, while the HOMA-IR in T2DM patients with IAs also did not show a significant increase. However, ICPR presented a positive correlation with IAs in Spearman correlation analysis, and the ROC curve showed that ICPR-2h was better than ICPR-0h in predicting insulin antibodies. ICPR-0h in many studies refers to ICPR. It is worth mentioning that some scholars advocate ICPR-0h>1 as an indicator to the diagnosis of IAS or EIAS,28 which is still controversial now. insulin and C-peptide are co-secreted into the blood in a 1:1 relationship, insulin is rapidly metabolized by the liver, and C-peptide is slowly eliminated by the kidneys. The former half-life is 5–10 minutes, and the latter is 30–35 minutes, so the normal ICPR value is <1.11,29 ICPR-0h was not consistently >1 in patients with insulin antibodies, which suggested the low sensitivity of ICPR-0h to detect IAS,30 which is also reflected in our study. Therefore, we conducted an innovative comparative analysis of the correlation between ICPR-0h, ICPR-2h, and IAs, and found that when ICPR>0.11, it is likely to indicate the presence of insulin antibodies. The higher the ICPR, the greater the possibility of insulin antibody positive.
At present, the laboratory equipment, hardware conditions, and technical personnel required for IA measurement are relatively high and difficult to carry out routinely. Many primary medical institutions lack corresponding testing conditions. If some routine indicators can be combined to predict the risk of IA positive occurrence, it is of great significance for the diagnosis and treatment of T2DM patients with IAs. Preliminary screening by using ICPR-2h will help physicians predict the risk of IA positive in patients and conduct follow-up usage of insulin preparations.
There were limitations in the current study. Firstly, the number of patients with positive insulin antibodies was relatively small, so the sensitivity and specificity of the ICPR-0h need to be further improved. Secondly, due to the limitations of the hospital’s testing equipment, insulin antibodies can only be detected qualitatively (positive or negative), and the titer of insulin antibodies cannot be quantitatively detected, resulting in the inability of further research. If possible, subsequent studies on the correlation between insulin antibody titers and ICPR can be carried out quantitatively.
Conclusions
In our present study, compared with T2DM patients without IAs, the different characteristics of OGTTs have been summarized as follows: (1) Considering the short-term character of OGTT and individual differences in treatment control, patients with IAs maybe did not show significant differences in blood glucose excursions on OGTTs. (2) Serum insulin levels may be significantly elevated at different time points, but the C-peptide levels may not increase significantly at each time point of the OGTTs. Insulin elevations are disproportionate to changes in C-peptide in IA-positive patients. (3) ICPR-2h showed a strong correlation with insulin antibodies, ICPR-2h>0.11 may be a preliminary diagnostic index for IA-positive T2DM patients.
Consent for Publication
All authors listed meet the authorship criteria according to the latest guidelines of the International Committee of Medical Journal Editors. All authors agree with the manuscript and certify that they have participated sufficiently in the work to take public responsibility for the appropriateness of the experimental design and method, and the collection, analysis, and interpretation of the data.
Acknowledgments
The authors would like to sincerely thank all the patients who participated in this study.
The work was supported by Special Fund for Introducing High-level Health Talents in Xiamen (code number PM202204140001) and XMU Training Program of Innovation and Entrepreneurship for Undergraduates (grant number S202210384849).
Author Contributions
All authors made a significant contribution to the work reported, whether that is in the conception, study design, execution, acquisition of data, analysis and interpretation, or in all these areas; took part in drafting, revising or critically reviewing the article; gave final approval of the version to be published; have agreed on the journal to which the article has been submitted; and agree to be accountable for all aspects of the work.
Disclosure
The authors report no conflicts of interest in this work.
References
1. Zhuang Y, Wei X, Yu Y, Wang D. Exogenous insulin antibody syndrome treated with plasma exchange after an incomplete response to immunosuppressive therapy. J Clin Apher. 2021;36(4):664–667. doi:10.1002/jca.21905
2. Zhu J, Yuan L, Ni WJ, Luo Y, Ma JH. Association of higher circulating insulin antibody with increased mean amplitude glycemic excursion in patients with type 2 diabetes mellitus: a cross-sectional, retrospective case-control study. J Diabetes Res. 2019;2019:7304140. doi:10.1155/2019/7304140
3. Masuda A, Tsushima T, Shizume K, et al. Insulin autoimmune syndrome with insulin-resistant diabetes at the incipient stage prior to hypoglycemic attacks. J Endocrinol Invest. 1986;9(6):507–512. doi:10.1007/bf03346977
4. Itoh A, Saisho Y, Mitsuishi M, et al. Insulin glulisine may ameliorate nocturnal hypoglycemia related to insulin antibody–a case report. Diabetes Res Clin Pract. 2011;94(2):e53–e54. doi:10.1016/j.diabres.2011.04.001
5. Ishizuka T, Ogawa S, Mori T, et al. Characteristics of the antibodies of two patients who developed daytime hyperglycemia and morning hypoglycemia because of insulin antibodies. Diabetes Res Clin Pract. 2009;84(2):e21–e23. doi:10.1016/j.diabres.2009.02.007
6. Hu X, Ma X, Wang X, et al. Insulin antibodies in patients with type 2 diabetic receiving recombinant human insulin injection: a report of 12 cases. Ann Endocrinol. 2015;76(6):694–697. doi:10.1016/j.ando.2015.10.004
7. Fineberg SE, Kawabata TT, Finco-Kent D, Fountaine RJ, Finch GL, Krasner AS. Immunological responses to exogenous insulin. Endocr Rev. 2007;28(6):625–652. doi:10.1210/er.2007-0002
8. Jagannathan R, Neves JS, Dorcely B, et al. The oral glucose tolerance test: 100 years later. Diabetes Metab Syndr Obes. 2020;13:3787–3805. doi:10.2147/DMSO.S246062
9. Kuo FY, Cheng KC, Li Y, Cheng JT. Oral glucose tolerance test in diabetes, the old method revisited. World J Diabetes. 2021;12(6):786–793. doi:10.4239/wjd.v12.i6.786
10. Censi S, Mian C, Betterle C. Insulin autoimmune syndrome: from diagnosis to clinical management. Ann Transl Med. 2018;6(17):335. doi:10.21037/atm.2018.07.32
11. Lebowitz MR, Blumenthal SA. The molar ratio of insulin to C-peptide. An aid to the diagnosis of hypoglycemia due to surreptitious (or inadvertent) insulin administration. Arch Intern Med. 1993;153(5):650–655. doi:10.1001/archinte.1993.00410050082011
12. Kasayama S, Otsuki M, Takagi M, et al. Impaired beta-cell function in the presence of reduced insulin sensitivity determines glucose tolerance status in acromegalic patients. Clin Endocrinol (Oxf). 2000;52(5):549–555. doi:10.1046/j.1365-2265.2000.00986.x
13. Colagiuri S, Falavigna M, Agarwal MM, et al. Strategies for implementing the WHO diagnostic criteria and classification of hyperglycaemia first detected in pregnancy. Diabetes Res Clin Pract. 2014;103(3):364–372. doi:10.1016/j.diabres.2014.02.012
14. Wallace TM, Levy JC, Matthews DR. Use and abuse of HOMA modeling. Diabetes Care. 2004;27(6):1487–1495. doi:10.2337/diacare.27.6.1487
15. Stumvoll M, Mitrakou A, Pimenta W, et al. Use of the oral glucose tolerance test to assess insulin release and insulin sensitivity. Diabetes Care. 2000;23(3):295–301. doi:10.2337/diacare.23.3.295
16. Quan H, Tan H, Li Q, Li J, Li S. Immunological hypoglycemia associated with insulin antibodies induced by exogenous insulin in 11 Chinese patients with diabetes. J Diabetes Res. 2015;2015:746271. doi:10.1155/2015/746271
17. Zhao TY, Li F, Xiong ZY. Frequent reoccurrence of hypoglycemia in a type 2 diabetic patient with insulin antibodies. Mol Diagn Ther. 2010;14(4):237–241. doi:10.1007/bf03256379
18. Hu X, Chen F. Exogenous insulin antibody syndrome (EIAS): a clinical syndrome associated with insulin antibodies induced by exogenous insulin in diabetic patients. Endocr Connect. 2018;7(1):R47–R55. doi:10.1530/EC-17-0309
19. Shen Y, Song X, Ren Y. Insulin autoimmune syndrome induced by exogenous insulin injection: a four-case series. BMC Endocr Disord. 2019;19(1):148. doi:10.1186/s12902-019-0482-0
20. Uchigata Y, Hirata Y, Omori Y. A novel concept of type VII hypersensitivity introduced by insulin autoimmune syndrome (Hirata’s disease). Autoimmunity. 1995;20(3):207–208. doi:10.3109/08916939508993352
21. Li Z, Yi D, Zheng L, Li S, Fang W, Wang C. Analysis of the clinical characteristics of insulin autoimmune syndrome induced by exogenous insulin in diabetic patients. Diabetol Metab Syndr. 2021;13(1). doi:10.1186/s13098-021-00658-z
22. Hattori N, Duhita MR, Mukai A, Matsueda M, Shimatsu A. Development of insulin antibodies and changes in titers over a long-term period in patients with type 2 diabetes. Clin Chim Acta. 2014;433:135–138. doi:10.1016/j.cca.2014.03.008
23. Goldman J, Baldwin D, Rubenstein AH, et al. Characterization of circulating insulin and proinsulin-binding antibodies in autoimmune hypoglycemia. J Clin Invest. 1979;63(5):1050–1059. doi:10.1172/JCI109374
24. Lv X, Fang K, Hao W, Han Y, Yang N, Yu Q. Identification of reactive hypoglycemia with different basic BMI and its causes by prolonged oral glucose tolerance test. Diabetes Metab Syndr Obes. 2020;13:4717–4726. doi:10.2147/DMSO.S280084
25. Sun Y, Han J, Lin Z, Song L, Wang C, Jia W. Delayed insulin secretion response during an OGTT is associated with an increased risk for incidence of diabetes in NGT subjects. J Diabetes Complications. 2016;30(8):1537–1543. doi:10.1016/j.jdiacomp.2016.07.029
26. Ismail AAA. The double whammy of endogenous insulin antibodies in non-diabetic subjects. Clin Chem Lab Med. 2008;46(2):153–156. doi:10.1515/CCLM.2008.031
27. Egawa T, Tsuneshige A, Suematsu M, Yonetani T. Method for determination of association and dissociation rate constants of reversible bimolecular reactions by isothermal titration calorimeters. Anal Chem. 2007;79(7):2972–2978. doi:10.1021/ac062183z
28. Huynh T. Clinical and laboratory aspects of insulin autoantibody-mediated glycaemic dysregulation and hyperinsulinaemic hypoglycaemia: insulin autoimmune syndrome and exogenous insulin antibody syndrome. Clin Biochem Rev. 2020;41(3):93–102. doi:10.33176/AACB-20-00008
29. Wong SL, Priestman A, Holmes DT. Recurrent hypoglycemia from insulin autoimmune syndrome. J Gen Intern Med. 2014;29(1):250–254. doi:10.1007/s11606-013-2588-9
30. Yuan T, Li J, Li M, et al. Insulin autoimmune syndrome diagnosis and therapy in a single Chinese center. Clin Ther. 2019;41(5):920–928. doi:10.1016/j.clinthera.2019.03.009
 © 2022 The Author(s). This work is published and licensed by Dove Medical Press Limited. The
full terms of this license are available at https://www.dovepress.com/terms
and incorporate the Creative Commons Attribution
- Non Commercial (unported, 3.0) License.
By accessing the work you hereby accept the Terms. Non-commercial uses of the work are permitted
without any further permission from Dove Medical Press Limited, provided the work is properly
attributed. For permission for commercial use of this work, please see paragraphs 4.2 and 5 of our Terms.
© 2022 The Author(s). This work is published and licensed by Dove Medical Press Limited. The
full terms of this license are available at https://www.dovepress.com/terms
and incorporate the Creative Commons Attribution
- Non Commercial (unported, 3.0) License.
By accessing the work you hereby accept the Terms. Non-commercial uses of the work are permitted
without any further permission from Dove Medical Press Limited, provided the work is properly
attributed. For permission for commercial use of this work, please see paragraphs 4.2 and 5 of our Terms.
Recommended articles
Clinical Characteristics and Risk Factors of Exogenous Insulin Antibody Syndrome in Patients with Diabetes: A Retrospective Cross-Sectional Study
Zhou J, Li J, Wang Z, Dai X, Zhang N, Kong L, Wu S, Liu J, Zhang Y, Han T
Diabetes, Metabolic Syndrome and Obesity 2026, 19:571981
Published Date: 7 March 2026