Back to Journals » Clinical Ophthalmology » Volume 17
Changes in the Parameters of Visual Evoked Potentials in Media Opacities
Authors Elsaid MAM ![]() , Soliman S, Hashem O
, Soliman S, Hashem O ![]()
Received 30 May 2023
Accepted for publication 10 October 2023
Published 31 October 2023 Volume 2023:17 Pages 3261—3270
DOI https://doi.org/10.2147/OPTH.S423526
Checked for plagiarism Yes
Review by Single anonymous peer review
Peer reviewer comments 2
Editor who approved publication: Dr Scott Fraser
Maryam AM Elsaid,1 Shady Soliman,2 Omar Hashem2
1Department of Clinical Electrophysiology of Vision, Research Institute of Ophthalmology, Giza, Egypt; 2Department of Cornea and Refractive, Research Institute of Ophthalmology, Giza, Egypt
Correspondence: Omar Hashem, Department of Cornea and Refractive, Research institute of Ophthalmology, Giza, Egypt, Tel +201222422032, Email [email protected]
Purpose: This study compared flash visual evoked potentials (VEPs) parameter differences between eyes with unilateral opaque media and their normal contralateral counterparts.
Patients and Methods: We included 178 patients with unilateral media opacity and normal contralateral eye in each patient. The diseased eyes had normal ultrasonographic findings and were candidates for keratoplasty or anterior segment reconstruction. The patients underwent electrophysiological testing by the flash VEPs recording with the use of 1.4Hz (transient) and 8Hz (flicker) frequencies.
Results: The medians of P2 implicit times were significantly higher in eyes with media opacity than in normal eyes, with median differences between both eyes of − 6.7 ms. Furthermore, the median N2P2 amplitude was 9.70 μv with media opacity compared with 11.00 μv in the normal eyes, with a significant difference of 1.3 (p = 0.002). The flash VEPs median parameters recorded at a frequency of 8-Hz showed significant differences in medians of spectral plots of 0.6 μv between normal and abnormal eyes. The same for the signal-to-noise ratio, where the difference in medians was 3 dB. Analysis of the difference between both eyes (normal–abnormal) in each patient showed in P2 implicit time a difference range of − 49 to 54.7 ms with a median difference of − 3 ms. The difference in amplitudes of recorded N2P2 showed a median of 2.13 μv. There was a statistically significant but weak negative correlation between N2P2 amplitude (r spearman = − 0.173, p = 0.021) and the grades of corneal opacity.
Conclusion: Preoperative flash VEPs recording is useful for evaluating visual function in patients with unilateral media opacity to determine the future benefits of keratoplasty or anterior segment reconstruction. There are no correlations between the flash VEP parameters or the difference between the 2 eyes and the grades of corneal opacity.
Keywords: corneal opacity, keratoplasty, flash visual evoked potential, unilateral
Introduction
Ocular media opacity is a common clinical problem that hinders light transmission and causes loss of vision. Corneal opacities can result from trauma, chemical injuries, infections, complicated surgeries, or genetic corneal disorders, such as corneal dystrophies.1 Keratoplasty and Keratoprothesis are expensive and lengthy surgical procedures. Postoperative visual outcomes will be affected by the presence of posterior segment abnormalities.2 Ultrasonography of the eye is useful in detecting the structural posterior segment abnormalities, such as retinal detachment or vitreous hemorrhage, but it shows no information about the functional abnormalities like macular scars or optic neuropathy.3 This highlights the importance of visual electrophysiologic techniques in guiding the management.4
Furthermore, the use of flash ERG alone in cases of media opacity can detect mass retinal dysfunction but it will not detect localized macular pathologies or optic nerve disorders.5,6 Flash visual evoked potentials (VEPs) are noninvasive tests that measure the electrophysiological responses of the optical cortex to a white light flash stimulus. When the retina and visual pathway are intact, flash VEP reflects macular function because of its wide representation from the macular region to the occipital cortex. Despite the wide intra- and inter-individual variability in waveform and peak latency, it is still the only objective method to evaluate the integrity of the visual pathway in cases of media opacities.7–9
In 1988, Galloway highlighted the importance of comparing the two eyes when one is clinically normal, as this greatly enhances the predictive value of electrodiagnostic testing in cases of unilateral media opacities.8 The previous studies were concerned more about the predictive value of flash VEP before performing the keratoplasty.10–13 They also reported different testing parameters than what we used. We were concerned about showing the ranges and medians for the difference between the two eyes in different grades for the density of opacity.
Materials and Methods
Ethical Considerations
The study protocol was approved by the Ethics Committee of the Research Institute of Ophthalmology, Giza, Egypt (Institutional Review Board approval number: 2021120601) and was conducted in accordance with the principles of the Declaration of Helsinki. Informed consent was obtained from all the patients. We were responsible for maintaining the confidentiality of the data.
Study Design, Setting, and Date
This cross-sectional study was conducted at the Electrophysiology Clinic, as referred by consultants in the Cornea Department of the Research Institute of Ophthalmology and health insurance authorities in Egypt. The data were collected between December 2017 and February 2022.
Eligibility Criteria
We included all patients with unilateral media opacity, absence of abnormality in the posterior segment on testing by ultrasonography in the diseased eye and no abnormalities in vision or fundus in the fellow eyes. The patients were candidates for keratoplasty or anterior segment reconstruction. We excluded patients with a history of cerebrovascular accidents, photosensitive epilepsy, any changes to the skin in the occipital region, reduced best-corrected visual acuity (BCVA) (<0.7) in their normal eye and abnormality in posterior segment on testing by the ultrasonography in the affected eye as vitreous hemorrhage or retinal detachment, etc. Cases that showed any fundus abnormality in the fellow eye were excluded. We included patients with different grades of diffuse corneal opacity with obscuration on fundus examination using indirect ophthalmoscopy.
Data Collection
The age, sex, and cause of corneal opacity in the study participants were recorded. The patients underwent a thorough ophthalmic examination and assessment of visual acuity; they were then sent for electrophysiological testing by flash VEPs recording. Corneal opacity was graded using the Roper Hall classification as follows: grade 0, no corneal haze; grade 1, the iris details were visible; grade 2, the iris details were not visible, but the pupillary margin was visible; grade 3, the pupillary margin was not visible; grade 4, the cornea was completely opaque.14
The Flash Visual Evoked Potential Recording
Flash VEPs examinations were performed using the RETI-port/scan 21 - Roland Consult at two frequencies of 1.4-Hz (transient VEP) and 8-Hz (flicker VEP) using the standard protocol of flash VEP provided by the International Society of Clinical Electrophysiology of Vision (ISCEV).15 The flash VEPs were adopted instead of the pattern VEP in this study because of the difficulty in recording the main wave of the pattern VEPs in the presence of dense media opacities. Both the opacified cornea and normal fellow eyes were examined by flash VEPs to use the normal fellow eye as the patient’s internal control.
A one-channel montage was used to record the flash VEPs using silver cup scalp electrodes placed in accordance with the international system. An active electrode was placed at the Oz position on the occipital scalp over the visual cortex. The reference and ground electrodes were placed at Fz and Cz (the forehead and vertex, respectively). Monocular stimulation was performed using a Ganzfeld stimulator Q450, which was presented in a dimly illuminated room. The exact first stimulus frequency was 1.40056-Hz with a cycle time of 0.714 s. The white flash intensity of the LED was adjusted to 0 dB (3.00 cds/m2) with an LED background of 25 cd/m2.
At 8-Hz, the flash color was white with an LED flash intensity of 3.00 cds/m². The LED background intensity was set at 25 cd/m ². The exact Stimulus frequency was 8.06452-Hz. The cycle time was 0.124 s. To ensure monocular testing, a light-tight opaque black patch was used to cover the non-tested eye. The right and left eyes were successively tested. The camera attached inside Ganzfeld helped monitor the tested eye opening during the test. The artifact detection mode was defined as a percentage of the range of the two patterns of stimuli, with 100 averages taken for each stimulus. Electrode impedance was maintained at less than 10 kV, and no mydriatics were used before testing.
We used the P2 wave parameters (implicit time in ms and N2-P2 amplitudes in µv) for statistical analysis as mentioned in the standard of ISCEV for clinical visual evoked potentials: (2016 update).15 Therefore, following the completion of the tests, with the built-in RETIport software V 6.16.3.4, P2 parameters (amplitudes and peak times). Peak time was calculated as the time from stimulus onset to the peak of the P2 component in milliseconds (ms), whereas P2 amplitude was measured from the preceding negative peak N2 to the positive peak P2 in microvolts (µv). The recorded parameters produced at a frequency of 8-Hz were the VEPs sinusoidal waves with the study of the spectral plot amplitude (µv) and signal-to-noise ratio in decibels (dB). They were automatically measured using the signal-to-noise ratio (SNR) at the first harmonic in the Fourier analysis of the 8.06-Hz response.
Statistical Analysis
Data were analyzed, tabulated, and presented using SPSS software version 22.0. Categorical data were presented as numbers and percentages. Numerical data were tested for normality using the Shapiro–Wilk test. Normally distributed data were described using range (minimum and maximum), mean, and standard deviation and were compared using the independent t-test. Skewed data were presented as the median and interquartile range (25th–75th percentiles), and comparisons were performed using the Mann–Whitney U-test. Furthermore, Spearman’s rank correlation was performed between the corneal opacity grading and the obtained flash VEP parameters. Statistical significance was set at p <0.05.
Results
This study included 178 patients with unilateral corneal opacity, who were candidates for keratoplasty or anterior segment reconstruction. Males outnumbered females (62.4% vs 37.6%, respectively). Their mean ages were 44.0 ± 20.1 years. Visual acuity assessment revealed hand movement in most patients (42.1%), followed by less than 3/60 (from 3/60 to hand motion vision) (22.5%). The most frequent causes of corneal opacity were corneal opacification after infectious ulcers (57.3%) and corneal decompensation after cataract extraction (16.3%) (Table 1).
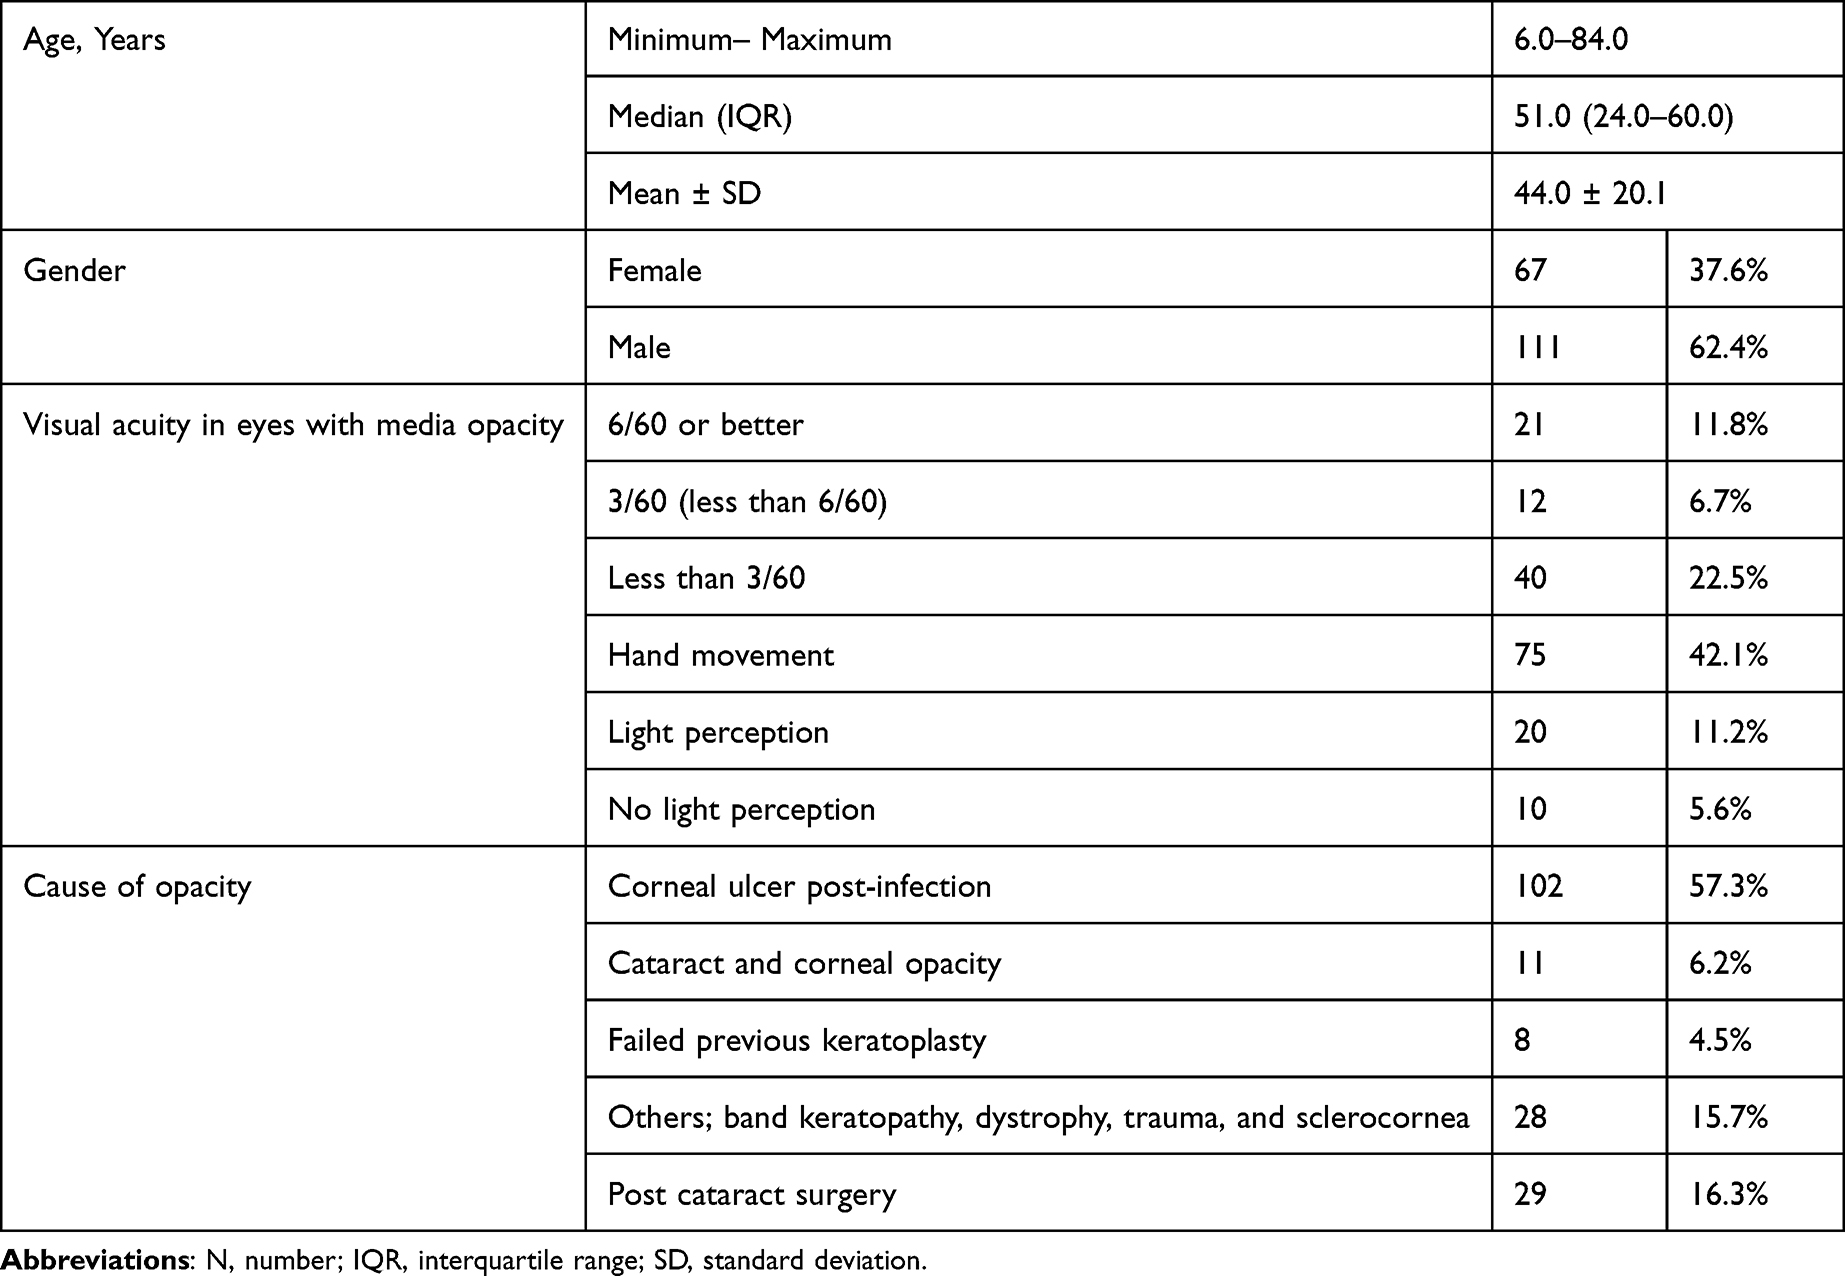 |
Table 1 Characters of the Study Participants (N = 178) |
Table 2 shows the flash VEPs parameters produced at a frequency of 1.4-Hz in both the diseased and normal eyes. In addition, the range and median for the difference between the 2 eyes (normal–abnormal) in each one of the 178 patients are shown. The medians of the overall P2 implicit times were significantly higher in eyes with media opacity than in the normal eyes. Furthermore, the median N2P2 amplitude was 9.70 in with media opacity compared to 11.0 in the normal eye. Analysis of the difference between both eyes (normal–abnormal) regarding P2 implicit time showed a difference range of −49 to 54.7 with a median difference of −3 ms. The difference in amplitudes of recorded N2P2 showed a median of 2.13 µv.
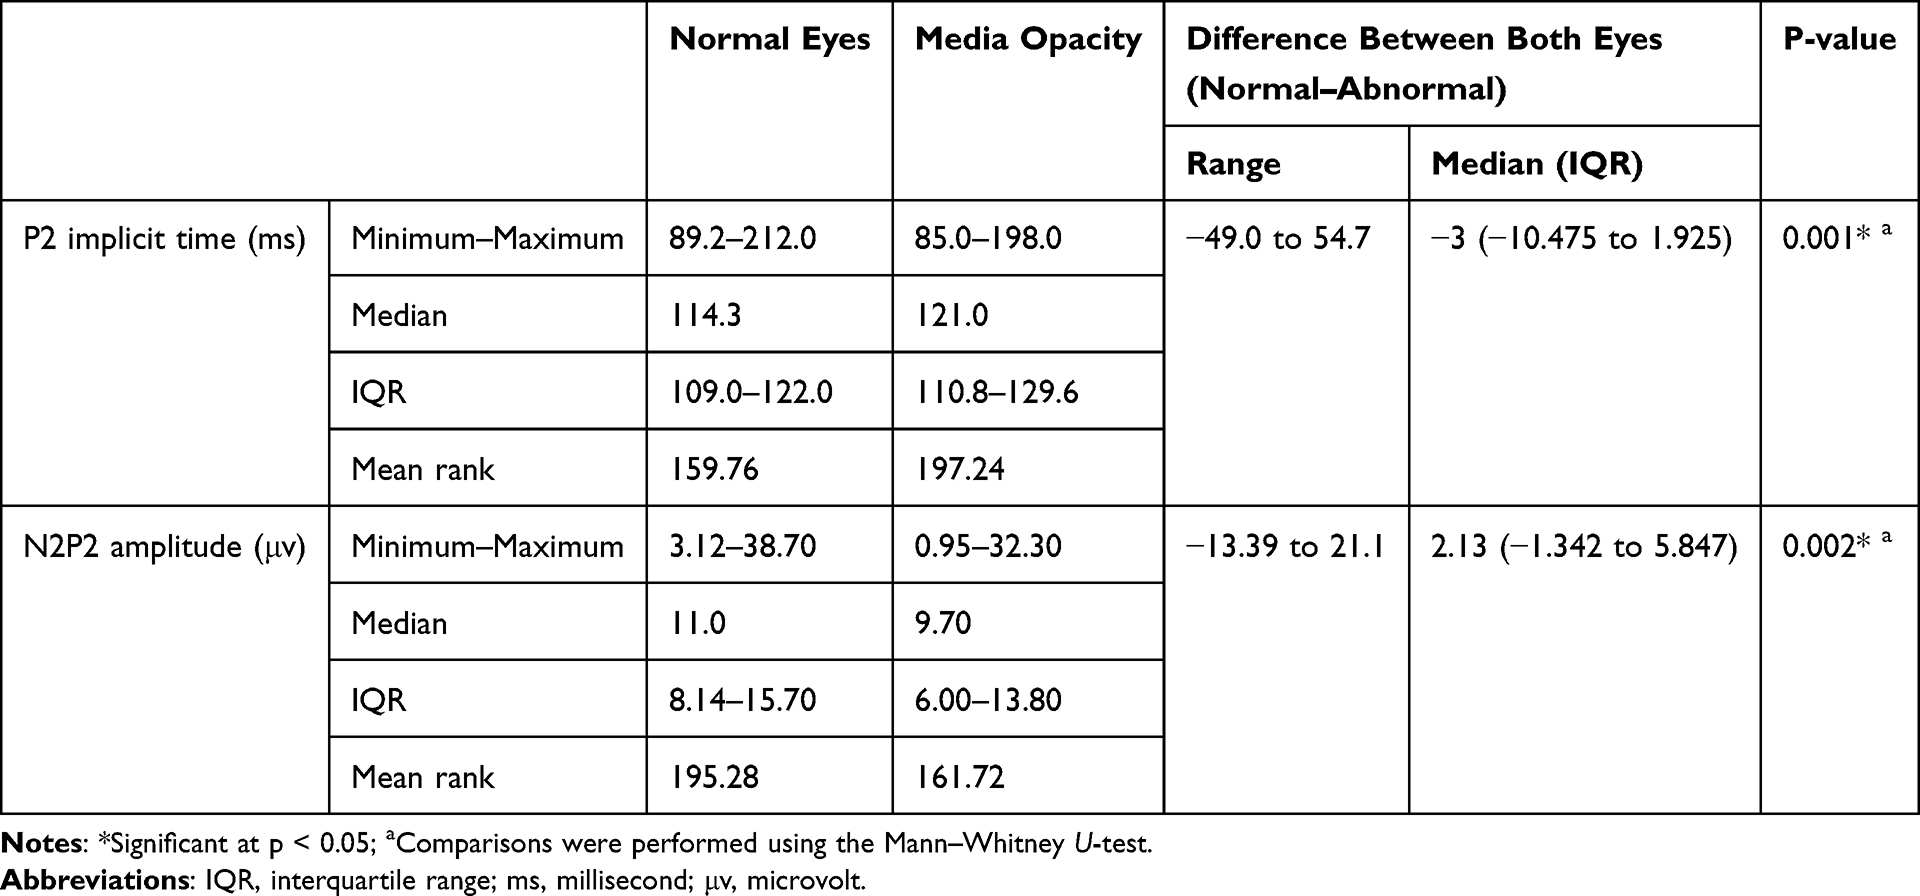 |
Table 2 Comparison Between the Media Opacity and Normal Eyes Regarding the Visual Evoked Potential Parameters Produced by the Frequency 1.4-Hz |
Figure 1 illustrates the difference between the two eyes (normal and abnormal) regarding the implicit time of P2 and amplitude of N2P2.
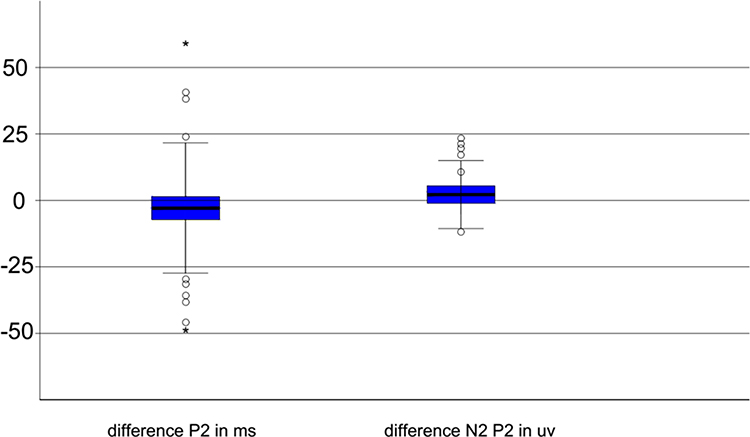 |
Figure 1 Box plots show the distribution of differences between the normal and abnormal eyes as regards the visual evoked potential parameters produced by the frequency 1.4-Hz. The vertical (y-axis) is showing values for (normal eye–abnormal eye) for each patient, in milliseconds (ms) for P2 implicit time and in (microvolts) µv for N2P2 amplitudes (o refers to the outlier values, *Refers to the extremist outlier case). |
We were interested in determining whether there was any correlation between the two eyes and the density of corneal opacities. However, no significant correlation was found using the Spearman correlation. As shown in Table 3 and Figure 2, we found statistically significant but weak negative correlations between values recorded to N2P2 amplitudes (r spearman = −0.173, p = 0.021) in eyes with media opacity and corneal opacity grades. There were no significant correlations between other flash VEP parameters and corneal opacity grades (p > 0.05).
 |
Table 3 Correlation Between the Transient Visual Evoked Potential Parameters and the Grades of Corneal Opacity |
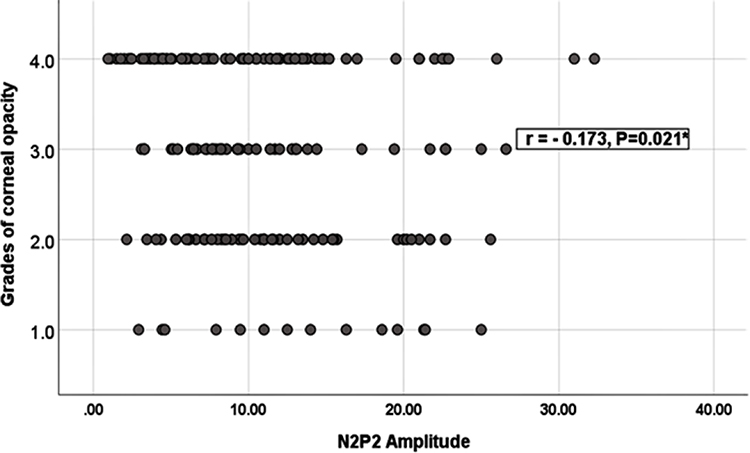 |
Figure 2 Correlation between the N2P2 amplitudes values in diseased eyes and the grades of corneal opacity (r spearman = −0.173, p = 0.021). |
The flash VEP parameters recorded at a frequency of 8-Hz are shown in Table 4. We studied two parameters: the amplitude of the spectral plot at the first harmonic and the SNR in dB. The analysis showed significant differences between eyes with medial opacity and normal eyes (p < 0.05). The spectral plot amplitude also showed a lower median value in diseased eyes than in normal eyes (2.2 versus 2.8). The medians of the signal-to-noise ratio were 18.0 and 21.0 in the diseased and normal eyes, respectively, with a significant difference of 3.0.
 |
Table 4 Comparison Between the Media Opacity and Normal Eyes Regarding the Visual Evoked Potential Parameters Produced by the Frequency 8-Hz |
Figure 3 demonstrates the difference between the two eyes in each case (normal–abnormal) for the 8-Hz parameters. The difference in the spectral plots ranged from (−6 to 11.97) with a median value of 0.435. The range for the signal-to-noise ratio difference was (−17 to 34.3) with a median value of 3.0 dB.
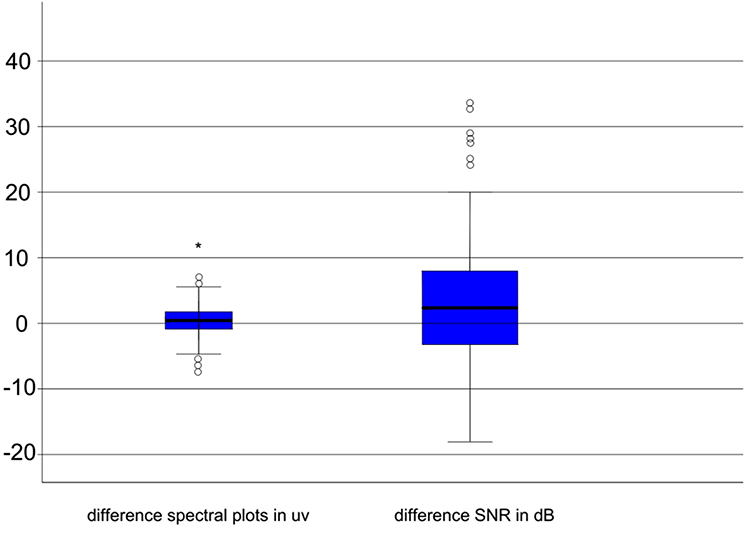 |
Figure 3 Box plots show the distribution of differences between the normal and abnormal eyes as regards the visual evoked potential parameters produced by the frequency 8-Hz. The vertical (y-axis) is showing values for (normal eye–abnormal eye) for each patient, in (microvolts) µv for difference in spectral plots and in decibels (dB) for the difference in signal-to-noise ratio (SNR) (o refers to the outlier values, *Refers to the extremist outlier case). |
With the suspected lower amplitudes and/or higher implicit times as the effect of media opacities in the two frequencies used, we found that parameters may have higher amplitudes or shorter implicit times in a percentage of cases. The signal-to-noise ratio is not always lower for media opacity. We found that 58 of 178 diseased eyes (32.7%) exhibited a higher SNR than the normal eyes (Table 5).
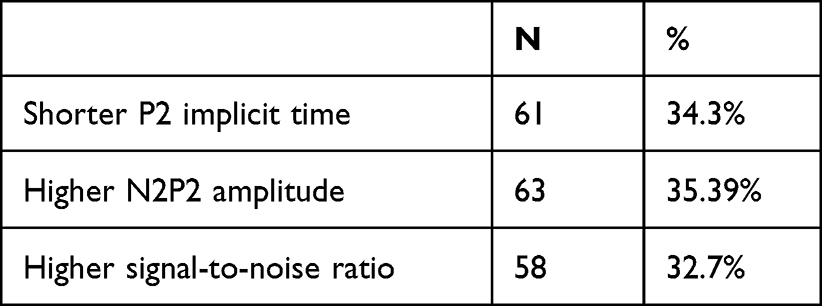 |
Table 5 Frequency of Lesser P2 Implicit Time, Higher N2P2 Amplitudes, and Signal-to-Noise Ratio in the Diseased Eye in Comparison to the Normal Eye |
No correlation was found between the density of the media opacity and the recorded parameters at the 8-Hz frequency as shown in Table 6.
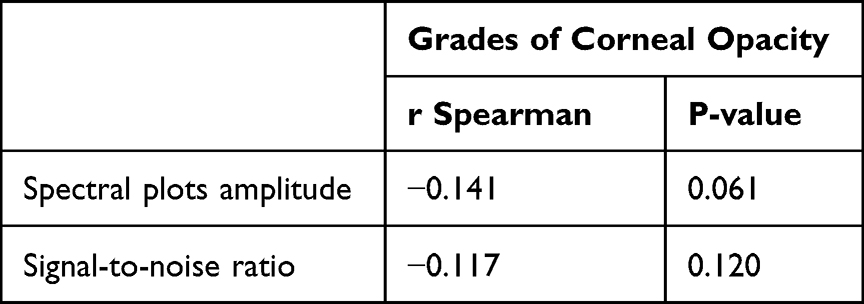 |
Table 6 Correlation Between the Visual Evoked Potential Parameters and the Grades of Corneal Opacity |
Discussion
Adequate preoperative assessment should be performed before long and expensive surgical procedures such as keratoplasty or anterior segment reconstruction. Patients with media opacities and posterior segment disorders, such as optic nerve atrophy or extensive macular atrophy, are not going to gain suspected visual improvement from the surgery and should be counselled as possible.16 Therefore, flash VEPs provide a better understanding of the physiology of neural transmission and are the only suitable objective tool in the assessment of patients with dense media opacities.17
There are various reports of preoperative testing using flash VEP before keratoplasty. Odom et al11 used a 10-Hz flash VEP in candidates for cataract extraction and found an overall accuracy of 76% for the VEP prediction of postoperative visual function.
Cavender et al10 used the same frequency of 10-Hz to predict both visual outcomes and contrast sensitivity. Weinstein in 197712 used a 10-Hz flash frequency in eyes with media opacity and normal eyes. Their evaluation was based on the presence of a smaller wave in the flicker curve, which is relevant to visual prognosis. Wendel et al13 found a strong correlation between flash VEP and postoperative visual acuity, with the ability to predict visual outcomes in 92% of the cases has been reported.
Thuangtong et al18 found that P2 amplitude values equal to or greater than 67% compared to the value of the normal fellow eye had a positive predictive value of 95.65%. However, the study did not report the parameters used to test the flash VEP.
Mańkowski et al2 used the ratio between the P2 wave amplitude in the eye selected for transplantation and the similar parameter amplitude in the fellow eye (P2/P2 ratio). They found a strong positive correlation between the P2/P2 ratio before penetrating keratoplasty and the visual acuity after surgery.
In the present study, we used a wide group of patients with unique testing conditions to compare different flash VEP parameters between an eye with an opaque cornea and a normal eye. This will help determine the range of values and differences between both eyes with relevance to the densities of corneal opacities. This would be valuable in further assessments in cases of bilateral media opacities or in the presence of contralateral diseased or lost eyes, with the use of both transient and flicker flash VEP parameters.
In our study, we analyzed the amplitude of the 8-Hz frequency with quantitative measurements of the spectral plot amplitude and signal-to-noise ratio.
This study also considered the relationship between the grade of corneal opacity and flash VEPs results. There was a statistically significant but weak negative correlation between N2P2 amplitude (p = 0.021) and corneal opacity grade. The observed findings indicate that N2P2 amplitudes in eyes with media opacity were weakly affected by the degree of reduction in light transmission resulting from corneal opacity. This correlation occurred despite the obscured visibility of the fundus view in cases of low opacity owing to the presence of associated cataracts, pupil adhesions, and pigment depositions. Other flash VEP responses showed no significant correlation with the corneal opacity grade. In addition, no correlations were found between the two eyes for any parameter or density of media opacity.
The eyes with media opacity were suspected to show diminution of amplitudes, increase in implicit times, and reduction of signal-to-noise ratio due to the general effect of occluded light transmission. However, we found higher N2P2 amplitudes in eyes with medial opacity. In addition, 60 of 178 diseased eyes (32.7%) exhibited a higher SNR than normal eyes. These findings could be explained by the Ganzfeld effect.8,19 This effect was mentioned in relation to the higher amplitudes in flash ERG recorded from eyes with media opacity owing to the light scattering effect of the opacity.
Previous studies that reported normal values of flash VEP P2 implicit time were similar to the study by Arruda et al.20 They used standards from Odom et al21 to find out that the 95% confidence interval ranged from 136 ms to 152 ms for controls (M = 143.92; SD = 17.13).
However, these previous values were high for our laboratory. Our findings in the normal eyes were as follows: P2, 95% confidence interval, 114.3 ms to 118.7 (M = 116.5, SD = 14.9) in the normal eyes.
In this study, we found a narrower N2P2 amplitude interquartile range (IQR) in the difference between the two eyes (normal and abnormal) (−1.342 to 5.847) than in the implicit time of P2 difference between the two eyes (−10.475 to 1.925) (Table 2). This indicates that the media opacities affect the implicit time more than the amplitudes of main wave P2. This also indicates that higher differences in amplitudes are suggestive of impaired retinocortical transmission.
The signal noise ratio difference between the 2 eyes =3.0 median (−2.0 to 8.475 IQR). This suggests that differences greater than 2 dB between the two eyes are suspicious. Clinical comparison between eyes with normal and media opacity is not always possible, as we are encountering cases presenting with bilateral media opacity with different grades of density, as well as cases with cataract or corneal opacities in their single relatively seeing eyes. Some information may help in cases of diseased or lost contralateral eye. For example, the IQR for SNR values in normal eyes was 16.0–25.0, while in media opacity eyes it was 12.0–22.0 (Table 3). Therefore, SNR values <12 in the unseen fundus may indicate suspicious retinocortical transmission.
IQR for N2P2 amplitudes of transient VEP was 8.14–15.70 in normal eyes, while in media opacities, it was 6.00–13.80 (Table 2). This indicates that amplitudes lower than 6 µV indicate a suspicious retinocortical transmission. The same amplitude was mentioned in studies by Fuller and Hutton22 and Sobaci et al23 with the use of flicker frequencies of flash VEP in severely injured bilateral eyes.
Strengths and Limitations
Compared to earlier reports, this study has the advantage of a considerably larger sample size, which increases the precision and power of the results. However, it is limited by a lack of postoperative follow-up and evaluation of the visual acuity postoperatively to determine the predictive power of the preoperative flash VEPs. Another limitation is the absence of objective tools for the measurement to the overall opacity density, whether corneal alone or corneal and added different grades of cataract as a cause of media opacity. However, the current research work paves the way for further studies to be correlated with our findings. The interest is raising from the importance of preoperative functional assessment of media opacity eyes prior to costly procedures like the keratoplasty or keratoprosthesis surgeries. Also, the study finds out the averages and medians in overall eyes with media opacities in comparison to the normal eyes. This would be of value in the assessment of diseased single eyes or in the presence of bilateral ocular disease with recommended counselling to patients preoperatively.
Conclusion
Preoperative flash VEP recording is useful for evaluating visual function in patients with unilateral corneal opacity, to aid in counselling patients as much as possible. Eyes with media opacity showed significantly longer peak implicit P2 times and lower N2P2 amplitudes, in addition to a significant reduction in the flicker VEP spectral plot amplitude and signal-to-noise ratio parameters compared to fellow normal eyes. A weak negative and statistically significant correlations were detected between N2P2 amplitude and corneal opacity grade. There were no significant correlations between the other flash VEP parameters or the difference between the two eyes and the corneal opacity grades (p > 0.05). We found some parameters to be unexpectedly better recorded (less implicit time or higher amplitudes) from the diseased eyes in approximately 30% of the cases. Lower amplitudes than 6 µv are indicating affected retinocortical transmission, especially when the assessment of the contralateral eye is not possible. Also, the knowledge about median values in media opacity eyes may be of value in the assessment if we encounter single eyed cases or bilaterally abnormal eyes.
Disclosure
The authors report no conflicts of interest in this work.
References
1. Wilson SE, Sampaio LP, Shiju TM, Hilgert GSL, de Oliveira RC. Corneal opacity: cell biological determinants of the transition from transparency to transient haze to scarring fibrosis, and resolution, after injury. Invest Ophthalmol Vis Sci. 2022;63(1):22. doi:10.1167/iovs.63.1.22
2. Mańkowski W, Wylęgała A, Wylęgała E. Assessment of visual evoked potentials in patients eligible for penetrating keratoplasty. Medicine. 2018;97(9):e9861. doi:10.1097/MD.0000000000009861
3. Parrey MUR, Bhatti MO, Channa S, Alswailmi FK. Posterior segment eye diseases detected by B-scan ultrasonography in advanced cataract. Indo Am JP Sci. 2019;6(6):11261–11266.
4. Ahmed M, Lee CS, McMillan B, et al. Predicting visual function after an ocular bee sting. Int Ophthalmol. 2019;39(7):1621–1626. doi:10.1007/s10792-018-0978-z
5. McKeague M, Sharma P, Ho AC. Evaluation of the macula prior to cataract surgery. Cur Opin Ophthalmol. 2018;29(1):4–8. doi:10.1097/ICU.0000000000000432
6. Robson AG, Nilsson J, Li S, et al. ISCEV guide to visual electrodiagnostic procedures. Doc Ophthalmol Adv Ophthalmol. 2018;136(1):1–26. doi:10.1007/s10633-017-9621-y
7. Ström L, Bröjer J, Ekesten B. Variability, repeatability and test-retest reliability of equine flash visual evoked potentials (FVEPs). BMC Vet Res. 2020;16(1):261. doi:10.1186/s12917-020-02463-8
8. Galloway NR. Electrophysiological testing of eyes with opaque media. Eye. 1988;2(Pt 6):615–624. doi:10.1038/eye.1988.114
9. Pojda-Wilczek D, Maruszczyk W, Sirek S. Flash visual evoked potentials (FVEP) in various stimulation conditions. Doc Ophthalmol Adv Ophthalmol. 2019;138(1):35–42. doi:10.1007/s10633-018-9663-9
10. Cavender SA, Hobson RR, Chao GM, Weinstein GW, Odom JV. Comparison of preoperative 10-Hz visual evoked potentials to contrast sensitivity and visual acuity after cataract extraction. Doc Ophthalmol. 1992;81(2):181–188. doi:10.1007/BF00156007
11. Odom JV, Hobson R, Coldren JT, Chao GM, Weinstein GW. 10-Hz flash visual evoked potentials predict post-cataract extraction visual acuity. Doc Ophthalmol Adv Ophthalmol. 1987;66(4):291–299. doi:10.1007/BF00213657
12. Weinstein GW. Clinical aspects of the visually evoked potential. Trans Am Ophthalmol Soc. 1977;75:627–673.
13. Wendel RT, Mannis MJ, Keltner JL. Role of electrophysiologic testing in the preoperative evaluation of corneal transplant patients. Ann Ophthalmol. 1984;16(8):788–793.
14. Roper-Hall MJ. Thermal and chemical burns. Trans Ophthalmol Soc U K. 1965;85:631–653.
15. Odom JV, Bach M, Brigell M, et al. ISCEV standard for clinical visual evoked potentials: (2016 update). Doc Ophthalmol Adv Ophthalmol. 2016;133(1):1–9. doi:10.1007/s10633-016-9553-y
16. Vanathi M, Raj N, Kusumesh R, Aron N, Gupta N, Tandon R. Update on pediatric corneal diseases and keratoplasty. Surv Ophthalmol. 2022;67(6):1647–1684. doi:10.1016/j.survophthal.2022.07.010
17. Hassan N, Wahdan MAE. Electroretinography and visual-evoked potential changes in patients with nystagmus. Al-Azhar Assiut Med J. 2021;19(3):386.
18. Thuangtong A, Samsen P, Ruangvaravate N, Supiyaphun C. Visual prognostic value of ocular electrophysiology tests in corneal transplantation. J Med Assoc Thai. 2012;95(Suppl 4):S50–S55.
19. Mikawa T, Tamura O. Relation between the electroretinogram and post operation vision in cataract. Jpn J Clin Ophthalmol. 1970;24:43–46.
20. Arruda JE, McInnis MC, Steele J. The flash visual evoked potential-P2 and the detection of amnestic mild cognitive impairment: a review of empirical literature. Int J Psychophysiol. 2020;155:162–167. doi:10.1016/j.ijpsycho.2020.05.012
21. Odom JV, Bach M, Barber C, et al. Visual evoked potentials standard (2004). Doc Ophthalmol Adv Ophthalmol. 2004;108(2):115–123. doi:10.1023/B:DOOP.0000036790.67234.22
22. Fuller DG, Hutton WL. Prediction of postoperative vision in eyes with severe trauma. Retina. 1990;10 Suppl 1:S20–S34. doi:10.1097/00006982-199010001-00005
23. Sobaci G, Mutlu FM, Söyler M, Tatar T, Yildirim E. Using flash visually evoked potential in predicting final visual acuity in severely injured eyes. Ann Ophthalmol. 2000;32(1):63–65. doi:10.1007/s12009-000-0015-4
 © 2023 The Author(s). This work is published and licensed by Dove Medical Press Limited. The
full terms of this license are available at https://www.dovepress.com/terms
and incorporate the Creative Commons Attribution
- Non Commercial (unported, 3.0) License.
By accessing the work you hereby accept the Terms. Non-commercial uses of the work are permitted
without any further permission from Dove Medical Press Limited, provided the work is properly
attributed. For permission for commercial use of this work, please see paragraphs 4.2 and 5 of our Terms.
© 2023 The Author(s). This work is published and licensed by Dove Medical Press Limited. The
full terms of this license are available at https://www.dovepress.com/terms
and incorporate the Creative Commons Attribution
- Non Commercial (unported, 3.0) License.
By accessing the work you hereby accept the Terms. Non-commercial uses of the work are permitted
without any further permission from Dove Medical Press Limited, provided the work is properly
attributed. For permission for commercial use of this work, please see paragraphs 4.2 and 5 of our Terms.