Back to Journals » Diabetes, Metabolic Syndrome and Obesity » Volume 15
Changes in the Expression of Insulin Pathway, Neutrophil Elastase and Alpha 1 Antitrypsin Genes from Leukocytes of Young Individuals with Insulin Resistance
Authors Cruz-Pineda WD, Garibay-Cerdenares OL, Rodríguez-Ruíz HA, Matia-García I ![]() , Marino-Ortega LA
, Marino-Ortega LA ![]() , Espinoza-Rojo M, Reyes-Castillo Z, Castro-Alarcón N
, Espinoza-Rojo M, Reyes-Castillo Z, Castro-Alarcón N ![]() , Castañeda-Saucedo E, Illades-Aguiar B, Parra-Rojas I
, Castañeda-Saucedo E, Illades-Aguiar B, Parra-Rojas I ![]()
Received 17 February 2022
Accepted for publication 19 May 2022
Published 18 June 2022 Volume 2022:15 Pages 1865—1876
DOI https://doi.org/10.2147/DMSO.S362881
Checked for plagiarism Yes
Review by Single anonymous peer review
Peer reviewer comments 2
Editor who approved publication: Prof. Dr. Antonio Brunetti
Walter David Cruz-Pineda,1 Olga Lilia Garibay-Cerdenares,2,3 Hugo Alberto Rodríguez-Ruíz,1,3 Inés Matia-García,1 Linda Anahí Marino-Ortega,1 Mónica Espinoza-Rojo,4 Zyanya Reyes-Castillo,5 Natividad Castro-Alarcón,6 Eduardo Castañeda-Saucedo,7 Berenice Illades-Aguiar,3 Isela Parra-Rojas1
1Laboratorio de Investigación en Obesidad y Diabetes, Facultad de Ciencias Químico-Biológicas, Universidad Autónoma de Guerrero, Chilpancingo, Guerrero, México; 2CONACyT-Universidad Autónoma de Guerrero, Chilpancingo, Guerrero, México; 3Laboratorio de Biomedicina Molecular, Facultad de Ciencias Químico-Biológicas, Universidad Autónoma de Guerrero, Chilpancingo, Guerrero, México; 4Laboratorio de Biología Molecular y Genómica, Facultad de Ciencias Químico-Biológicas, Universidad Autónoma de Guerrero, Chilpancingo, Guerrero, México; 5Instituto de Investigaciones en Comportamiento Alimentario y Nutrición, Centro Universitario del Sur, Universidad de Guadalajara, Ciudad Guzmán, Jalisco, México; 6Laboratorio de Investigación en Microbiología, Facultad de Ciencias Químico-Biológicas, Universidad Autónoma de Guerrero, Chilpancingo, Guerrero, México; 7Laboratorio de Investigación en Biología Celular del Cáncer, Facultad de Ciencias Químico-Biológicas, Universidad Autónoma de Guerrero, Chilpancingo, Guerrero, México
Correspondence: Isela Parra-Rojas, Laboratorio de Investigación en Obesidad y Diabetes, Facultad de Ciencias Químico Biológicas, Universidad Autónoma de Guerrero, Avenida Lázaro Cárdenas S/N, Ciudad Universitaria, Chilpancingo, Guerrero, CP 39090, México, Tel/Fax +52 7474719310, Email [email protected] Olga Lilia Garibay-Cerdenares, CONACyT-Universidad Autónoma de Guerrero, Avenida Lázaro Cárdenas S/N, Ciudad Universitaria, Chilpancingo, Guerrero, CP 39090, México, Tel/Fax +52 7474710901, Email [email protected]
Background: Chronic hyperinsulinemia is a hallmark of insulin resistance that affects a diversity of cells, including leukocytes modifying the expression of some genes involved in insulin signaling.
Purpose: The aim of this study was to evaluate how hyperinsulinemia affects the expression of genes involved in the proximal insulin signaling pathway in leukocytes from 45 young individuals grouped: normal weight with not insulin resistance (NIR), with insulin resistance (IR) and with obesity (OB-IR).
Methods: qPCR was performed to analyze the expression of insulin receptor (INSR), insulin receptor substrate 1 and 2 (IRS-1 and IRS-2), neutrophil elastase (NE), alpha 1 antitrypsin (A1AT), glucose transporters 1, 3 and 4 (GLUT-1, GLUT-3 and GLUT-4) by the 2−ΔCt method, and the correlation between the genes was determined by Spearman’s test.
Results: The mRNA expression analysis of all genes between NIR and IR individuals revealed no differences. However, when comparing NIR and IR individuals with OB-IR, an increase in NE and A1AT expression and a clear trend towards a decrease in IRS-2 expression was observed, whereas the comparison of IR and OB-IR showed a decrease in GLUT-3 expression. Overall, the correlation analysis showed that in the IR group there was a positive correlation only between NE with IRS-1 (r = 0.72, p = 0.003), while in the OB-IR group, there was a positive correlation between the NE and A1AT with INSR (r = 0.62, p = 0.01 and r = 0.74, p = 0.002, respectively) and with IRS-2 (r = 0.74, p = 0.002 and r = 0.76, p = 0.001, respectively).
Conclusion: These results suggest that hyperinsulinemia and obesity are associated with changes in the expression of genes in leukocytes involved in the insulin pathway that are related to NE and A1AT.
Keywords: insulin resistance, obesity, insulin signaling, leukocytes, neutrophil elastase, alpha 1 antitrypsin
Introduction
Insulin resistance is a condition in which cells, especially those of insulin-dependent metabolic tissues, cease to respond to the physiological stimuli of insulin.1 It is considered a condition that is associated with type 2 diabetes,2 obesity,3,4 and nonalcoholic hepatic steatosis,5 among others, and the hallmark metabolic alteration is hyperinsulinemia.6 The causes of insulin resistance are diverse and include inflammation,7 oxidative stress,8 and lipotoxicity.9,10 Insulin resistance is an important pathophysiological mechanism in the development of metabolic syndrome, which includes cardiometabolic alterations such as central obesity, hypertension, and dyslipidemia, and affects approximately one-quarter of the world population.11 More than 80 million people in the United States alone are affected,12,13 and in Mexico, a prevalence of 41% has been reported.14 Furthermore, insulin resistance is considered to be a factor that increases the risk of developing type 2 diabetes.15,16
Obesity is the predominant disease associated with insulin resistance,17 as the frequency of this condition in individuals with obesity is as high as 76%.18 In addition, at least two phenotypes have been identified: metabolically healthy individuals with obesity who have a high body mass index (BMI) (BMI ≥30 kg/m2) but lack metabolic syndrome and show insulin sensitivity19 and normal weight individuals who have a normal BMI (BMI <25 kg/m2) but present with a metabolism associated with obesity and insulin resistance.20 The prevalence of insulin resistance in normal weight individuals is 16 to 46.5%,18,21 and the molecular mechanisms involved in the development of this condition are not fully understood.
Insulin is produced by pancreatic β-cells, and it is the hormone critical for stimulating plasma glucose uptake in adipose and muscle tissue22 and leukocytes23,24 and suppresses endogenous glucose production in the liver.1 The signaling pathway is initiated when insulin binds to its receptor and induces signaling through adaptor proteins such as Src homology and collagen (Shc) and insulin receptor substrates (IRS), which are both crucial for regulating mitogenic processes and glucose uptake.25 The IRS-1 and IRS-2 isoforms are the main proteins that transmit signals in cells to coordinate glucose homeostasis. However, although they are homologous, these isoforms have distinct and, in some cases, complementary functions, and they are both regulated in a tissue-dependent manner.26 Insulin resistance can be induced by aberrant IRS degradation through the involvement of neutrophil elastase (NE), a serine protease stored in leukocyte azurophilic granules, which is released, in response to inflammation, into the extracellular space where it has immunomodulatory and tissue remodeling effects.27
The effects of NE are intrinsically regulated by its main inhibitor, alpha 1 antitrypsin (A1AT),28 which is an acute-phase protein synthesized mainly in the liver; however, leukocytes also synthesize A1AT through a mechanism of local regulation of inflammation.29
Insulin resistance impacts leukocytes, among other cells, by affecting their glucose uptake as well as their metabolism. This influence leads to the deterioration of their functions, which is associated with the development of other chronic degenerative complications, such as metabolic syndrome and cardiovascular diseases.30–32
The final result of the insulin signaling pathway in glucose uptake is the mobilization of GLUT transporters to the membrane: GLUT-1 is a transporter considered to be independent of insulin signaling,33 whereas the main insulin-dependent transporter is GLUT-4,34 although insulin has also been shown to promote GLUT-3 translocation.35
Insulin exerts a regulatory role on the abundance and post-translational modifications of proteins,36 however, it also shows effects on the regulation of gene expression of proteins involved in its signaling pathway on classical target cells (hepatic, muscle and adipose), as well as in other tissues that are not commonly associated with metabolic functions.37,38
Dysregulation in the abundance of NE and A1AT proteins is implicated in processes such as inflammation, development of obesity and hepatic steatosis, in addition to the fact that NE has direct proteolytic activity on IRS-1 and IRS-2 when its abundance is higher than that of A1AT, leading to insulin resistance.39,40 However, it has not been explored whether insulin resistance by itself induces changes in the gene expression of molecules involved in the proximal insulin signaling pathway in leukocytes, especially in those individuals with hyperinsulinemia with normal weight or obesity. Therefore, the aim of this study was to analyze the expression of these genes and to detect changes among young individuals with normal weight or obesity who present insulin resistance. This work is shown the changes in the expression of these genes and their association with NE and A1AT expression, indicating a probable relationship with the insulin signaling pathway.
Materials and Methods
Individuals
A total of 45 unrelated individuals (14 males and 31 females) in an age range of 18 to 26 years were included and assigned to three groups: 15 with normal weight (BMI ≤24.9 kg/m2) without insulin resistance (HOMA-IR <3.2) termed the NIR group; 15 with normal weight (BMI ≤24.9 kg/m2) with insulin resistance (HOMA-IR ≥3.2) termed the IR group; and 15 with obesity (BMI ≥ 30 kg/m2) and with insulin resistance (HOMA-IR ≥3.2) termed the OB-IR group. All participants are originally from the State of Guerrero, Mexico. Individuals with signs of infectious disease or receiving any treatment that might influence biochemical or hematological parameters (previous diagnosis of diabetes, pregnant women, polycystic ovary syndrome, liver or kidney disease) were excluded from the study. Written informed consent was obtained from all the participants according to the ethical guidelines of the Declaration of Helsinki 2008, and the study was approved by the Research Ethics Committee of the Autonomous University of Guerrero.
Clinical and Anthropometric Measurements
Weight, BMI and fat mass were determined with a body composition analyzer (Tanita BC-553, Arlington, USA) with participants wearing lightweight clothing and wearing no shoes. Body circumferences were measured with anthropometric tape (Seca, Hamburg, Germany). Assignment of participants into the normal weight and obesity groups was made based on a BMI ≤24.9 kg/m2 for the normal weight group and a BMI ≥ 30 kg/m2 for the obesity group. Blood pressure was measured by placing the individual seated in a chair with support using a blood pressure monitor (HEM-7120, Omron Healthcare Inc, Hoffman Estates, IL, USA) on the left arm after a 10-minute rest. Systolic blood pressure (SBP) and diastolic blood pressure (DBP) were the mean of two readings, and they were taken at least 10 minutes apart.
Laboratory Measurements
A 5 mL blood sample was obtained from each participant by antecubital venipuncture under fasting conditions. Serum glucose, cholesterol, triglycerides, HDL-C and LDL-C levels were analyzed with semiautomatic equipment (Mindray BS-200, Shenzhen, China) using commercially available kits (Spinreact, Barcelona, Spain), and insulin levels were measured by enzyme-linked immunosorbent assay (GenWay INS-EASIA kit). To determine insulin resistance, a homeostasis model assessment (HOMA-IR) was performed according to the protocol described by Matthews et al 1985, using the formula: fasting serum insulin (μU/mL) × fasting plasma glucose (mmol/L)/22.5.41 Insulin resistance was defined as a HOMA-IR value equal to or above the 90th percentile (≥3.2) as the cutoff value, obtained from analysis of apparently healthy individuals with normal weight and serum glucose levels.
Gene Expression Analysis
Total RNA extraction was performed with leukocytes isolated from peripheral blood with TRIzol reagent (Thermo Fisher Scientific, Waltham, MA, USA) and according to the method of Chomczynski and Sacchi.42 Synthesis of cDNA was performed using 1 µg of RNA with a commercial kit following the manufacturer’s specifications (Promega Corporation, USA) and stored at −80°C until use. Gene expression analysis was performed by real-time PCR. NE (ELANE, Hs00236952_m1), A1AT (SERPINA1, Hs00165475_m1), INSR (Hs00961558_m1), IRS-1 (Hs00178563_m1), IRS-2 (Hs00275843_s1), GLUT-1 (SLC2A1, Hs00892681_m1), GLUT-3 (SLC2A3, Hs00359840_m1) and GLUT-4 (SLC2A4, Hs0016168966_m1) levels were analyzed in duplicate using TaqMan probes (Thermo Fisher Scientific, Waltham, MA, USA) according to the manufacturer’s instructions with a CFX96 Touch Real-Time PCR Detection System Analyzer (BIO-RAD, California, USA). Relative expression of each gene was performed using the 2−ΔCt method, and the endogenous β-actin (ACTB, Hs03023943_g1) was used as a reference. To validate the absence of GLUT-4 gene expression in the leukocytes of the individuals analyzed, human adipose tissue was used as the positive control.
Statistical Analysis
The analysis was performed with STATA (V.9.2) and GraphPad Prism 5 software. Differences in variables between groups were evaluated by Fisher’s exact test, ANOVA or Kruskal–Wallis according to the distribution of the data. Post hoc analysis between groups was done using the Tukey or Dunn test, as appropriate. To evaluate the association between genes in the insulin signaling pathway, NE and A1AT, Spearman’s correlation test was performed. Values of p < 0.05 were considered significant.
Results
Characteristics of the Study Population
A total of 45 nondiabetic, nonhypertensive, apparently healthy individuals participated in the study. The clinical and anthropometric characteristics of the NIR, IR and OB-IR groups are summarized in Table 1. The age range was 18–26 years, and differences were observed between groups with respect to weight, BMI, fat mass, waist circumference, hip circumference, insulin and HOMA-IR (p<0.001) as well as in age, waist-to-hip ratio (WHR), systolic blood pressure (SBP), diastolic blood pressure (DBP), cholesterol and triglyceride levels (p<0.05). The post hoc analysis confirms the differences between the OB-IR group with respect to NIR and between the IR and OB-IR groups.
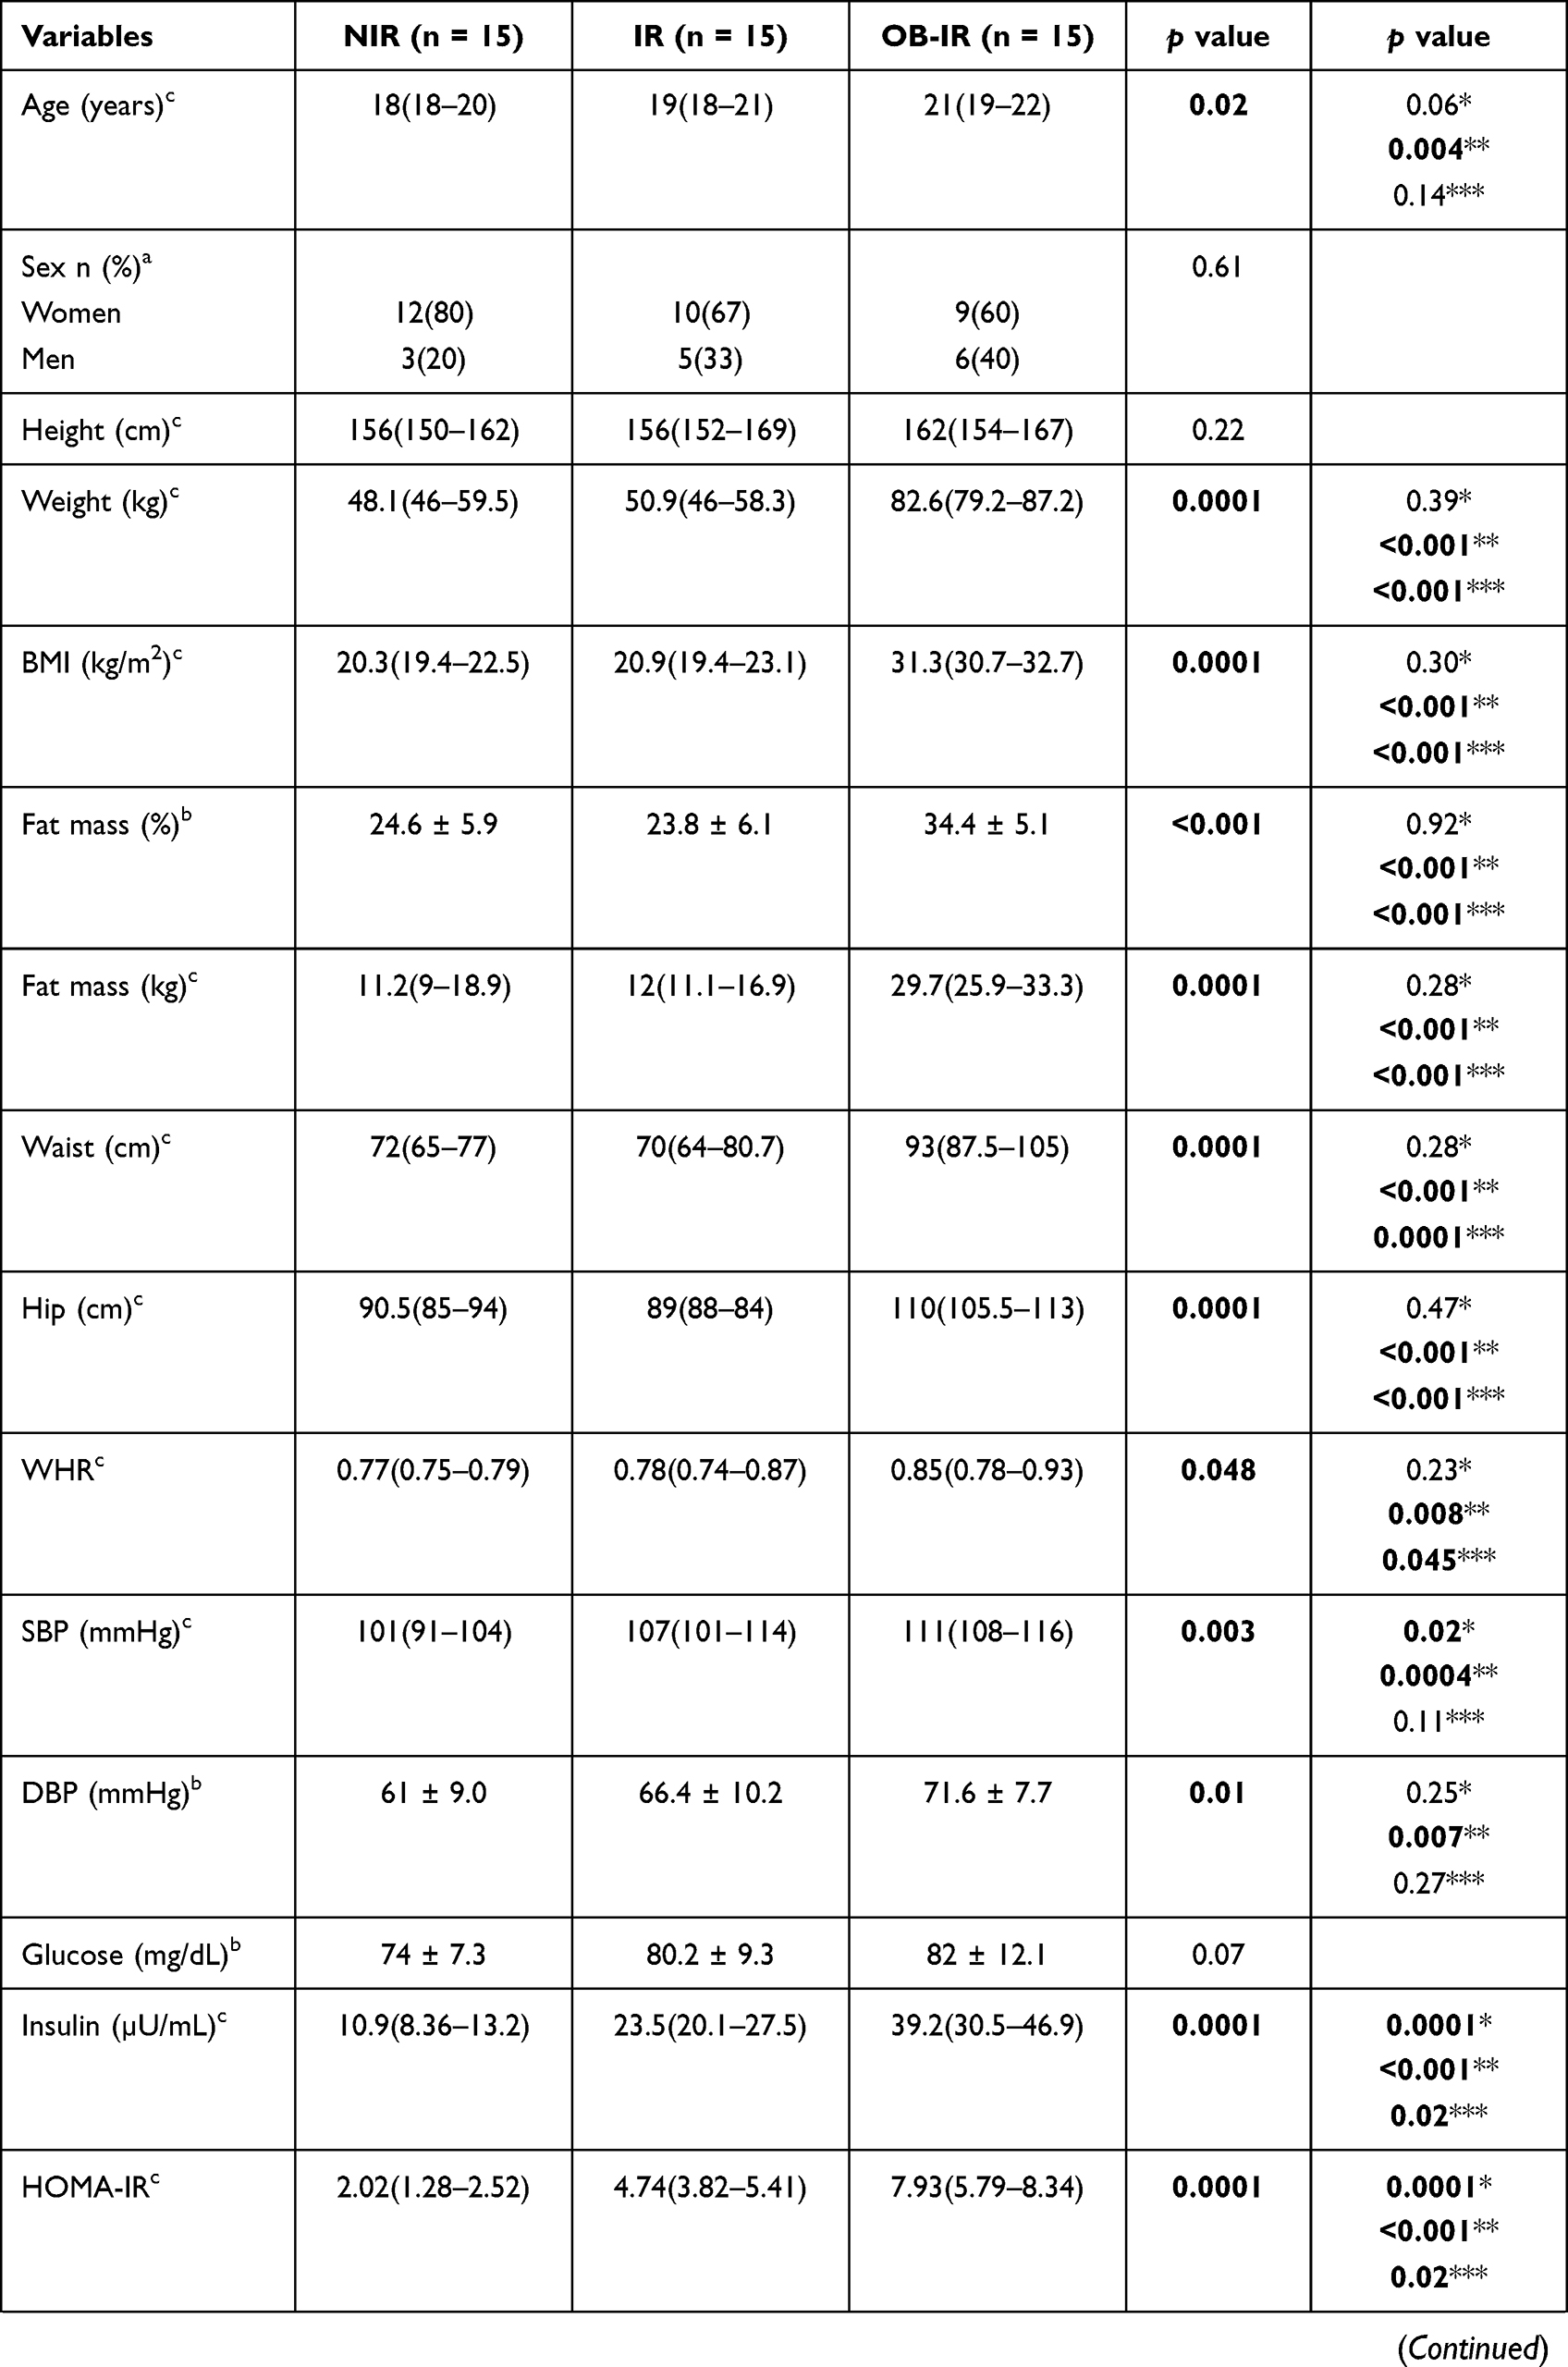 |  | 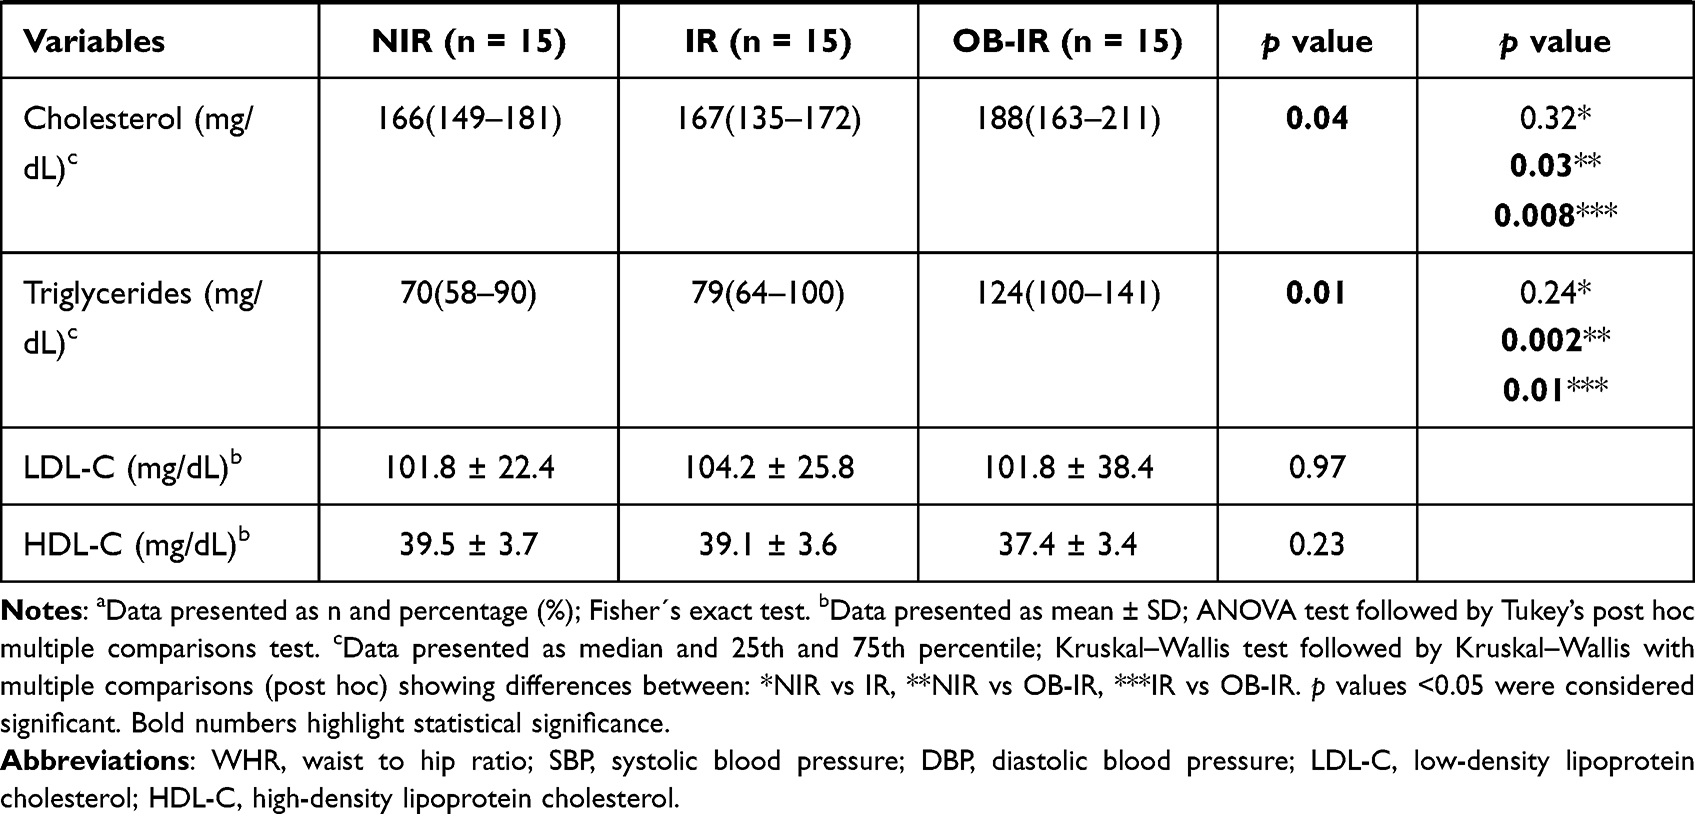 |
Table 1 Anthropometric and Biochemical Parameters by Study Group |
Hyperinsulinemia Induces Changes in the Expression of Genes Involved in the Insulin Signaling Pathway in IR and OB-IR Individuals
The expression of genes involved in the insulin signaling pathway, NE and A1AT was analyzed in leukocytes. Figure 1 shows the mRNA expression levels of each gene in the study groups. For insulin receptor (INSR), a low mRNA expression level was observed in the IR and OB-IR groups, but differences were observed only between the OB-IR and NIR groups (p = 0.0440). The mRNA expression of IRS-1 was lower in the IR group, and mRNA expression of IRS-2 was decreased in the IR and OB-IR groups. However, a comparison among groups did not reveal significant differences in the mRNA expression of either IRS isoform. In the OB-IR group, mRNA expression of NE was significantly higher than that in the NIR (p = 0.0314) and IR (p = 0.0391) groups, similar results were observed for mRNA expression of A1AT with NIR (p = 0.0012) and IR (p = 0.0045) groups. Finally, mRNA expression of GLUT-1 did not differ in any of the groups; however, mRNA expression of GLUT-3 was significantly decreased in the OB-IR group compared to the IR group (p = 0.0432). Interestingly, GLUT-4 was not expressed in the leukocytes in the three groups studied.
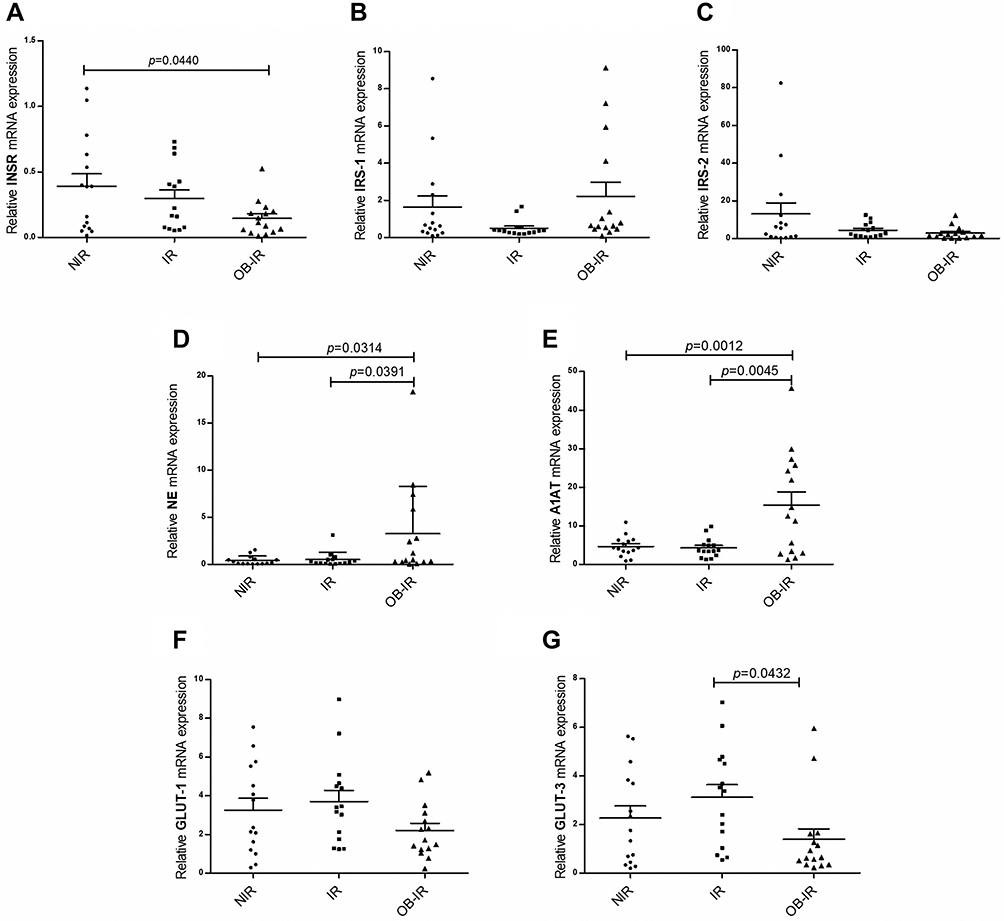 |
Figure 1 Relative expression of genes of the insulin signaling pathway, NE and A1AT. Relative mRNA expression of INSR (A), IRS-1 (B), IRS-2 (C), NE (D), A1AT (E), GLUT-1 (F) and GLUT-3 (G) genes. The analysis was performed using the 2−ΔCt method and β-actin as reference gene. The p value was calculated using ANOVA and Tukey’s tests. |
The NE and A1AT Gene Expression Correlates with the Insulin Signaling Pathway
Table 2 shows an overall and between-group correlation analysis of the expression levels of certain genes involved in the insulin signaling pathway in leukocytes. For all individuals, there was a correlation between NE and IRS-1 (r = 0.43; p = 0.003), whereas A1AT correlated with INSR (r = 0.31; p = 0.04) and IRS-2 (r = 0.31; p = 0.04). When performing a correlation analysis by group, NIR showed a correlation between A1AT and IRS-1 (r = 0.80; p = 0.0003). For the IR group, a correlation between NE and IRS-1 (r = 0.72; p = 0.003) was found. In the OB-IR group, correlations of NE and A1AT (r = 0.80; p = 0.0003), both NE and A1AT with INSR (r = 0.62; p = 0.01, r = 0.74; p = 0.002, respectively); and with IRS-2 (r = 0.74; p = 0.002, r = 0.76; p = 0.001, respectively) were found.
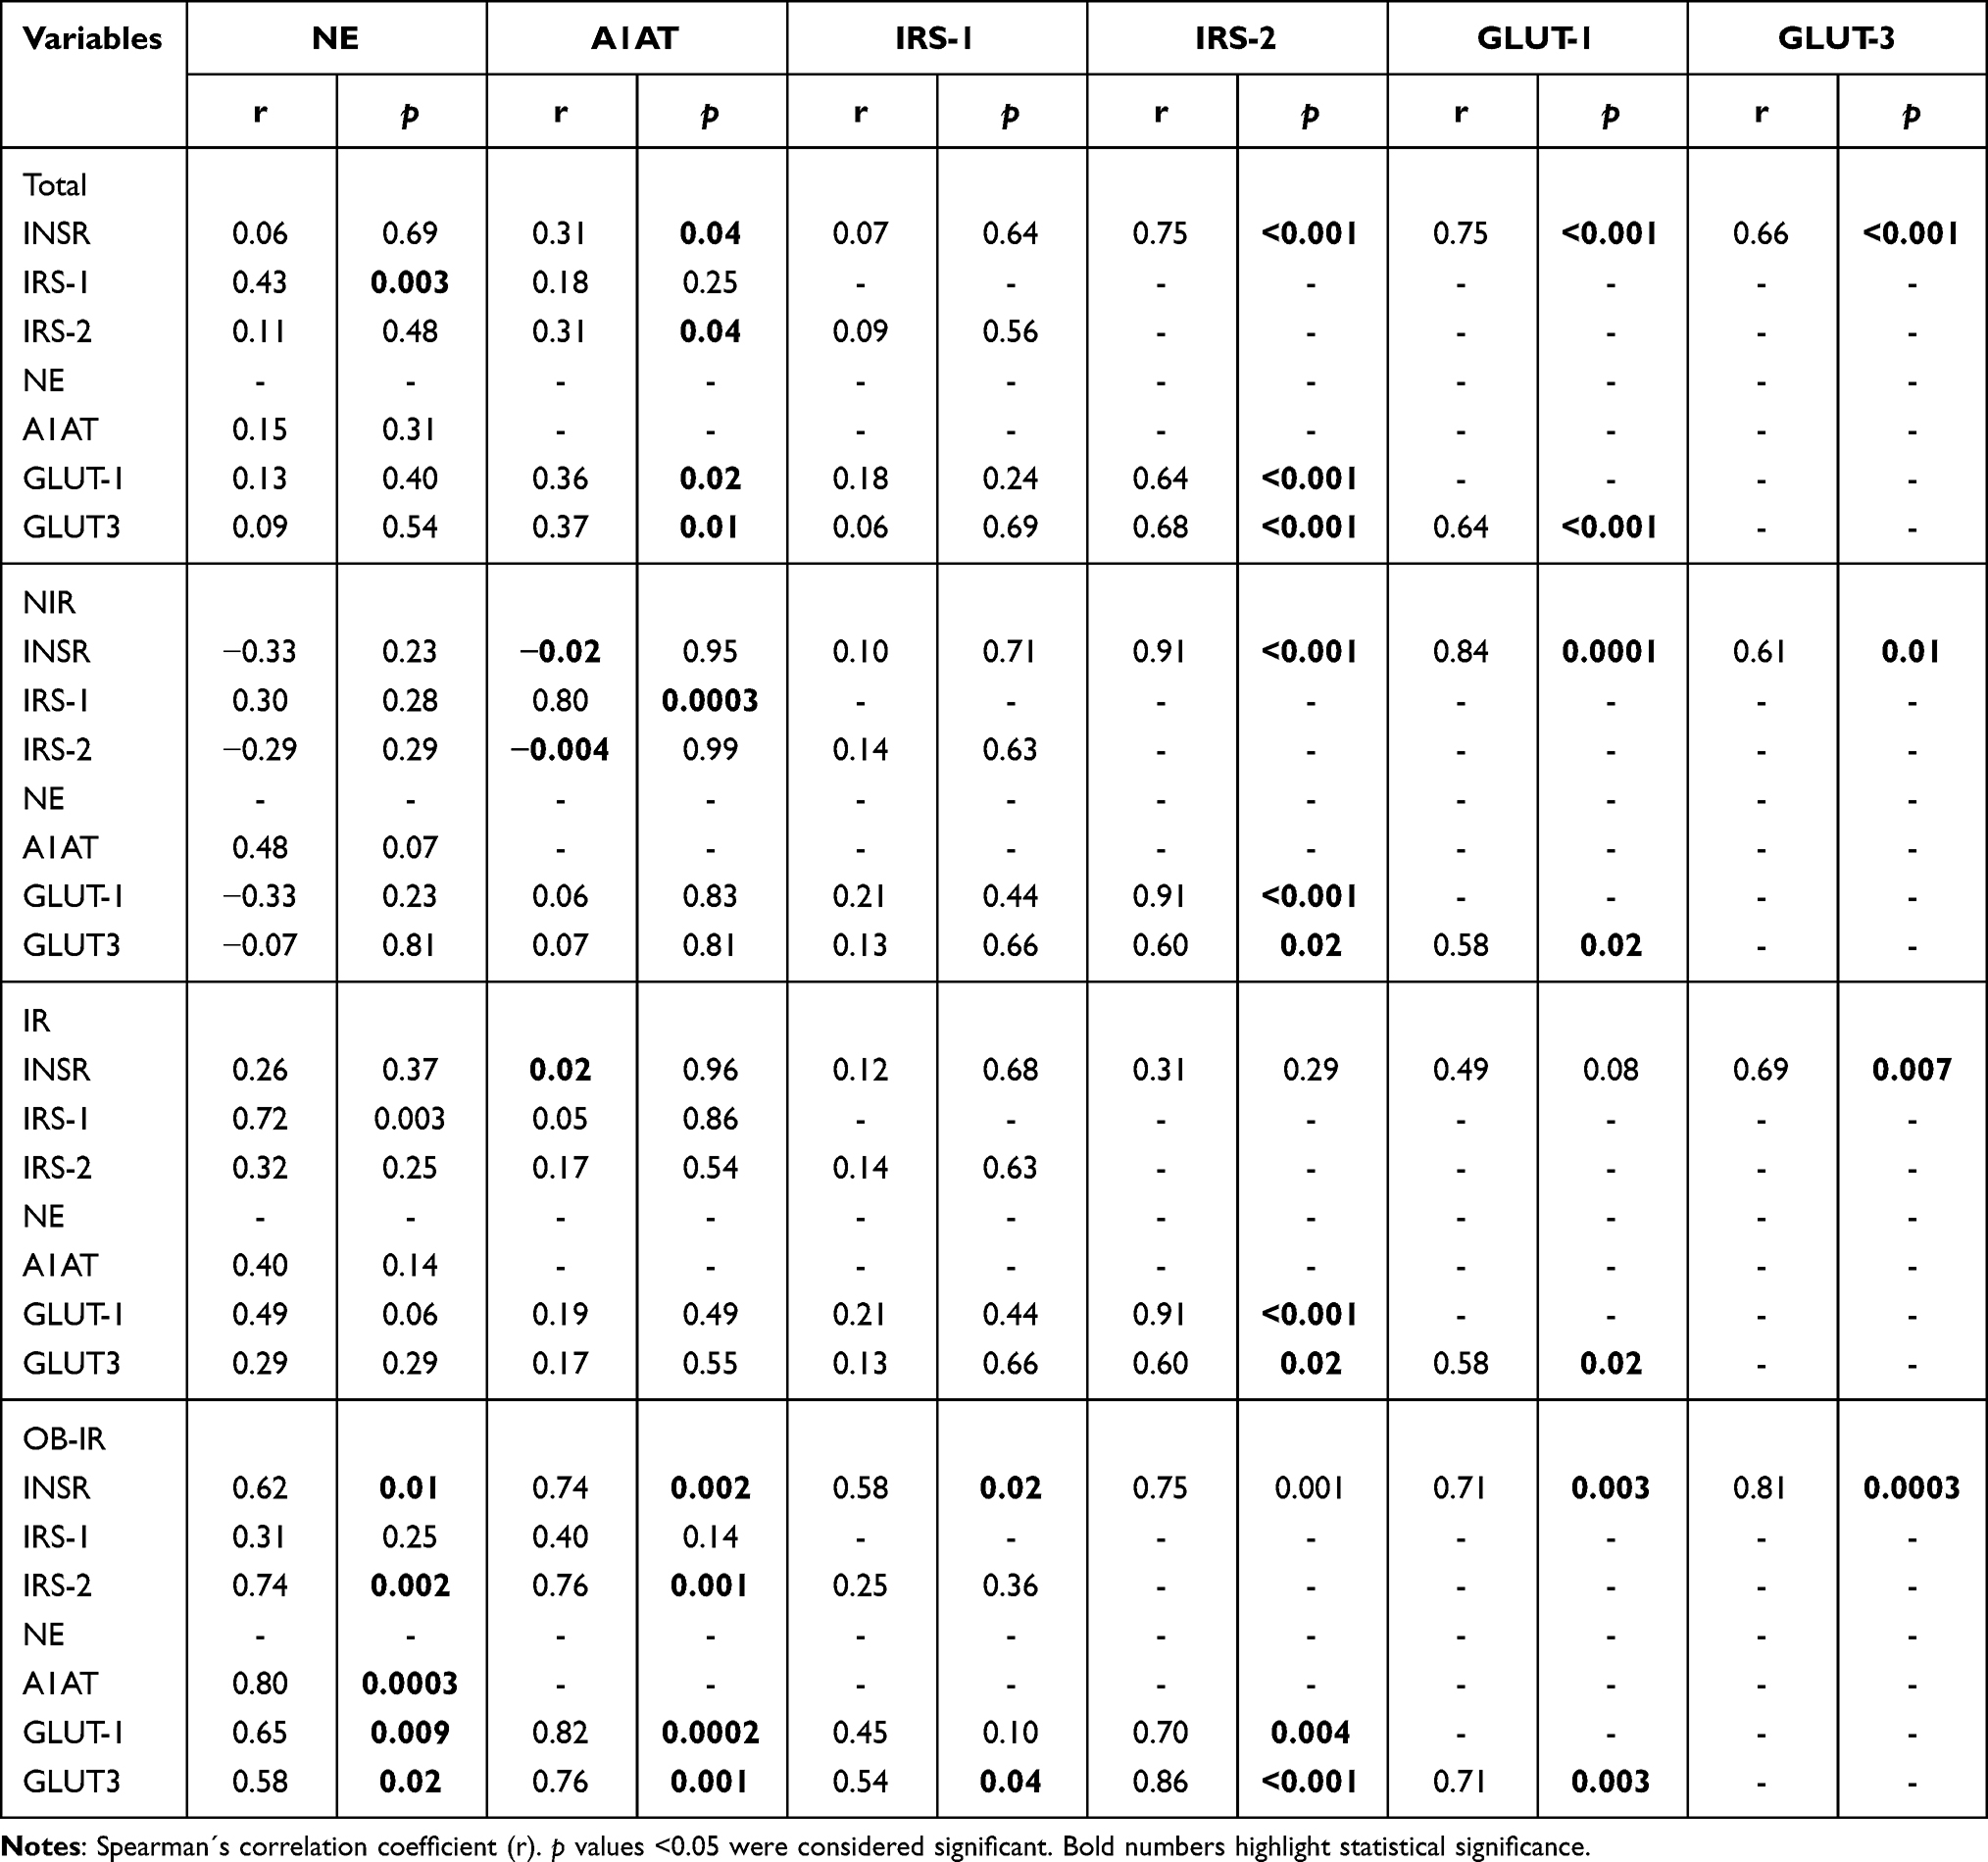 |
Table 2 Correlations Between the Expression of Insulin Signaling Pathway, NE and A1AT Genes |
Table 3 shows the correlation between NE and A1AT gene expression and anthropometric and metabolic parameters. NE correlated with BMI (r = 0.30; p = 0.048) and WHR (r = 0.36; p = 0.02), while A1AT demonstrated a negative correlation with the following parameters: weight (r = −0.52; p = 0.0003), BMI (r = −0.51; p = 0.0003), fat mass (%) (r = −0.52; p = 0.0003), fat mass (kg) (r = −0.51; p = 0.0003), waist circumference (r = −0.41; p=0.005), hip circumference (r = −0.53; p = 0.0002), insulin (r = −0.41; p = 0.005), HOMA-IR (r = −0.42; p = 0.004) and triglyceride levels (r = −0.33; p = 0.03).
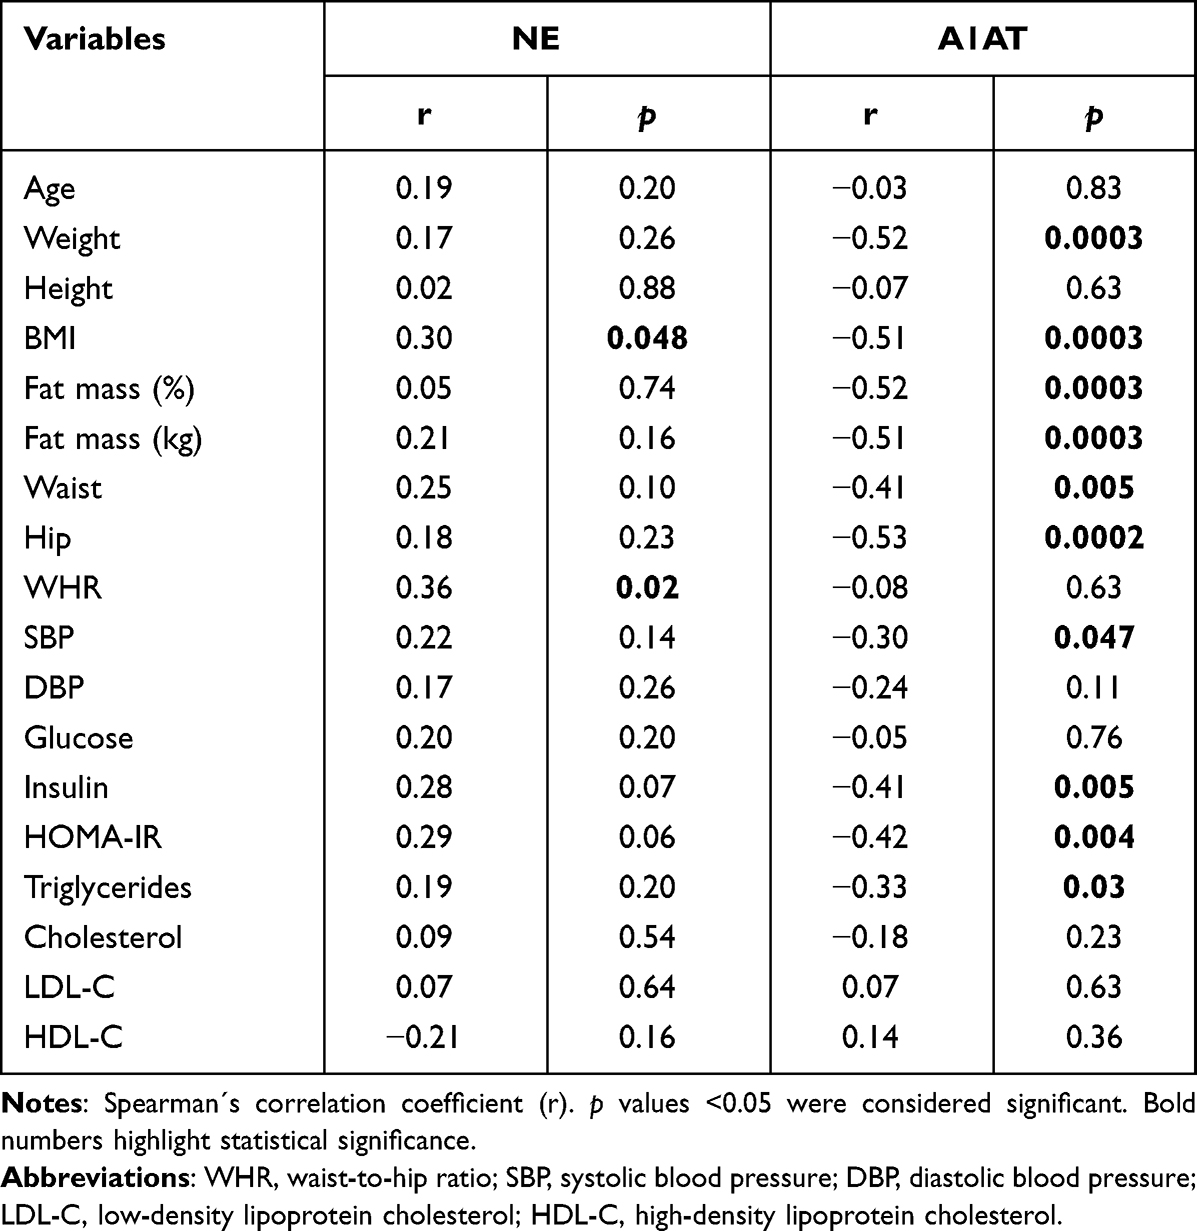 |
Table 3 Correlation Between NE and A1AT Gene Expression Among Anthropometric and Metabolic Parameters |
Discussion
Chronic hyperinsulinemia is a characteristic of insulin resistance; therefore, every cell in the body is influenced by the microenvironment created by this condition.43,44 It is clear that the transient increase in metabolic mediators, such as insulin after food intake, is favorable for resolving postprandial glycemia, but its chronic elevation, even when minimal, can generate toxicity.45 In this study, expression levels of genes in the insulin signaling pathway, NE and A1AT were evaluated in leukocytes obtained from apparently healthy individuals and from insulin-resistant individuals with normal weight or obesity. Even though individuals from the 3 groups analyzed showed normal blood glucose, cholesterol and triglyceride levels, individuals in the NIR group had the lowest levels of these three parameters, including insulin and HOMA-IR levels.
INSR is present in all cells of an organism; however, its expression levels vary depending on tissue type and in response to microenvironmental signals.46–49 In the IR group, serum insulin and HOMA-IR levels were observed to be elevated twofold; however, in the OB-IR group, these values were elevated almost fourfold compared to those of the NIR group, with a slight trend toward increased glucose levels. In INSR expression, it was significantly decreased in the OB-IR group. One of the mechanisms of regulation in INSR expression is insulin signaling itself, where a greater availability of nutrients, in this case a greater amount of circulating insulin, generates negative feedback that limits the expression of the receptor itself and IRS-2 by inhibiting the activity of the transcription factor FoxO1 to modulate signal intensity,50 although this mechanism has not been evaluated in leukocytes. The results showed that INSR expression in the OB-IR group was positively correlated with all the genes evaluated in this study. These results suggest that impairment of the proximal pathway of insulin signaling in leukocytes from individuals with obesity and insulin resistance may impact intracellular signaling, which could affect leukocyte metabolic and immune functions.
No studies have evaluated the expression of IRS in leukocytes of individuals with insulin resistance and obesity, but it is clear that it plays an important role in the transduction of signals that regulate leukocyte functions. Although the role of IRS in leukocyte signaling is not known, in this work, the changes in IRS-1 and IRS-2 expression were not significant between groups. It is known that in monocytes from individuals susceptible to developing type 2 diabetes, IRS-2 expression levels are decreased because of insulin resistance.51 In obesity, IRS-2 gene expression is decreased in macrophages, leading to increased production of proinflammatory cytokines and preventing their polarization toward the M2 phenotype.52 However, a trend toward decreased IRS-2 expression was observed in both the IR and OB-IR groups that may be related to the presence of insulin resistance, probably associated with chronic low-grade inflammation and immune cell dysfunction in obesity conditions.53,54
One of the recently described mechanisms in insulin resistance is the dysregulation of NE and its main inhibitor, A1AT. In the present study, no differences in NE expression were observed between individuals with normal weight with or without insulin resistance, although a trend toward an increase was observed in the IR group. Moreover, in these individuals, NE correlated with the expression of IRS-1, which is its degradation target that may lead to insulin resistance. NE is known to be synthesized in leukocytes such as neutrophils, monocytes and lymphocytes and stored in azurophilic granules, in response to inflammatory signals. In the OB-IR group, NE correlated with A1AT and additionally with IRS-2 expression and probably has a regulatory effect on these proteins in the insulin signaling pathway. These results that show an increase of NE expression in OB-IR group were similar to Ali et al, 2018, who found that NE levels in peripheral blood leukocytes were higher in individuals with overweight or obesity and insulin-resistance than in subjects with normal weight.55 Elevation in A1AT expression may inhibit the proinflammatory reactions associated with NE, possibly acting as a local anti-inflammatory mechanism.56 The results suggest that increased NE expression in peripheral blood leukocytes may be associated with the chronic low-grade inflammation that accompanies obesity but not with hyperinsulinemia per se because the NE expression levels did not correlate with insulin or HOMA-IR levels, although A1AT did (Table 3). Ferdous et al, 2020 reported decreased NE levels in individuals with newly diagnosed type 2 diabetes;57 these individuals showed no significant differences in blood insulin levels but significant differences in hyperglycemia, which correlated negatively with NE expression levels.
Leukocytes require constant energy production to fulfill the energetic demands involved in their activation during host defense, utilizing glucose that enters cells through GLUT transporters. GLUT-1 expression levels were not different among the groups. GLUT-1 transporter expression levels have not been evaluated in leukocytes of individuals with insulin resistance; however, increased GLUT-1 expression has been found in the muscle of individuals with this condition.58
GLUT-3 transporter levels were found to be different only between the IR and OB-IR groups. In the skeletal muscle of insulin-resistant individuals, decreased GLUT-3 expression levels have been reported.58 Insulin treatment has been shown to increase the expression of both GLUT-1 and GLUT-3, indicating that their biosynthesis is insulin-dependent.59 These results may suggest that the insulin signaling pathway regulates the expression of these transporters to maintain glucose uptake, which is dysregulated in obesity.
Although the presence of the three GLUT isoforms has been reported in peripheral blood leukocytes,60 in this study, GLUT-4 expression was not observed in any of the groups; therefore, their capacity to store large amounts of energy, compared to classical target cells in metabolic tissues, is limited. Whereas leukocytes are not cells that could be used as classical models of insulin signaling, they are cells that depend on glucose metabolism for their survival,61 differentiation,62 activation63 and immune functions,64,65 so that tight regulation of insulin-induced translocation of GLUT-3 transporters to the membrane is required to modulate glucose uptake,23 due that deterioration of insulin signaling could promote excessive glucose uptake and generate immune hyperactivation and even immune pathology.
There are certain limitations in the present study, due to the expression of the components in the insulin signaling pathway at the protein level, as well as the phosphorylation of molecules such as INSR or IRS-1/2, which are necessary for signal transduction, were not evaluated.
Conclusion
In the present study, the expression of certain genes involved in the insulin signaling pathway, NE and A1AT in peripheral blood leukocytes was analyzed, and a differential expression pattern was found among the three groups studied. The expression of insulin signaling pathway genes was significantly altered, and these changes were associated with the increased expression of NE and A1AT, suggesting that the hyperinsulinemia that occurs in obesity may be related to the expression of these genes. A positive correlation between NE and A1AT expression and INSR, IRS-2, GLUT-1 and GLUT-3 was found in the OB-IR group. Future studies are needed to elucidate the molecular mechanisms involved in insulin resistance in leukocytes, where NE and A1AT may play relevant role.
Data Sharing Statement
The authors indicate that all supporting data are included within the main article. The data that support the findings of this study are available from the corresponding author upon reasonable request.
Acknowledgments
WD Cruz-Pineda was a recipient of a CONACyT fellowship (778762).
Author Contributions
All authors made a significant contribution to the work reported, whether that is in the conception, study design, execution, acquisition of data, analysis and interpretation, or in all these areas; took part in drafting, revising or critically reviewing the article; gave final approval of the version to be published; have agreed on the journal to which the article has been submitted; and agree to be accountable for all aspects of the work.
Disclosure
The authors declare no conflicts of interest.
References
1. Petersen MC, Shulman GI. Mechanisms of insulin action and insulin resistance. Physiol Rev. 2018;98(4):2133–2223. doi:10.1152/physrev.00063.2017
2. Wu W-C, Wei J-N, Chen S-C, et al. Progression of insulin resistance: a link between risk factors and the incidence of diabetes. Diabetes Res Clin Pract. 2020;161:108050. doi:10.1016/j.diabres.2020.108050
3. Lee CH, Lam KS. Obesity-induced insulin resistance and macrophage infiltration of the adipose tissue: a vicious cycle. J Diabetes Investig. 2019;10(1):29–31. doi:10.1111/jdi.12918
4. Mukherjee B, Hossain CM, Mondal L, Paul P, Ghosh MK. Obesity and insulin resistance: an abridged molecular correlation. Lipid Insights. 2013;6:1–11. doi:10.4137/lpi.s10805
5. Marchesini G, Brizi M, Morselli-Labate AM, et al. Association of nonalcoholic fatty liver disease with insulin resistance. Am J Med. 1999;107(5):450–455. doi:10.1016/S0002-9343(99
6. Kim SH, Reaven GM. Insulin resistance and hyperinsulinemia: you can’t have one without the other. Diabetes Care. 2008;31(7):1433–1438. doi:10.2337/dc08-0045
7. Dali-Youcef N, Mecili M, Ricci R, Andrés E. Metabolic inflammation: connecting obesity and insulin resistance. Ann Med. 2013;45(3):242–253. doi:10.3109/07853890.2012.705015
8. Ohta Y, Kinugawa S, Matsushima S, et al. Oxidative stress impairs insulin signal in skeletal muscle and causes insulin resistance in postinfarct heart failure. Am J Physiol Heart Circ Physiol. 2011;300(5):H1637–44. doi:10.1152/ajpheart.01185.2009
9. Roden M, Price TB, Perseghin G, et al. Mechanism of free fatty acid-induced insulin resistance in humans. J Clin Invest. 1996;97(12):2859–2865. doi:10.1172/jci118742
10. Sears B, Perry M. The role of fatty acids in insulin resistance. Lipids Health Dis. 2015;14:121. doi:10.1186/s12944-015-0123-1
11. Alberti KG, Eckel RH, Grundy SM, et al. Harmonizing the metabolic syndrome: a joint interim statement of the International Diabetes Federation Task Force on Epidemiology and Prevention; National Heart, Lung, and Blood Institute; American Heart Association; World Heart Federation; International Atherosclerosis Society; and International Association for the Study of Obesity. Circulation. 2009;120(16):1640–1645. doi:10.1161/circulationaha.109.192644
12. Ford ES, Li C, Zhao G. Prevalence and correlates of metabolic syndrome based on a harmonious definition among adults in the US. J Diabetes. 2010;2(3):180–193. doi:10.1111/j.1753-0407.2010.00078.x
13. CDC. Prediabetes - your chance to prevent type 2 diabetes. Available from: https://www.cdc.gov/diabetes/basics/prediabetes.html.
14. Gutiérrez-Solis AL, Datta Banik S, Méndez-González RM. Prevalence of metabolic syndrome in Mexico: a systematic review and meta-analysis. Metab Syndr Relat Disord. 2017;16(8):395–405. doi:10.1089/met.2017.0157
15. Saklayen MG. The global epidemic of the metabolic syndrome. Curr Hypertens Rep. 2018;20(2):12. doi:10.1007/s11906-018-0812-z
16. Sigit FS, Tahapary DL, Trompet S, et al. The prevalence of metabolic syndrome and its association with body fat distribution in middle-aged individuals from Indonesia and the Netherlands: a cross-sectional analysis of two population-based studies. Diabetol Metab Syndr. 2020;12:2. doi:10.1186/s13098-019-0503-1
17. Lim SM, Choi DP, Rhee Y, Kim HC. Association between obesity indices and insulin resistance among healthy Korean adolescents: the JS high school study. PLoS One. 2015;10(5):e0125238. doi:10.1371/journal.pone.0125238
18. Sejooti SS, Naher S, Hoque M, Zaman MS, Aminur Rashid HM. Frequency of insulin resistance in nondiabetic adult Bangladeshi individuals of different obesity phenotypes. Diab Metabol Synd. 2019;13(1):62–67. doi:10.1016/j.dsx.2018.08.022
19. Samocha-Bonet D, Dixit VD, Kahn CR, et al. Metabolically healthy and unhealthy obese–the 2013 Stock Conference report. Obes Rev. 2014;15(9):697–708. doi:10.1111/obr.12199
20. Madeira FB, Silva AA, Veloso HF, et al. Normal weight obesity is associated with metabolic syndrome and insulin resistance in young adults from a middle-income country. PLoS One. 2013;8(3):e60673. doi:10.1371/journal.pone.0060673
21. McLaughlin T, Allison G, Abbasi F, Lamendola C, Reaven G. Prevalence of insulin resistance and associated cardiovascular disease risk factors among normal weight, overweight, and obese individuals. Metabolism. 2004;53(4):495–499. doi:10.1016/j.metabol.2003.10.032
22. Honka M-J, Latva-Rasku A, Bucci M, et al. Insulin-stimulated glucose uptake in skeletal muscle, adipose tissue and liver: a positron emission tomography study. Eur J Endocrinol. 2018;178(5):523–531. doi:10.1530/eje-17-0882
23. Maratou E, Dimitriadis G, Kollias A, et al. Glucose transporter expression on the plasma membrane of resting and activated white blood cells. Eur J Clin Invest. 2007;37(4):282–290. doi:10.1111/j.1365-2362.2007.01786.x
24. Dimitriadis G, Maratou E, Boutati E, Psarra K, Papasteriades C, Raptis SA. Evaluation of glucose transport and its regulation by insulin in human monocytes using flow cytometry. Cytom A. 2005;64A(1):27–33. doi:10.1002/cyto.a.20108
25. White MF. The insulin signalling system and the IRS proteins. Diabetologia. 1997;40(2):S2–S17. doi:10.1007/s001250051387
26. White MF. IRS proteins and the common path to diabetes. Am J Physiol Endocrinol Metab. 2002;283(3):E413–22. doi:10.1152/ajpendo.00514.2001
27. Döring G. The role of neutrophil elastase in chronic inflammation. Am J Respir Crit Care Med. 1994;150(6):S114–S117. doi:10.1164/ajrccm/150.6_Pt_2.S114
28. Janciauskiene S, Wrenger S, Immenschuh S, et al. The multifaceted effects of alpha1-antitrypsin on neutrophil functions. Front Pharmacol. 2018;9:341. doi:10.3389/fphar.2018.00341
29. Matamala N, Aggarwal N, Iadarola P, et al. Identification of novel short C-terminal transcripts of human SERPINA1 gene. PLoS One. 2017;12(1):e0170533. doi:10.1371/journal.pone.0170533
30. Cruz-Pineda WD, Parra-Rojas I, Rodríguez-Ruiz HA, Illades-Aguiar B, Matia-García I, Garibay-Cerdenares OL. The regulatory role of insulin in energy metabolism and leukocyte functions. J Leukoc Biol. 2021;1–12. doi:10.1002/JLB.2RU1220-847R
31. Casagrande FB, Ferreira S, de Sousa ESA, et al. Insulin modulates inflammatory cytokine release in acute stages and augments expression of adhesion molecules and leukocytes in lungs on chronic stages of paracoccidioidomycosis. Front Immunol. 2020;11:583385. doi:10.3389/fimmu.2020.583385
32. Ieronymaki E, Theodorakis EM, Lyroni K, et al. Insulin resistance in macrophages alters their metabolism and promotes an M2-like phenotype. J Immunol. 2019;202(6):1786–1797. doi:10.4049/jimmunol.1800065
33. Ebeling P, Koistinen HA, Koivisto VA. Insulin-independent glucose transport regulates insulin sensitivity. FEBS Lett. 1998;436(3):301–303. doi:10.1016/S0014-5793(98
34. Olson AL. Regulation of GLUT4 and insulin-dependent glucose flux. ISRN Mol Biol. 2012;2012:856987. doi:10.5402/2012/856987
35. Uemura E, Greenlee HW. Insulin regulates neuronal glucose uptake by promoting translocation of glucose transporter GLUT3. Exp Neurol. 2006;198(1):48–53. doi:10.1016/j.expneurol.2005.10.035
36. James HA, O’Neill BT, Nair KS. Insulin regulation of proteostasis and clinical implications. Cell Metab. 2017;26(2):310–323. doi:10.1016/j.cmet.2017.06.010
37. Batista TM, Garcia-Martin R, Cai W, et al. Multi-dimensional transcriptional remodeling by physiological insulin in vivo. Cell Rep. 2019;26(12):3429–3443.e3. doi:10.1016/j.celrep.2019.02.081
38. O’Brien RM, Granner DK. Regulation of gene expression by insulin. Physiol Rev. 1996;76(4):1109–1161. doi:10.1152/physrev.1996.76.4.1109
39. Mansuy-Aubert V, Zhou QL, Xie X, et al. Imbalance between neutrophil elastase and its inhibitor α1-antitrypsin in obesity alters insulin sensitivity, inflammation, and energy expenditure. Cell Metab. 2013;17(4):534–548. doi:10.1016/j.cmet.2013.03.005
40. Talukdar S, Oh DY, Bandyopadhyay G, et al. Neutrophils mediate insulin resistance in mice fed a high-fat diet through secreted elastase. Nat Med. 2012;18(9):1407–1412. doi:10.1038/nm.2885
41. Matthews DR, Hosker JP, Rudenski AS, Naylor BA, Treacher DF, Turner RC. Homeostasis model assessment: insulin resistance and β-cell function from fasting plasma glucose and insulin concentrations in man. Diabetologia. 1985;28(7):412–419. doi:10.1007/bf00280883
42. Chomczynski P, Sacchi N. Single-step method of RNA isolation by acid guanidinium thiocyanate-phenol-chloroform extraction. Anal Biochem. 1987;162(1):156–159. doi:10.1016/0003-2697(87
43. Crofts CA, Zinn C, Wheldon M, Schofield G. Hyperinsulinemia: a unifying theory of chronic disease? Diabesity. 2015;1(4):34. doi:10.15562/diabesity.2015.19
44. Singh S, Bodas M, Bhatraju NK, et al. Hyperinsulinemia adversely affects lung structure and function. Am J Physiol Lung Cell Mol Physiol. 2016;310(9):L837–45. doi:10.1152/ajplung.00091.2015
45. Kolb H, Kempf K, Röhling M, Martin S. Insulin: too much of a good thing is bad. BMC Med. 2020;18(1):224. doi:10.1186/s12916-020-01688-6
46. Goldstein BJ, Muller-Wieland D, Kahn CR. Variation in insulin receptor messenger ribonucleic acid expression in human and rodent tissues. Mol Endocrinol. 1987;1(11):759–766. doi:10.1210/mend-1-11-759
47. Leal MA, Aller P, Mas A, Carranza C, Calle C. Tissue-specific changes in insulin receptor mRNA concentrations in dexamethasone-treated and adrenalectomized rats. Endocr J. 1994;41(6):737–741. doi:10.1507/endocrj.41.737
48. Moyerbrailean GA, Richards AL, Kurtz D, et al. High-throughput allele-specific expression across 250 environmental conditions. Genome Res. 2016;26(12):1627–1638. doi:10.1101/gr.209759.116
49. Pezzino V, Papa V, Trischitta V, et al. Human insulin receptor radioimmunoassay: applicability to insulin-resistant states. Am J Physiol. 1989;257(3):E451–E457. doi:10.1152/ajpendo.1989.257.3.E451
50. Puig O, Tjian R. Transcriptional feedback control of insulin receptor by dFOXO/FOXO1. Genes Dev. 2005;19(20):2435–2446. doi:10.1101/gad.1340505
51. Cardellini M, Menghini R, Luzi A, et al. Decreased IRS2 and TIMP3 expression in monocytes from offspring of type 2 diabetic patients is correlated with insulin resistance and increased intima-media thickness. Diabetes. 2011;60(12):3265–3270. doi:10.2337/db11-0162
52. Kubota T, Inoue M, Kubota N, et al. Downregulation of macrophage Irs2 by hyperinsulinemia impairs IL-4-indeuced M2a-subtype macrophage activation in obesity. Nat Commun. 2018;9(1):4863. doi:10.1038/s41467-018-07358-9
53. López-Vicario C, Titos E, Walker ME, et al. Leukocytes from obese individuals exhibit an impaired SPM signature. FASEB J. 2019;33(6):7072–7083. doi:10.1096/fj.201802587R
54. Solt CM, Hill JL, Vanderpool K, Foster MT. Obesity-induced immune dysfunction and immunosuppression: TEM observation of visceral and subcutaneous lymph node microarchitecture and immune cell interactions. Horm Mol Biol Clin Investig. 2019;39(2):1–14. doi:10.1515/hmbci-2018-0083
55. Ali M, Jasmin S, Fariduddin M, Alam SMK, Arslan MI, Biswas SK. Neutrophil elastase and myeloperoxidase mRNA expression in overweight and obese subjects. Mol Biol Rep. 2018;45(5):1245–1252. doi:10.1007/s11033-018-4279-4
56. Ehlers MR. Immune-modulating effects of alpha-1 antitrypsin. Biol Chem. 2014;395(10):1187–1193. doi:10.1515/hsz-2014-0161
57. Ferdous M, Ali M, Mudi SR, et al. Expression of neutrophil elastase and myeloperoxidase mRNA in patients with newly diagnosed type 2 diabetes mellitus. Diab Metabol Synd. 2020;14(2):83–85. doi:10.1016/j.dsx.2020.01.001
58. Stuart CA, Wen G, Williamson ME, et al. Altered GLUT1 and GLUT3 gene expression and subcellular redistribution of GLUT4: protein in muscle from patients with acanthosis nigricans and severe insulin resistance. Metabolism. 2001;50(7):771–777. doi:10.1053/meta.2001.24202
59. Taha C, Mitsumoto Y, Liu Z, Skolnik EY, Klip A. The insulin-dependent biosynthesis of GLUT1 and GLUT3 glucose transporters in L6 muscle cells is mediated by distinct pathways: roles of p21 ras and pp70 S6 kinase. J Biol Chem. 1995;270(42):24678–24681. doi:10.1074/jbc.270.42.24678
60. Korgun ET, Demir R, Sedlmayr P, et al. Sustained hypoglycemia affects glucose transporter expression of human blood leukocytes. Blood Cells Mol Dis. 2002;28(2):152–159. doi:10.1006/bcmd.2002.0504
61. Maclver NJ, Jacobs SR, Wieman HL, Wofford JA, Coloff JL, Rathmell JC. Glucose metabolism in lymphocytes is a regulated process with significant effects on immune cell function and survival. J Leukoc Biol. 2008;84(4):949–957. doi:10.1189/jlb.0108024
62. Palmer CS, Ostrowski M, Balderson B, Christian N, Crowe SM. Glucose metabolism regulates T cell activation, differentiation, and functions. Front Immunol. 2015;6:1. doi:10.3389/fimmu.2015.00001
63. Tsai S, Clemente-Casares X, Zhou AC, et al. Insulin receptor-mediated stimulation boosts T cell immunity during inflammation and Infection. Cell Metab. 2018;28(6):922–934.e4. doi:10.1016/j.cmet.2018.08.003
64. Fischer HJ, Sie C, Schumann E, et al. The insulin receptor plays a critical role in T cell function and adaptive immunity. J Immunol. 2017;198(5):1910. doi:10.4049/jimmunol.1601011
65. Yano H, Kinoshita M, Fujino K, et al. Insulin treatment directly restores neutrophil phagocytosis and bactericidal activity in diabetic mice and thereby improves surgical site Staphylococcus aureus infection. Infect Immun. 2012;80(12):4409–4416. doi:10.1128/iai.00787-12
 © 2022 The Author(s). This work is published and licensed by Dove Medical Press Limited. The
full terms of this license are available at https://www.dovepress.com/terms
and incorporate the Creative Commons Attribution
- Non Commercial (unported, 3.0) License.
By accessing the work you hereby accept the Terms. Non-commercial uses of the work are permitted
without any further permission from Dove Medical Press Limited, provided the work is properly
attributed. For permission for commercial use of this work, please see paragraphs 4.2 and 5 of our Terms.
© 2022 The Author(s). This work is published and licensed by Dove Medical Press Limited. The
full terms of this license are available at https://www.dovepress.com/terms
and incorporate the Creative Commons Attribution
- Non Commercial (unported, 3.0) License.
By accessing the work you hereby accept the Terms. Non-commercial uses of the work are permitted
without any further permission from Dove Medical Press Limited, provided the work is properly
attributed. For permission for commercial use of this work, please see paragraphs 4.2 and 5 of our Terms.