Back to Journals » International Journal of General Medicine » Volume 8
Changes in retinal microvascular diameter in patients with diabetes
Authors Vasconcellos Batista da Silva A, Gouvea SA, Paulo Batista da Silva A, Bortolon S, Nunes Rodrigues A, Rodrigues Abreu G, Luiz Herkenhoff F
Received 1 March 2015
Accepted for publication 7 May 2015
Published 25 August 2015 Volume 2015:8 Pages 267—273
DOI https://doi.org/10.2147/IJGM.S83749
Checked for plagiarism Yes
Review by Single anonymous peer review
Peer reviewer comments 4
Editor who approved publication: Dr Scott Fraser
Andréa Vasconcellos Batista da Silva,1 Sonia Alves Gouvea,2 Aurélio Paulo Batista da Silva,1 Saulo Bortolon,3 Anabel Nunes Rodrigues,2 Glaucia Rodrigues Abreu,2 Fernando Luiz Herkenhoff,2
1Department of Morphology, 2Department of Physiological Sciences, Health Sciences Center, 3Department of Technology, Informatic Center, Federal University of Espírito Santo, Vitoria, Espirito Santo, Brazil
Background and objectives: Diabetic retinopathy is the main microvascular complication in diabetes mellitus and needs to be diagnosed early to prevent severe sight-threatening retinopathy. The purpose of this study was to quantify the retinal microvasculature pattern and analyze the influence of blood glucose level and the duration of diabetes mellitus on the retinal microvasculature.
Methods: Two groups were analyzed: patients with diabetes (N=26) and patients without diabetes, ie, controls (N=26). A quantitative semiautomated method analyzed retinal microvasculature. The diameters of arterioles and venules were measured. The total numbers of arterioles and venules were counted. The ratio of arteriole diameter to venule diameter was calculated. The retinal microvasculature pattern was related to clinical and biochemical parameters.
Results: Patients with diabetes exhibited larger venule diameters in the upper temporal quadrant of the retina compared to the lower temporal quadrant (124.85±38.03 µm vs 102.92±15.69 µm; P<0.01). Patients with diabetes for 5 or more years had larger venule diameters in the upper temporal quadrant than patients without diabetes (141.62±44.44 vs 112.58±32.11 µm; P<0.05). The degree of venodilation in the upper temporal quadrant was positively correlated with blood glucose level and the estimated duration of diabetes mellitus.
Interpretation and conclusion: The employed quantitative method demonstrated that patients with diabetes exhibited venule dilation in the upper temporal quadrant, and the duration of diabetes mellitus was positively correlated with blood glucose level. Therefore, the early assessment of retinal microvascular changes is possible prior to the onset of diabetic retinopathy.
Keywords: diabetic retinopathy, diabetes mellitus, diabetic microangiopathy
Introduction
Diabetic retinopathy (DR) is the main microvascular complication in diabetes mellitus (DM), and it is a primary cause of low visual acuity.1 Changes to the retinal microvasculature, especially dilation of venules and arterioles, result from structural and functional alterations, such as pericyte degeneration2 and thickening of the basement membrane.3 Endothelial dysfunction is a characteristic functional change that precedes structural alterations.4 Retinal blood flow is autoregulated by the interaction between myogenic and metabolic mechanisms,5 and an imbalance of endothelium-derived relaxing and contracting factors could be important for the development of vascular ophthalmic complications like diabetes and retinal ischemia.6
The study suggests that retinal vessel caliber and geometry of the retinal vasculature may be important risk factors for the progression to proliferative DR.7 In addition, the Asian population was shown to have wider retinal arterioles in diabetes and wider venules in those with DR, supporting the concept that a quantitative assessment of retinal vasculature may provide further insights into early diabetic microvascular damage.8
The early diagnosis of DR using high precision instruments is extremely important to improve our understanding of diabetic microangiopathy and develop new treatment options. DR is a major cause of blindness.9 The qualitative changes in DR initially appear in the upper temporal quadrant.10 The quantification of retinal vessels can estimate the progression of DR, and this technique can predict treatment success.11 The present study quantified the retinal microvasculature pattern and analyzed the influence of blood glucose level and the duration of DM on the retinal microvasculature.
Materials and methods
Individuals were invited to participate voluntarily in this study. After being informed about all relevant procedures and aspects of the study, participants signed an informed consent form in accordance with national and international standards for research conducted using human subjects. The study was approved by the Ethics in Human Research Committee of the Federal University of Espirito Santo. Initially, 180 patients were screened for this study. The patients were treated at the Ophthalmology Outpatient Clinics of the municipal public health care system and the Cassiano Antônio de Moraes University Hospital. Individuals of both sexes aged 25–55 years were included in the study with no restrictions on race. The following exclusion criteria were used: prior diagnosis of ametropy greater than or equal to 4 D, cataract, glaucoma, corneal damage, systemic arterial hypertension, and patients who did not complete all stages of the study. Patients without diabetes (N=26) and with (N=26) diabetes with fasting glucose ≥7.8 mmol/L or using oral hypoglycemics after the initial assessment remained in the study. Clinical assessment, retinography, and blood collection for biochemical assays were performed during fasting at the Clinic for Cardiovascular Research of the Graduate Program in Physiological Sciences at the Federal University of Espírito Santo, Vitoria, Espirito Santo, Brazil.
Blood pressure (BP) was measured casually, and the mean of three BP measurements was considered. BP was measured with the patient seated, after resting for 5 minutes and at least 30 minutes since last consuming coffee, alcohol, cigarettes, or food.12 A mercury sphygmomanometer and stethoscope were used. A single observer performed the assessments based on Phases 1 and 5 of the Korotkoff sounds. The pulse pressure (PP) was calculated as the difference between systolic arterial pressure (SAP) and diastolic arterial pressure (DAP). The heart rate (HR) was assessed using the arterial pulse (bpm). The mean arterial pressure (MAP) was calculated using the following formula: MAP = DAP + (SAP – DAP)/3.12 Hypertension was defined as a mean systolic blood pressure ≥140 mmHg and/or mean diastolic blood pressure ≥90 mmHg and/or a history of taking antihypertensive medication at the time of examination.
The ophthalmological examination was performed with the participants under pharmacological mydriasis with 1% tropicamide (Mydriacyl®). Retinography (photograph of the fundus – noninvasive method) was performed using a Nikon® NF 505 retinograph attached to a 35-mm camera with a 50° aperture, and images of the fundus were recorded on Fuji® ASA 400 film. The film was developed, and the highest quality picture was selected for one eye and digitized on a model 3670 HP scanner (200 dpi resolution). Quantitative semiautomated analysis of the retinal vessels was performed using a computer program that automatically defined the radius of the optic disk as ~0.9 mm.13
The program drew a circle with a radius three times that of the optic disk, which is similar to the procedure of Stanton et al.14 The observer marked the edges of retinal vessels around the greater circle using a caliper and measured in micron (μm). Two perpendicular lines were drawn through the center of the optical disk to divide the retina into quadrants (Figure 1). Vessels with diameters smaller than 30 μm were excluded due to the lack of precision in edge definition. The following variables were recorded: total number of arterioles (TNA); total number of venules (TNV); arteriole diameter (AD), defined as the sum of diameters for all arterioles; sum of arteriole diameters in the upper temporal quadrant (ADUT); sum of arteriole diameters in the lower temporal quadrant (ADLT); sum of arteriole diameters in the upper nasal quadrant (ADUN); sum of arteriole diameters in the lower nasal quadrant (ADLN); venule diameter (VD), defined as the sum of diameters for all venules; sum of venule diameters in the upper temporal quadrant (VDUT); sum of venule diameters in the lower temporal quadrant (VDLT); sum of venule diameters in the upper nasal quadrant (VDUN); sum of venule diameters in the lower nasal quadrant (VDLN); arteriole diameter/venule diameter ratio, obtained by dividing these two variables (AD/VD ratio); the AD/VD ratio in the upper temporal quadrant (AD/VD ratio UT); AD/VD ratio in the lower temporal quadrant (AD/VD ratio LT); AD/VD ratio in the upper nasal quadrant (AD/VD ratio UN); and AD/VD ratio in the lower nasal quadrant (AD/VD ratio LN).
 | Figure 1 Definition of the optical disk, the greater circle and quadrants of the retina for quantification of the arteriole (A) and venule (V) microvasculature. |
Statistical analysis
The data are presented as the means ± standard deviation. Student’s t-test was used to compare the clinical, biochemical, and ophthalmological data between groups with and without diabetes, when required. Correlations between the studied variables in the total sample were tested using Pearson’s correlation coefficient, and the results are shown in linear regression plots. One-way analysis of variance (ANOVA) with Tukey’s post hoc test were used to compare the control group with the group with diabetes for less than 5 years and the group with diabetes for 5 or more years. Multiple linear regression was used to test the effects of DM duration and blood glucose level on retinal microvasculature. The level of significance was set at 0.05. The SPSS 11.0 software for Windows was used to perform the statistical analyses.
Results
The clinical and biochemical characteristics of the sample are shown in Table 1. The groups did not differ in age, sex, SAP, DAP, PP, MAP, or HR. The biochemical data in Table 1 indicate that fasting glucose, VLDL (very-low-density lipoprotein) cholesterol, and triglycerides were significantly higher in patients with diabetes than patients without diabetes (controls). The groups did not differ in mean values for total cholesterol, HDL (high-density lipoprotein) cholesterol, LDL (low-density lipoprotein) cholesterol, hematocrit, erythrocyte number, or hemoglobin. The microvascular features of the retina were distinct in the various quadrants. Table 2 shows significant differences among patients with diabetes in the mean ADUN vs ADLN, VDUT vs VDLT, and VDUN vs VDLN. The remaining microvascular features of the retina were not significantly different. The mean VDUT was ~22% greater in patients with diabetes for 5 or more years than in patients with diabetes for less than 5 years and in patients without diabetes (controls) (Table 3). The differences for the group with diabetes described in Table 3 remained when the distribution of diabetes duration was considered, and the means for VDUT vs VDLT and VDUN vs VDLN differed significantly among patients with diabetes for 5 or more years. Quantitative changes in the retinal microvasculature in the upper temporal quadrant of patients with diabetes were more evident when associated with blood plasma glucose levels (Figure 2). Significant positive correlations were observed between blood glucose level and VDUT (r=0.37, P<0.01) and blood glucose level and ADUT (r=0.31, P<0.05). The TAD, ADLT, ADUN, ADLN, TVD, VDLT, VDUN, VDLN, AD/VD ratio, TNA, and TNV were not correlated with blood glucose level. A positive correlation was observed between VDUT and duration of diabetes (Figure 3). The duration of diabetes exhibited an r2 of 0.23 (P<0.05) and explained 23% of VDUT dilation. The partial correlation coefficient was adjusted for SAP, and a positive correlation was observed between blood glucose level and VDUT (r=0.37 vs r=0.37 after adjusting for SAP, P<0.01) and blood glucose level and ADUT (r=0.31 vs r=0.30 after adjusting for SAP, P<0.05), independent of SAP. The remaining retinal microvascular parameters (TAD, ADLT, ADUN, ADLN, TVD, VDLT, VDUN, VDLN, AD/VD Ratio, TNA, and TNV) were not correlated with blood glucose level (Table 4). The partial correlation with adjustment for SAP was calculated between DM duration and VDUT. SAP did not affect this correlation (r=0.33 vs r=0.33 after adjusting for SAP, P<0.01). The remaining retinal microvascular parameters were not correlated with DM duration after adjusting for SAP (Table 5).
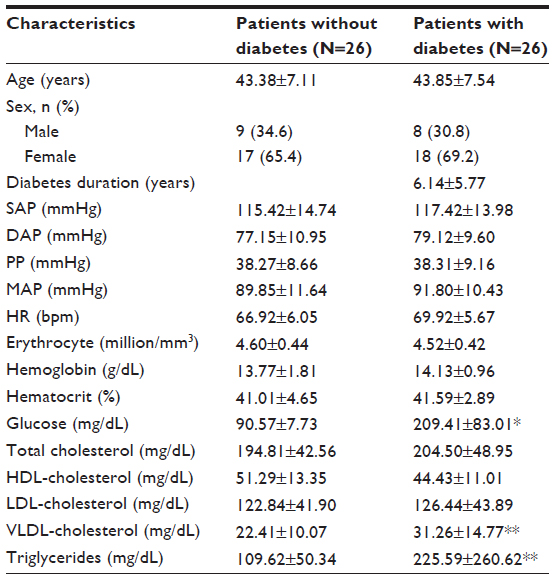 | Table 1 Clinical and biochemical characteristics of patients with and without diabetes |
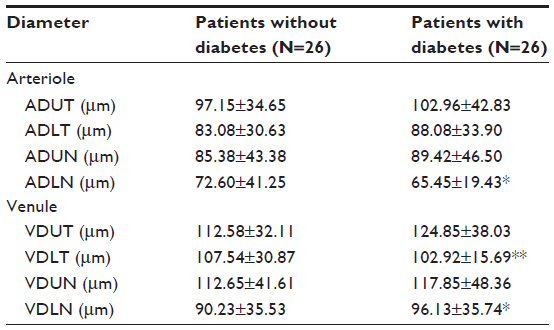 | Table 2 Characteristics of arteriole diameter and venule diameter of the retinal microvasculature by quadrant, in patients with and without diabetes (controls) |
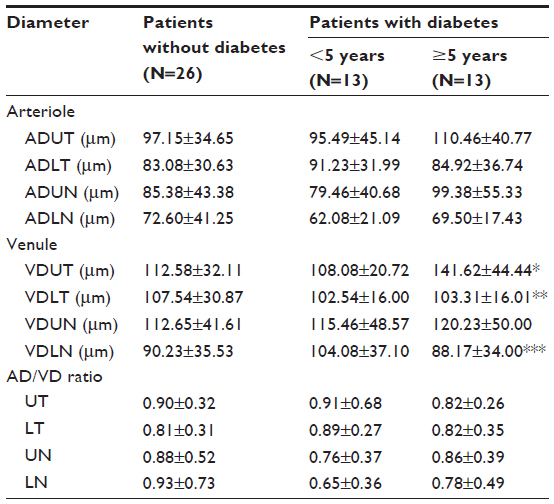 | Table 3 Characteristics of the AD, VD, and the AD/VD ratio of the retinal microvasculature by quadrant, in patients with and without diabetes (controls) distributed according to disease duration |
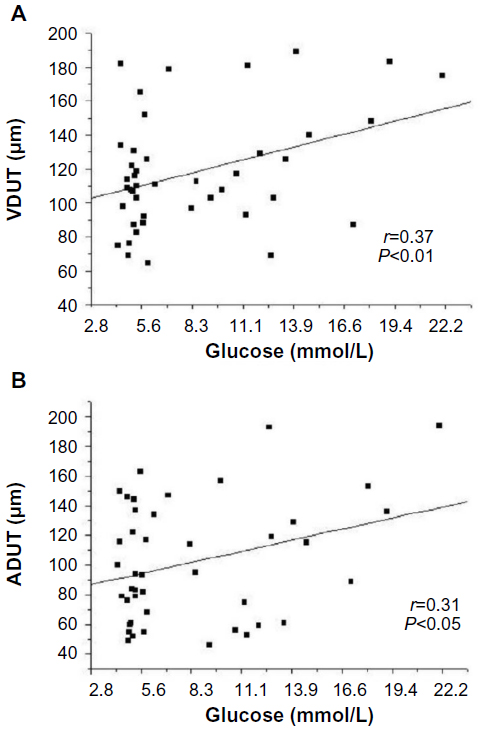 | Figure 2 Linear regression between blood glucose level and VDUT (A) and ADUT (B). |
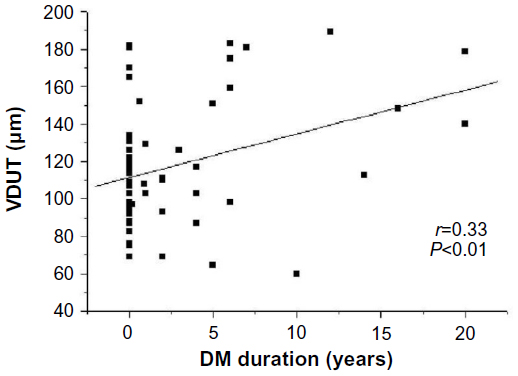 | Figure 3 Linear regression between duration of DM and VDUT. |
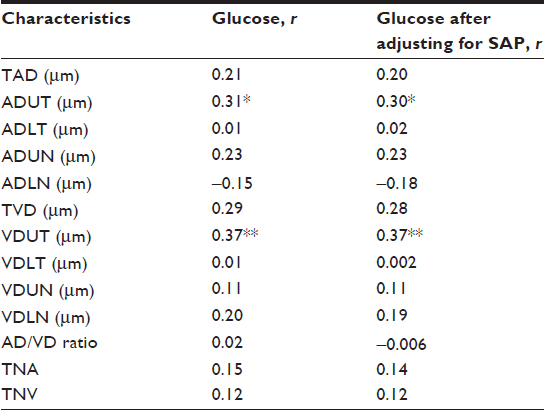 | Table 4 Correlation between blood glucose level and retinal microvascular parameters before and after adjusting for SAP |
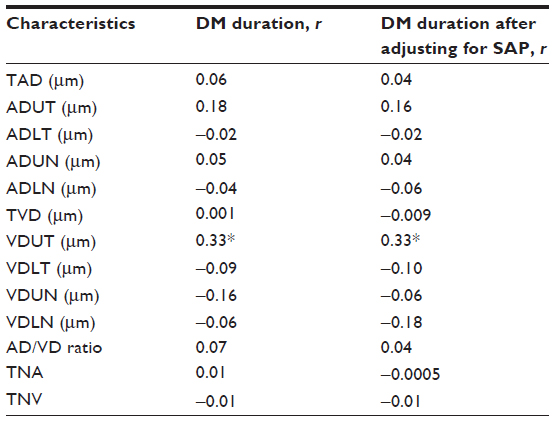 | Table 5 Correlation between DM duration and the retinal microvascular parameters before and after adjusting for SAP |
Discussion
Aiming at minimizing the limitations in the qualitative forms of diagnosing DR, it was observed in the literature that researchers have looked for different methods to quantify retina microvascularity. The quantitative methods intend to measure the diameter in the retina vessels,8 estimate the equivalent diameter in the central retina artery and central retina vein,15 and measure blood flow.16
The quantitative analysis of retinal microvasculature in the present study revealed that patients with diabetes exhibited larger retinal vessel diameters, specifically in the upper temporal quadrant relative to the lower temporal quadrant. Previous population studies have shown a significant increase in arteriole and venule diameters in individuals with diabetes.8,17
Changes in retinal microvasculature were found in the upper temporal quadrant in the early stage of the disease, but the lower temporal quadrant, which is responsible for supplying the macula, was spared. This difference was most likely due to a differential regulation of blood flow. The inferior temporal quadrant of the retina is, in comparison with the superior temporal region, less responsive to vasodilation.18 One study in children with diabetes showed that the superior temporal vein was dilated more than the inferior temporal vein, which suggests that vasodilation could precede other signs of DR.19 Blood flow increases during the initial stages of DR, and retinal blood flow decreases during more severe stages (proliferative DR) due to a reduction in arterial blood flow. Grunwald et al16 analyzed retinal blood flow in patients with diabetes and found that venous blood flow was greater in the upper retina than in lower retina. Changes in upper temporal venule diameter can occur at early stages of diabetes before the onset of retinopathy. Therefore, the early identification of these changes would allow control measures and treatments to be adopted sooner. The quantitative method identified changes in VDUT in patients with diabetes and showed the absence of these changes in patients without diabetes. This analysis provided an early diagnosis of DR in a simple and reliable manner. Other methods can perform this assessment,20,21 but these methods are often costly and complex complicating the assessment of patients in locations that lack resources. Therefore, the method in the present study can be a useful tool for early diagnosis.
The most important risk factors for the development of DR are DM duration, poor metabolic control, and hypertension.22 Our study showed that patients with diabetes for 5 years or more exhibited significant changes in VDUT, and VDUT was greater in these individuals than in individuals with diabetes for less than 5 years and in individuals without diabetes (controls). DM duration appeared to directly affect the development of DR, which is consistent with Moloney and Drury’s findings23 that a positive correlation between DM duration and DR exists. Population-based studies have shown a positive association between DM duration and the prevalence and severity of DR.24,25 The increase in retinal vein diameter is greater in patients who have had DM for a longer duration, and retinal microvasculature changes can be useful for an early DM diagnosis.26,27 The prevalence of DR is strongly associated with DM duration.28,29
Retinal microvasculature parameters are related to age, arterial pressure, blood glucose level, and other factors. Only blood glucose level was positively correlated with VDUT after adjusting for SAP, and AP did not affect this correlation. Therefore, blood glucose control is the primary modifiable risk factor for the prevention of DR onset and progression.30,31 The present results showed that DM duration remained positively correlated with VDUT, even after adjusting for SAP.
Blood glucose level and the estimated DM duration correlated with VDUT, and the estimated DM duration was an independent predictor that explained ~23% of the venodilation in the upper temporal quadrant. Multiple regression and multivariate analyses have shown that DM duration is the most important risk factor for DR, and it is associated with changes in venule diameter.15
The quantification of retinal microvasculature can be a useful tool for the detection of early microvascular changes in the retinas of patients with diabetes. The quantitative method in the present study showed vasodilation, especially in the venular bed, of the upper temporal quadrant in patients with diabetes. The main risk factors of the described venule changes were blood glucose level and the duration of DM. The early diagnosis of DR and the detection of risk factors are indispensable for the prevention of this incapacitating complication of DM. More longitudinal prospective studies will be needed to further explore the findings of this study.
Disclosure
The authors report no conflicts of interest in this work.
References
Buch H, Vinding T, Nielsen NV. Prevalence and causes of visual impairment according to World Health Organization and United States Criteria in an aged, urban Scandinavian population. Ophthalmology. 2001;108(12):2347–2357. | |
Curtis TM, Scholfield CN. The role of lipids and protein kinase Cs in the pathogenesis of diabetic retinopathy. Diabetes Metab Res Ver. 2004;20(1):28–43. | |
Cockburn DM. Diabetic retinopathy: classification, description and optometric management. Clin Exp Optom. 1999;82(2–3):59–73. | |
Cooper ME, Bonnet F, Oldfield M, Jandeleit-Dahm K. Mechanisms of diabetic vasculopathy: an overview. Am J Hypertens. 2001;14(5 Pt 1):475–486. | |
Pournaras CJ, Rungger-Brändle E, Riva CE, Hardarson SH, Stefansson E. Regulation of retinal blood flow in health and disease. Prog Retin Eye Res. 2008;27(3):284–330. | |
Haefliger IO, Meyer P, Flammer J, Lüscher TF. The vascular endothelium as a regulator of the ocular circulation: a new concept in ophthalmology? Surv Ophthalmol. 1994;39(2):123–132. | |
Crosby-Nwaobi R, Heng LZ, Sivaprasad S. Retinal vascular calibre, geometry and progression of diabetic retinopathy in type 2 diabetes mellitus. Ophthalmologica. 2012;228(2):84–92. | |
Islam FM, Nguyen TT, Wang JJ, et al. Quantitative retinal vascular calibre changes in diabetes and retinopthy: the Singapore Malay eye study. Eye. 2009;23:1719–1724. | |
Alder VA, Su EN, Yu DY, Cringle SJ, Yu PK. Diabetic retinopathy: early functional changes. Clin Exp Pharmacol Physiol. 1997;24(9–10):785–788. | |
Taylor E, Dobree JH. Proliferative diabetic retinopathy. Br J Ophthalmol. 1970;54(8):11–18. | |
Klein R, Klein BE, Moss SE, et al. The relation of retinal vessel caliber to the incidence and progression of diabetic retinopathy. XIX: The Wisconsin Epidemiologic Study of Diabetic Retinopathy. Arch Ophthalmol. 2004;122(1):76–83. | |
Mion Jr D, Machado CA, Gomes MA, et al. IV Diretrizes Brasileiras de Hipertensão Arterial [Brazilian guidelines in arterial hypertension]. Arq Bras Cardiol. 1991;56(Suppl A):A1–A16. | |
Jonas JB, Papastathopoulos. Ophthalmoscopic measurement of the optic disc. Ophthalmology. 1995;102(7):1102–1106. | |
Stanton AV, Mullaney P, Mee F, O’Brien ET, O’Malley K. A method of quantifying retinal microvascular alterations associated with blood pressure and age. J Hypertens. 1995;13(1):41–48. | |
Klein R, Meyers CE, Lee KE, Ganong R, Klein BE. Changes in retinal vessel diameter and incidence and progression of diabetic retinopathy. Arch Ophthalmol. 2012;130(6):749–755. | |
Grunwald JE, Riva CE, Baine J, Brucker AJ. Total retinal volumetric blood flow rate in diabetic patients with poor glycemic control. Invest Ophthalmol Vis Sci. 1992;33(2):356–363. | |
Tikellis G, Wang JJ, Tapp R, et al. The relationship of retinal vascular caliber to diabetes and retinopathy: the Australian Diabetes, Obesity and Lifestyle (AusDiab) study. Diabetologia. 2007;50(11):2263–2271. | |
Chung HS, Harris A, Halter PJ, et al. Regional differences in retinal vascular reactivity. Invest Ophthalmol Vis Sci. 1999;40(10):2448–2453. | |
Falck A, Laatikainen L. Retinal vasodilation and hyperglycaemia in diabetic children and adolescents. Acta Ophthalmol Scand. 1995;73(2):119–124. | |
Euvrard G, Genevois O, Rivals I, et al. A semiautomated computer tool for the analysis of retinal vessel diameter dynamics. Comput Biol Med. 2013;43(5):513–523. | |
Mirsharif Q, Tajeripour F, Pourrreza H. Automated characterization of blood vessels as arteries and veins in retinal images. Comput Med Imaging Graph. 2013;37:607–617. | |
Yau JW, Rogers SL, Kawasaki R, et al; Meta-Analysis for Eye Disease (META-EYE) Study Group. Global prevalence and major risk factors of diabetic retinopathy. Diabetes Care. 2012;35(3):556–564. | |
Moloney J, Drury MI. Retinopathy and retinal function in insulin-dependent diabetes mellitus. Br J Ophthalmol. 1982;66(12):759–761. | |
West SK, Klein R, Rodriguez J, et al. Diabetes and diabetic retinopathy in a Mexican-American population. Diabetes Care. 2001;24(7):1204–1209. | |
Haddad OA, Saad MK. Prevalence and risk factors for diabetic retinopathy among Omani diabetics. Br J Ophthalmol. 1998;82(8):901–906. | |
Irving RJ, Walker BR, Noon JP, Watt GC, Webb DJ, Shore AC. Microvascular correlates of blood pressure, plasma glucose, and insulin resistance in health. Cardiovasc Res. 2002;53(1):271–276. | |
Wong TY. Retinal vessel diameter as a clinical predictor of diabetic retinopathy progression: time to take out the measuring tape. Arch Ophthalmol. 2011;129(1):95–96. | |
Stratton IM, Kohner EM, Aldington SJ, et al; for the UKPDS Group. UKPDS 50: risk factors for incidence and progression of retinopathy in the type II diabetes over 6 years from diagnosis. Diabetologia. 2001;44(2):156–163. | |
American Diabetes Association. Diabetic retinopathy. Diabetes Care. 2002;25:S90–S93. | |
Looker HC, Krakoff J, Knowler W, Bennett PH, Klei R, Hanson RL. Longitudinal studies of incidence and progression of diabetic retinopathy assessed by retinal photography in Pima Indians. Diabetes Care. 2003;26(2):320–326. | |
Shichiri M, Kishikawa H, Ohkubo Y, Wake N. Long-term results of the Kumamoto study on optimal diabetes control in type 2 diabetic patients. Diabetes Care. 2000;23(Suppl 2):B21–B29. |
 © 2015 The Author(s). This work is published and licensed by Dove Medical Press Limited. The
full terms of this license are available at https://www.dovepress.com/terms
and incorporate the Creative Commons Attribution
- Non Commercial (unported, 3.0) License.
By accessing the work you hereby accept the Terms. Non-commercial uses of the work are permitted
without any further permission from Dove Medical Press Limited, provided the work is properly
attributed. For permission for commercial use of this work, please see paragraphs 4.2 and 5 of our Terms.
© 2015 The Author(s). This work is published and licensed by Dove Medical Press Limited. The
full terms of this license are available at https://www.dovepress.com/terms
and incorporate the Creative Commons Attribution
- Non Commercial (unported, 3.0) License.
By accessing the work you hereby accept the Terms. Non-commercial uses of the work are permitted
without any further permission from Dove Medical Press Limited, provided the work is properly
attributed. For permission for commercial use of this work, please see paragraphs 4.2 and 5 of our Terms.