
Back to Journals » Diabetes, Metabolic Syndrome and Obesity » Volume 19
Changes in IL-1β and Pancreatic Islet Function and Their Correlation Before and After Weight Loss in Obese Individuals
Authors Guo X  , Leng M , Hou D, Li Z, Gao X, Li C
Received 15 December 2025
Accepted for publication 13 June 2026
Published 10 July 2026 Volume 2026:19 574992
DOI https://doi.org/10.2147/DMSO.S574992
Checked for plagiarism Yes
Review by Single anonymous peer review
Peer reviewer comments 4
Editor who approved publication: Professor Melissa Olfert
Xiaoxuan Guo,1 Mingxin Leng,2 Dangmin Hou,3 Zhouhuiling Li,3 Xinying Gao,3 Chunjun Li1
1Department of Health Management Center, Tianjin Union Medical Center, The First Affiliated Hospital of Nankai University, Tianjin, People’s Republic of China; 2Graduate School, Tianjin Medical University, Tianjin, People’s Republic of China; 3Graduate School, Tianjin University of Traditional Chinese Medicine, Tianjin, People’s Republic of China
Correspondence: Chunjun Li, Department of Health Management Center, Tianjin Union Medical Center, The First Affiliated Hospital of Nankai University, No. 190 of Jieyuan Road, Hongqiao District, Tianjin, 300121, People’s Republic of China, Tel +86-22-13752090635, Email [email protected]
Purpose: This study aims to investigate changes in interleukin-1β (IL-1β) and pancreatic function before and after weight loss in obese individuals undergoing lifestyle interventions, as well as the relationship between these two factors, thereby providing scientific evidence for the comprehensive management of obesity and related metabolic disorders.
Patients and Methods: This observational study included 36 obese patients who completed a lifestyle intervention program, along with 18 healthy controls. Glucose metabolism parameters and IL-1β levels were measured at baseline and after intervention. Normally distributed variables were analyzed using independent or paired samples t-tests, while non-normally distributed variables were analyzed using Mann–Whitney U and Wilcoxon signed-rank tests. Spearman correlation analysis was performed to assess bivariate relationships. Subsequently, multivariate linear regression models were employed to adjust for potential confounders and to evaluate the independent associations between ΔIL-1β and pancreatic function indices.
Results: IL-1β levels were significantly correlated with both obesity indicators and insulin resistance parameters. Notably, after adjusting for confounding factors, changes in IL-1β levels (ΔIL-1β) showed significant independent associations with changes in the modified beta cell function index (ΔMBCI), homeostatic model assessment of insulin resistance (ΔHOMA-IR), and Stumvoll metabolic clearance rate of glucose (ΔStumvoll MCR120).
Conclusion: The reduction in IL-1β levels is independently associated with improvements in pancreatic β-cell function and insulin resistance, suggesting a potential role of IL-1β in the metabolic benefits of weight loss. However, the study’s small sample size limits the statistical power, warranting validation in larger cohorts.
Keywords: obesity, IL-1β, islet function, correlation analysis
Introduction
Obesity has become a global epidemic and a significant public health concern. According to the latest research data from 2022, 43% of adults worldwide are overweight, and nearly 890 million people are obese. Projections indicate that, by 2030, more than half of the global population will be affected by being overweight or obese.1 China’s obesity epidemic is intensifying as well, with a pronounced trend toward earlier onset and more severe cases.
Obesity is defined by excessive fat accumulation, involving both adipocyte hypertrophy and hyperplasia. Adipose tissue acts not only as an energy reservoir but also as a critical endocrine organ that regulates systemic metabolism.2,3 Excess adiposity, especially visceral obesity, disrupts metabolic homeostasis and triggers chronic low-grade inflammation, core driver of insulin resistance and pancreatic β-cell dysfunction.3 Obesity-related inflammation is driven mainly by adipose tissue macrophage infiltration, inflammasome activation, and immune cell dysregulation.
IL-1β is a crucial cytokine with extensive physiological and pathological effects, playing a key role in immune responses, inflammatory regulation, and metabolic processes. In obese states, endogenous danger signals including free fatty acids, cholesterol crystals, reactive oxygen species, and uric acid activate the NLRP3 inflammasome, which consists of NLRP3, ASC, and caspase-1.4,5 Among these, Caspase-1 cleaves the precursor IL-1β to generate mature IL-1β.6 Mounting evidence confirms that IL-1β impairs insulin signaling and promotes β-cell dysfunction, thereby contributing to the pathogenesis of type 2 diabetes mellitus (T2DM).7 Elevated circulating IL-1β levels are consistently reported in individuals with obesity and T2DM, and glucose itself can stimulate IL-1β production from pancreatic β-cells, forming a deleterious feed‑forward loop.8 While IL-1β contributes to pathological inflammation, emerging evidence also indicates its physiological role in early-phase insulin secretion. IL-1β can mediate cephalic‑phase insulin release via the vagus nerve and central immune activation, and locally modulate insulin secretion from β-cells through nuclear factor-κB (NF-κB) and mitogen-activated protein kinase (MAPK) pathways.9 It is noteworthy that human pancreatic islets express significantly fewer IL-1RIs than mouse islets, prompting us to consider whether findings from animal studies can be extrapolated to humans.10
Numerous clinical studies have demonstrated that lifestyle‑induced weight loss reduces systemic inflammation, including lowering levels of IL‑6, TNF‑α, and CRP.11,12 Moreover, therapeutic blockade of IL‑1β signaling, such as with canakinumab or anakinra, improves glycemic control and β‑cell function in patients with T2DM.13,14 Chronic hyperglycemia has been shown to induce the expression of IL-1β in pancreatic β-cells through the activation of the NLRP3 inflammasome.15 This local inflammatory response triggers an autocrine loop that impairs insulin secretion and promotes β-cell apoptosis, a process often referred to as “glucotoxicity”.16 Despite these advances, human data on the dynamic changes in IL-1β following substantial non‑surgical weight loss and its independent association with detailed pancreatic islet function surrogates (including HOMA-IR, MBCI, and Stumvoll MCR120) remain limited.11 Furthermore, emerging studies suggest that IL-1β measured in circulating mononuclear cells can predict metabolic improvements following weight loss, underscoring the potential of IL-1β as a predictive biomarker.17 In addition, the validity and limitations of these surrogate indices should be acknowledged when interpreting metabolic improvements.18
Therefore, this study aimed to fill this clinical gap by investigating changes in IL-1β and pancreatic islet function before and after lifestyle-mediated weight loss in obese individuals, and to explore their correlation. The findings may provide evidence to support precision strategies for obesity and T2DM management.
Methods
Study Design and Participants Enrollment
This study is a retrospective cohort study. The population was drawn from patients attending the obesity clinic at the First Affiliated Hospital of Nankai University and individuals undergoing physical examinations at the Health Management Center between August 2022 and March 2023. Following inclusion criteria, 36 obese patients and 18 completely healthy individuals were ultimately enrolled (Figure 1). Inclusion Criteria: 1) age ≥ 18 years, 2) diagnosis of obesity at initial visit (based on BMI ≥ 28 according to Chinese obesity diagnostic criteria), 3) evidence of multi-organ insulin resistance (assessed by HOMA-IR > 2.69 using the steady-state model), 4) at least two documented visits, with the last visit occurring more than 6 months after the initial visit. Exclusion Criteria: 1) history of medication use during weight loss attempts, 2) presence of other inflammatory diseases, or use of anti-inflammatory drugs or hormonal therapy, 3) pregnancy or lactation, psychiatric disorders, or cognitive impairment, 4) refusal to provide informed consent, 5) participants with missing data. All of the above participants completed a screening history, physical examination, and standard blood tests. All participants completed screening history, physical examination, and standard blood tests. Written informed consent was obtained from all subjects. This study was conducted in accordance with the Declaration of Helsinki and approved by the Medical Ethics Committee of the First Affiliated Hospital of Nankai University, Tianjin, China (Ethics Approval No. 2021C06). The study was registered at www.chictr.org.cn (ChiCTR2100044305). Although the registration date was earlier than the actual recruitment period, the study design and endpoints remained consistent with the registered protocol.
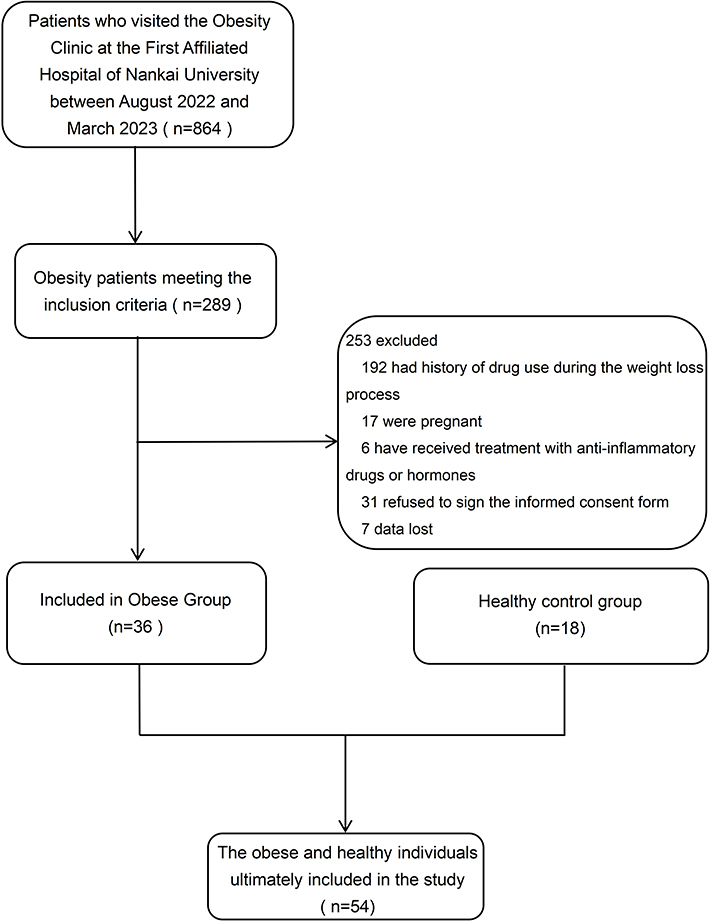 |
Figure 1 Study flowchart. |
Weight Loss Intervention
Our team implements scientifically grounded lifestyle intervention strategies for patients.19 Individualized weight management programs were provided under a four-division co-management model (endocrinologist, dietitian, kinesiologist, and health manager) to enhance adherence and motivation. All patients were required to reduce their calorie intake by 500 calories while meeting their daily energy requirements. The calculation formula was: Total daily calorie intake = Basal Metabolic Rate × Physical Activity Factor - 500 kcal. The physical activity factor is usually 1.2. While meeting the energy gap, achieve a balanced supplementation of 45% carbohydrates, 25% protein and 30% fat for each meal of the day.
Moderate- intensity aerobic exercise was recommended for 40 minutes per day, 5 days per week, combined with 15 minutes of resistance training 3 days per week. Participant attendance and compliance were recorded at each follow-up visit. No participant withdrew from the intervention, and no major adverse events related to the program were reported. No objective adherence measures (eg, dietary records, accelerometry) were collected; compliance was assessed via follow-up attendance.
Anthropometric and Body Composition Assessment
After an overnight fast, participants were instructed to undergo height and weight measurements in lightweight attire and barefoot conditions, ensuring precision to 0.1 cm for height and 0.1 kg for weight. Subsequently, BMI was computed based on these precise measurements. In the same condition, all subjects underwent body composition analysis using the InBody770 body composition analyzer (Bio-space Inc., South Korea). Subjects stood in the analyzer with hands and feet aligned to the four electrodes, maintaining an upright position throughout the test. This analysis allows the detection of parameters such as fat mass (FM), waist circumference (WC), hip circumference (HC), waist-hip ratio (WHR), percent of body fat (PBF), visceral fat area (VFA), skeletal muscle mass (SMM), skeletal muscle index (SMI).
Biochemical Measurements
Fasting blood samples were taken via venipuncture upon overnight fasting, centrifuged within 12 hours and if not analyzed immediately, plasma samples were stored at −80°C. In this study, fasting plasma glucose (FPG), alanine aminotransferase (ALT), aspartate aminotransferase (AST), triglyceride (TG), total cholesterol (TC), low density lipoprotein cholesterol (LDL-C) and high-density lipoprotein cholesterol (HDL-C) were analyzed using an automated biochemical analyzer (TBA120FR, Toshiba, Japan). Hemoglobin A1c (HbA1c) was assessed through high-performance liquid chromatography. Fasting insulin (FINS) was detected by chemiluminescence immunoassay. C-reactive protein (CRP) was determined by immunoturbidimetric assay. IL-1β was measured by single-wash sandwich enzyme-linked immunosorbent assay (ELISA) (Human IL-1β ELISA Kit ab214025, Abcam). Quantitate human IL-1β with 5.64 pg/mL sensitivity.
Oral Glucose Tolerance Test
After subjects fasted for 12 hours overnight, they were advised to arrive at the hospital by 7:00. Subjects ingested a 75 g glucose drink, and additional blood samples were collected at 0, 60 and 120 min after glucose ingestion to determine plasma glucose, insulin. Oral glucose tolerance test at baseline and at the end of the 6-month weight loss program in the obese population, whether or not the OGTT was performed at the time of the review during this period depends on the doctor’s recommendation. The healthy control group only underwent fasting blood tests without OGTT, so OGTT- related parameters are marked as “–” in the table.
Calculation of Indicators Related to Pancreatic Islet Function
The homeostasis model assessment for beta cell function index (HOMA-β), modified beta cell function index (MBCI), total AUC Ins/Glu (Tot AUCIGI), homeostatic model assessment for insulin resistance (HOMA-IR), visceral adiposity index (VAI), lipid accumulation product (LAP), triglycerides × fasting glucose (TyG), quantitative insulin sensitivity check index (QUICKI), Matsuda Index, Stumvoll metabolic clearance rate of glucose (Stumvoll MCR120) were used to assess β cell function and insulin sensitivity, respectively,20–22 and were calculated using the equations.
HOMA-β = FINS, µIU/mL × 360/ (FPG, mg/dL-63)
MBCI = (FINS, µIU/mL × FPG, mmol/L)/ (I120, µIU/mL +G120, mmol/L-2FPG, mmol/L)
Tot AUCIGI = AUC Insulin / AUC Glucose
AUC Insulin = I0, µIU/mL/2 + I60, µIU/mL + I120, µIU/mL/2
AUC Glucose = G0, mmol/L/2 + G60, mmol/L + G120, mmol/L/2
HOMA-IR= (FINS, µIU/mL × FPG, mmol/L) / 22.5
VAI: Men= (WC, cm / (39.68 + 1.88 × BMI, kg/m2)) × (TG, mmol/L / 1.03) × (1.31 / HDL-C, mmol/L),
Women= (WC, cm / (36.58 + 1.89 × BMI, kg/m2)) × (TG, mmol/L / 0.81) × (1.52 / HDL-C, mmol/L)
LAP: Men = (WC, cm - 65) × (TG, mmol/L), Women = (WC, cm −58) × (TG, mmol/L)
TyG: Ln [TG, mg/dL× FPG, mg/dL/2]
Matsuda Index= 10000 /√ [(G0, mmol/L×I0, µIU/mL) × (Gmean, mmol/L×Imean, µIU/mL)]
QUICKI=1 / (log10(FINS, µIU/mL) + log10(FPG, mg/dL))
Stumvoll MCR120 =19.240–0.281×BMI-0.00498×I120, pmol/L - 0.333×G120, mmol/L
The above mentioned: FINS: fasting plasma insulin, FPG: fasting plasma glucose, I0, I60 and I120 are the plasma concentration of insulin measured at 0, 60 and 120 minutes during OGTT, respectively, G0, G60 and G120 are the plasma concentration of glucose measured at 0, 60, and 120 minutes during OGTT, respectively, Imean: mean insulin concentration during OGTT, Gmean: mean plasma glucose concentration during OGTT, AUC: area under the curve, WC: waist circumference, TG: triglycerides, HDL-C: high-density lipoprotein cholesterol.
Statistical Analysis
Data analysis was conducted via SPSS statistical software (version 26.0, IBM Corp). Given the small sample size, continuous variables were tested for normality via the Shapiro‒Wilk test (S-W test). Results for variables meeting normal distribution were expressed as mean ± standard deviation (mean±SD), while those not meeting normal distribution were presented as median and interquartile range P50 (P25–P75). Count data are expressed as frequency (percentage) (n(%)). Paired samples t tests for normally distributed variables and Wilcoxon rank sum tests for nonnormally distributed variables were used to test for differences in the obese population before and after weight loss. Comparisons between the normal population and the obese population were made via the independent-sample t test for normally distributed variables or the Mann‒Whitney U-test for nonnormally distributed variables. Spearman correlation analysis was employed for the correlation analysis. The significance of correlations is expressed through p-values; p< 0.05 was considered statistically significant, whereas the significance of coefficients is denoted by r-values. Multiple linear regression was used to evaluate independent associations between ΔIL‑1β and changes in pancreatic islet function indices. Confounders were selected based on correlation strength: among correlated obesity indices (BMI, WC, WHR, FM, VFA) and muscle mass indices (SMM, SMI), the variable with the highest correlation coefficient (r) was included in the model. This data‑driven selection was adopted to reduce model complexity given the small sample size and is acknowledged as a methodological limitation. Multicollinearity was assessed using the variance inflation factor (VIF < 5).
Notably, this study has a small sample size (n = 36 obese participants, n = 18 controls), and no a priori power calculation was performed. Post hoc considerations indicate the sample is sufficient to detect moderate-to-strong correlations but may be underpowered for subtle effects. Given the exploratory design and multiple endpoints, no formal multiple testing correction was applied, which should be recognized as a limitation. Original data and analysis code are not publicly deposited, but all analyses are fully replicable based on the described methods.
Results
Participant Population and Baseline Characteristics
A total of 36 obese participants and 18 healthy controls were enrolled in this study. The baseline body composition characteristics of the study subjects are shown in Table 1. The selected healthy individuals had an age of 31.50 ± 7.18 years and a height of 169.50 ± 7.25 cm. Obese patients had an age of 32.94 ± 11.20 years and a height of 167.79 ± 8.26 cm, indicating similar age and height across both groups. The healthy group had a weight of 63.15 ± 7.61 kg and a BMI of 22.02 ± 2.03, while the obese patients had a weight of 105.25 ± 18.98 kg and a BMI of 37.25 ± 5.39, significantly higher than the healthy group (p < 0.001). Additionally, PBF, VFA, FM, WC, HC, WHR, SMM, and SMI were all significantly higher than those in the healthy control group (p<0.001). In healthy individuals, TC was 4.34±0.75, TG was 0.89±0.27, LDL-C was 2.45±0.57, HDL-C was 1.63±0.48, and FFA was 0.61 (0.51–0.72). In obese individuals, TC was 5.20±0.89, TG was 1.70 (1.27–2.34), LDL-C was 3.19±0.68, HDL-C was 1.24 ± 0.23, and FFA was 0.84 (0.69–1.03). Except for HDL-C being significantly lower than in the healthy group (p<0.001), all other lipid parameters, along with ALT and AST, were significantly higher than in healthy individuals (p<0.001). Despite similar age and height, obese individuals exhibit significant differences from healthy individuals in body composition characteristics such as weight, body fat, and visceral fat, as well as in biochemical indicators including blood lipids and liver function.
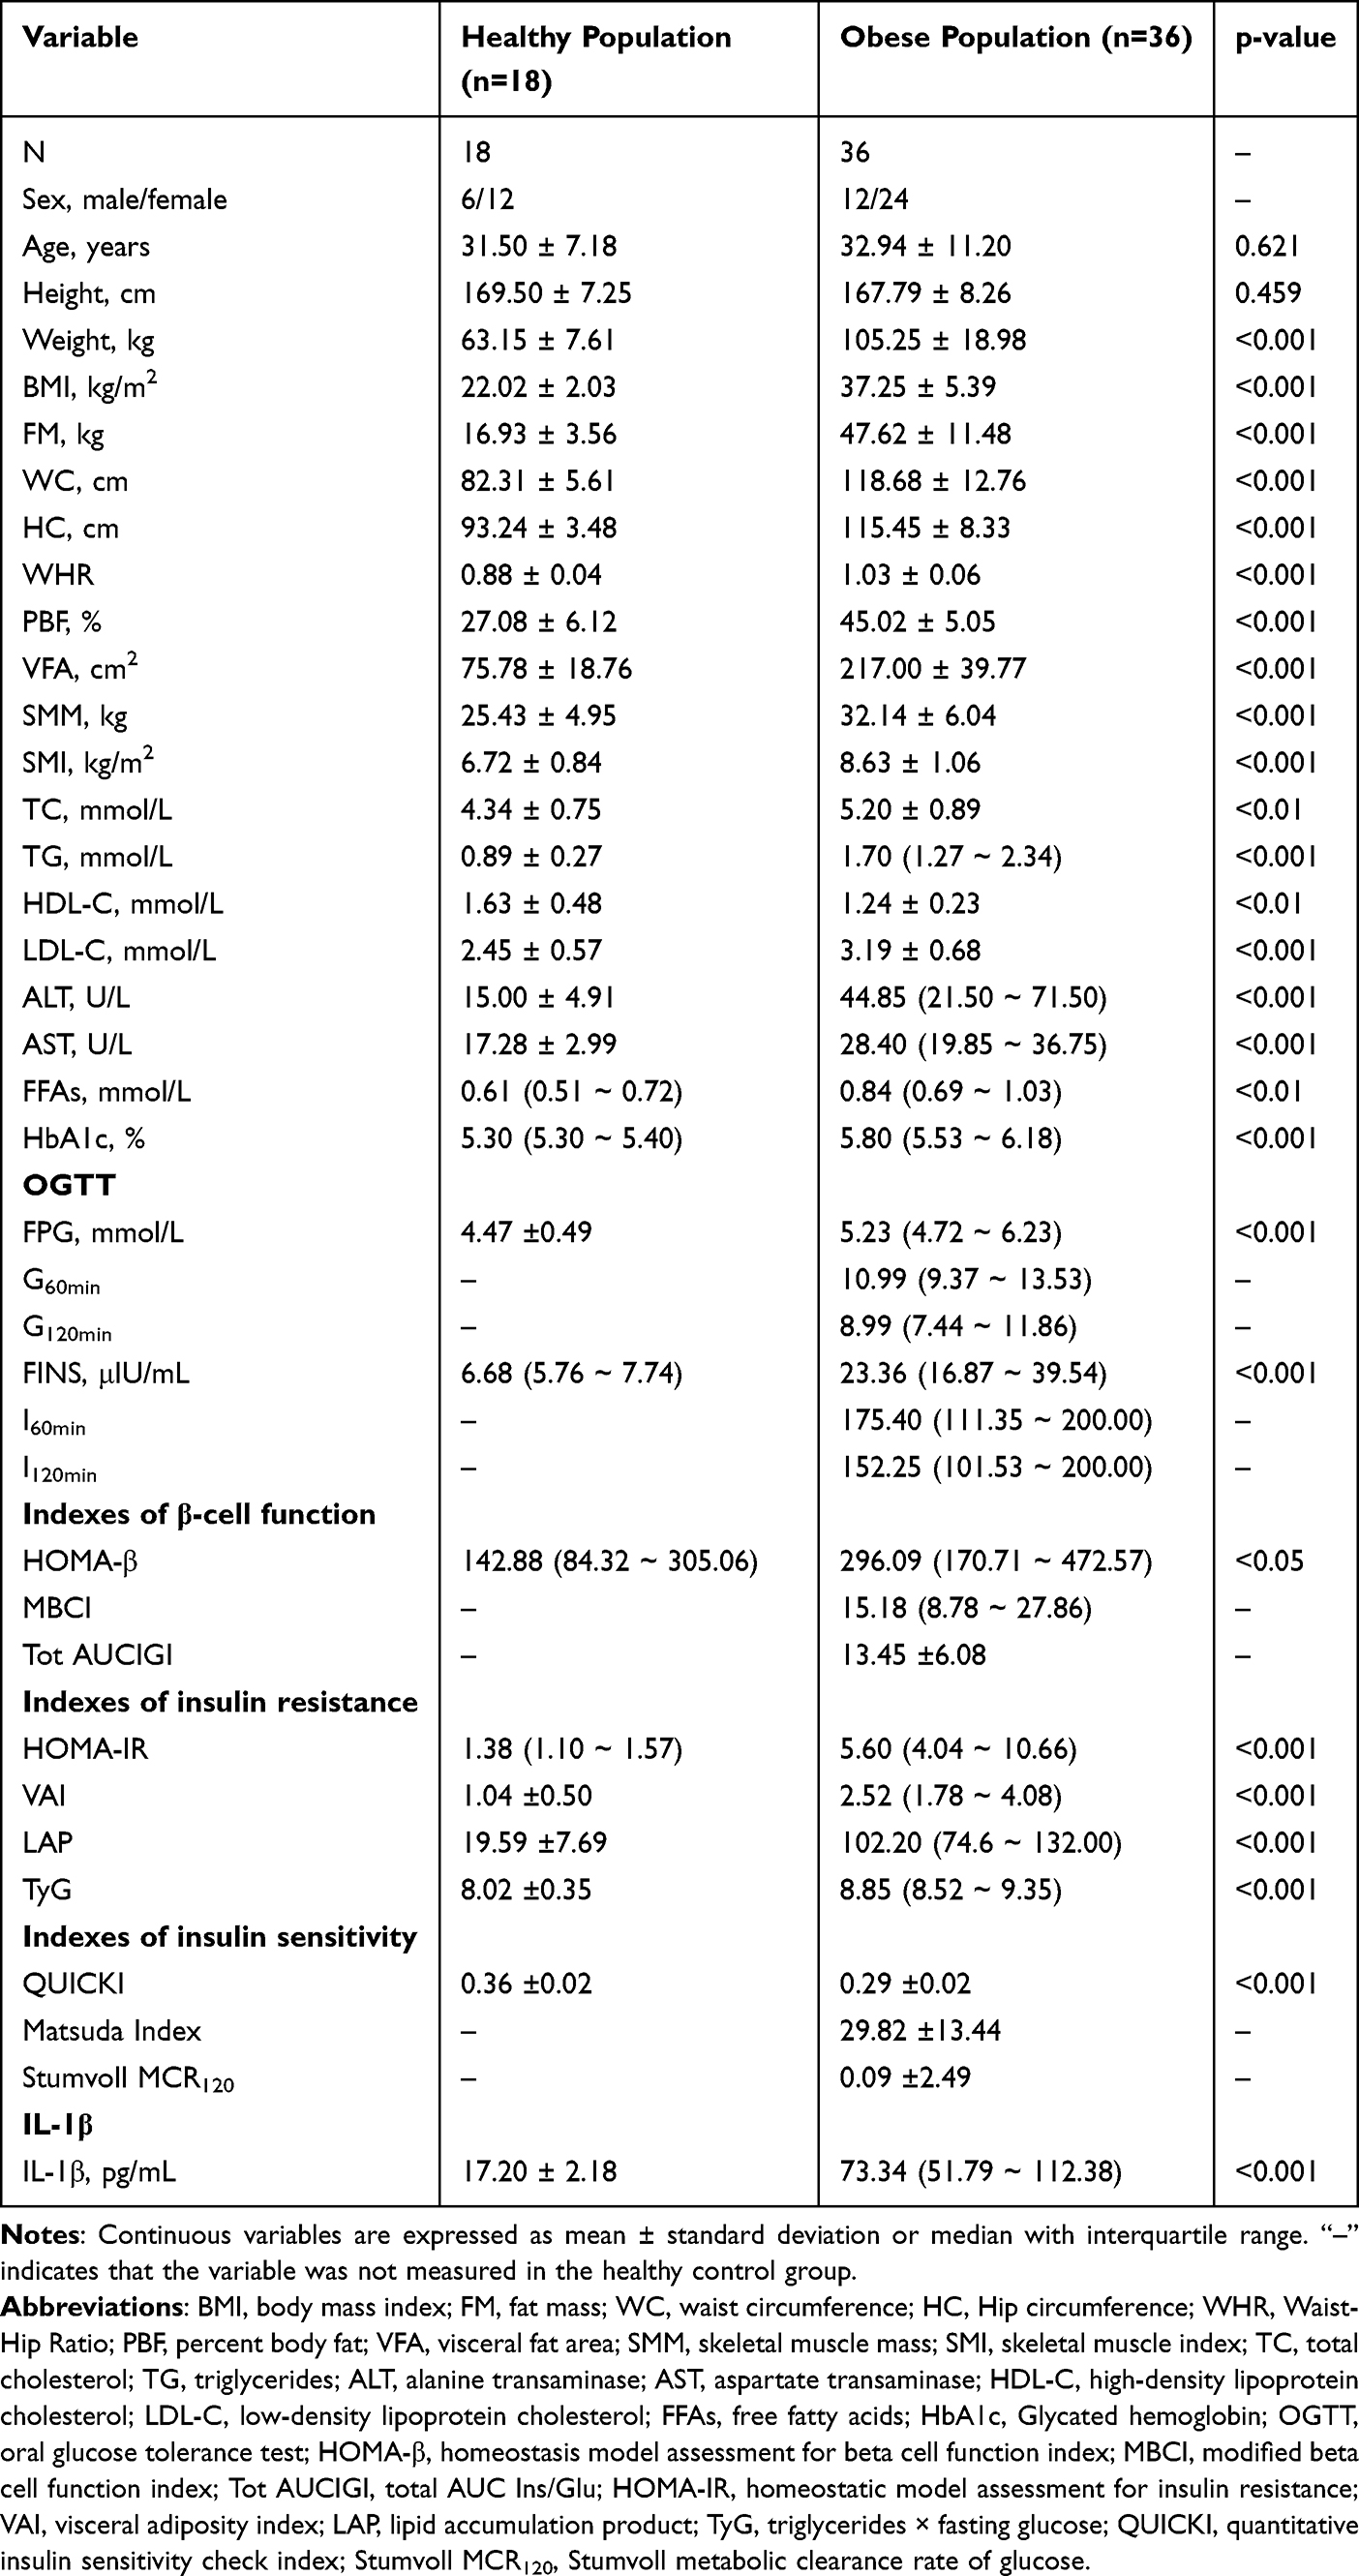 |
Table 1 Baseline Characteristics of Healthy and Obese Population |
Glucose metabolism and pancreatic function indicators are shown in Table 1. In the healthy group, FPG was 4.47 ± 0.49, FINS was 6.68 (5.76–7.74), and HbA1c was 5.30 (5.30–5.40). In the obese group, FPG was 5.23 (4.72–6.23), FINS was 23.36 (16.87–39.54), and HbA1c was 5.80 (5.53–6.18), all significantly higher than in the healthy group (p<0.001). Furthermore, all obese individuals underwent complete oral glucose tolerance tests, which demonstrated elevated blood glucose levels and insulin resistance. The healthy control group only provided fasting blood samples and did not undergo OGTT; thus, OGTT-derived parameters are marked as “–” in Table 1. Regarding pancreatic function indicators, obese individuals exhibited significantly elevated HOMA-β, HOMA-IR, VAI, LAP, and TyG values compared to healthy individuals, while QUICKI values were markedly reduced. This indicates that obese individuals of similar age and height to healthy individuals exhibit varying degrees of impaired glucose metabolism and pancreatic function. IL-1β levels in healthy individuals were 17.20 ± 2.18, while obese individuals exhibited significantly higher IL-1β levels at 73.34 (51.79–112.38) compared to healthy individuals (p < 0.001). This indicates a marked elevation of the inflammatory marker IL-1β in obese individuals.
Correlation Analysis of IL-1β with Baseline Body Composition and Biochemical Indicators
Baseline correlation analysis is shown in Figure 2. Except for a weak correlation between HOMA-β and IL-1β, BMI, WC, HC, WHR, PBF, VFA, SMM, SMI, HOMA-IR, VAI, LAP, TyG, and QUICKI all showed strong correlations with IL-1β (p < 0.01 or p < 0.001).
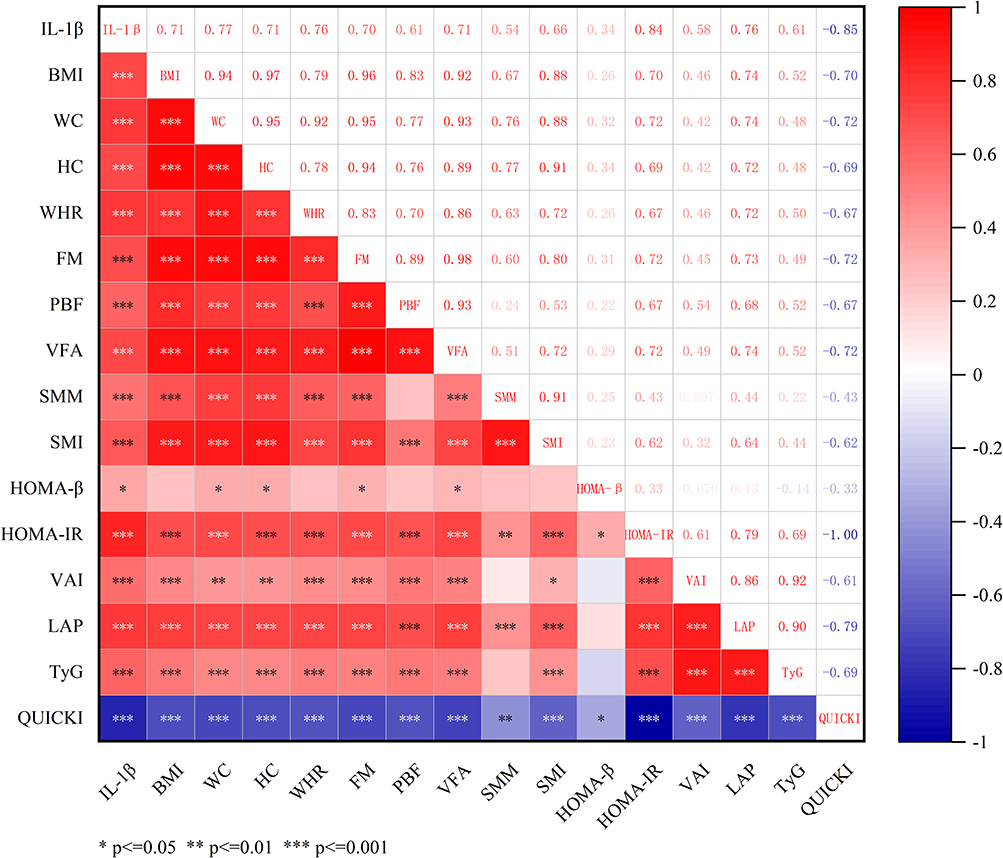 |
Figure 2 The heatmap of inflammatory markers in relation to body composition and islet function indicators.* p<=0. 05 ** p<=0. 01 *** p<=0. 001. Abbreviations: IL-1β, interleukin-1β; BMI, body mass index; WC, waist circumference; FM, fat mass; HC, Hip circumference; WHR, Waist-Hip Ratio; FM, fat mass; PBF, percent body fat; VFA, visceral fat area; SMM, skeletal muscle mass; SMI, skeletal muscle index; HOMA-β, homeostasis model assessment for beta cell function index; HOMA-IR, homeostatic model assessment for insulin resistance; VAI, visceral adiposity index; LAP, lipid accumulation product; TyG, triglycerides × fasting glucose; QUICKI, quantitative insulin sensitivity check index. |
Changes in Metabolic Markers Among Obese Individuals Before and After Weight Loss
Table 2 shows changes in body composition and biochemical indicators among obese individuals following a 6-month systematic dietary and lifestyle intervention. On average, the obese group lost 18.69 kg in weight, which represents a reduction of approximately 17.8%. BMI decreased by around 17.5%, TC by around 9.4%, and TG by around 42.5%. FM, WC, HC, WHR, PBF, VFA, SMM, SMI, LDL-C, ALT and AST also decreased significantly. Changes in glucose metabolism are shown in Table 2, with HbA1c levels decreasing compared to baseline. OGTT results indicated significant improvements in blood glucose and insulin levels compared to baseline. Changes in β-cell function indicators before and after weight loss are shown in Figure 3. It can be observed that HOMA-β showed no significant difference (p=0.414), indicating preserved basal β-cell function. MBCI decreased significantly (p<0.01) and Tot AUCIGI decreased significantly (p<0.05). Importantly, these reductions reflect reduced β-cell compensatory secretion burden due to improved insulin sensitivity, rather than impaired β-cell function. Changes in insulin resistance indicators are shown in Figure 3, QUICKI, a measure of insulin sensitivity based on fasting blood glucose, showed a significant increase (p<0.001). Mastuda index, derived from the OGTT, showed a significant increase (p<0.001), indicating enhanced insulin sensitivity, reduced postprandial blood glucose fluctuations, and decreased β-cell secretory stress. Stumvoll MCR120 levels significantly increased (p<0.001), indicating enhanced glucose clearance and improved insulin responsiveness in muscle and adipose tissues. Changes in IL-1β are shown in Figure 4. It can be seen that IL-1β levels decreased after weight loss (p<0.001). However, IL-1β levels remained higher than those in the normal population after weight loss (p<0.001).
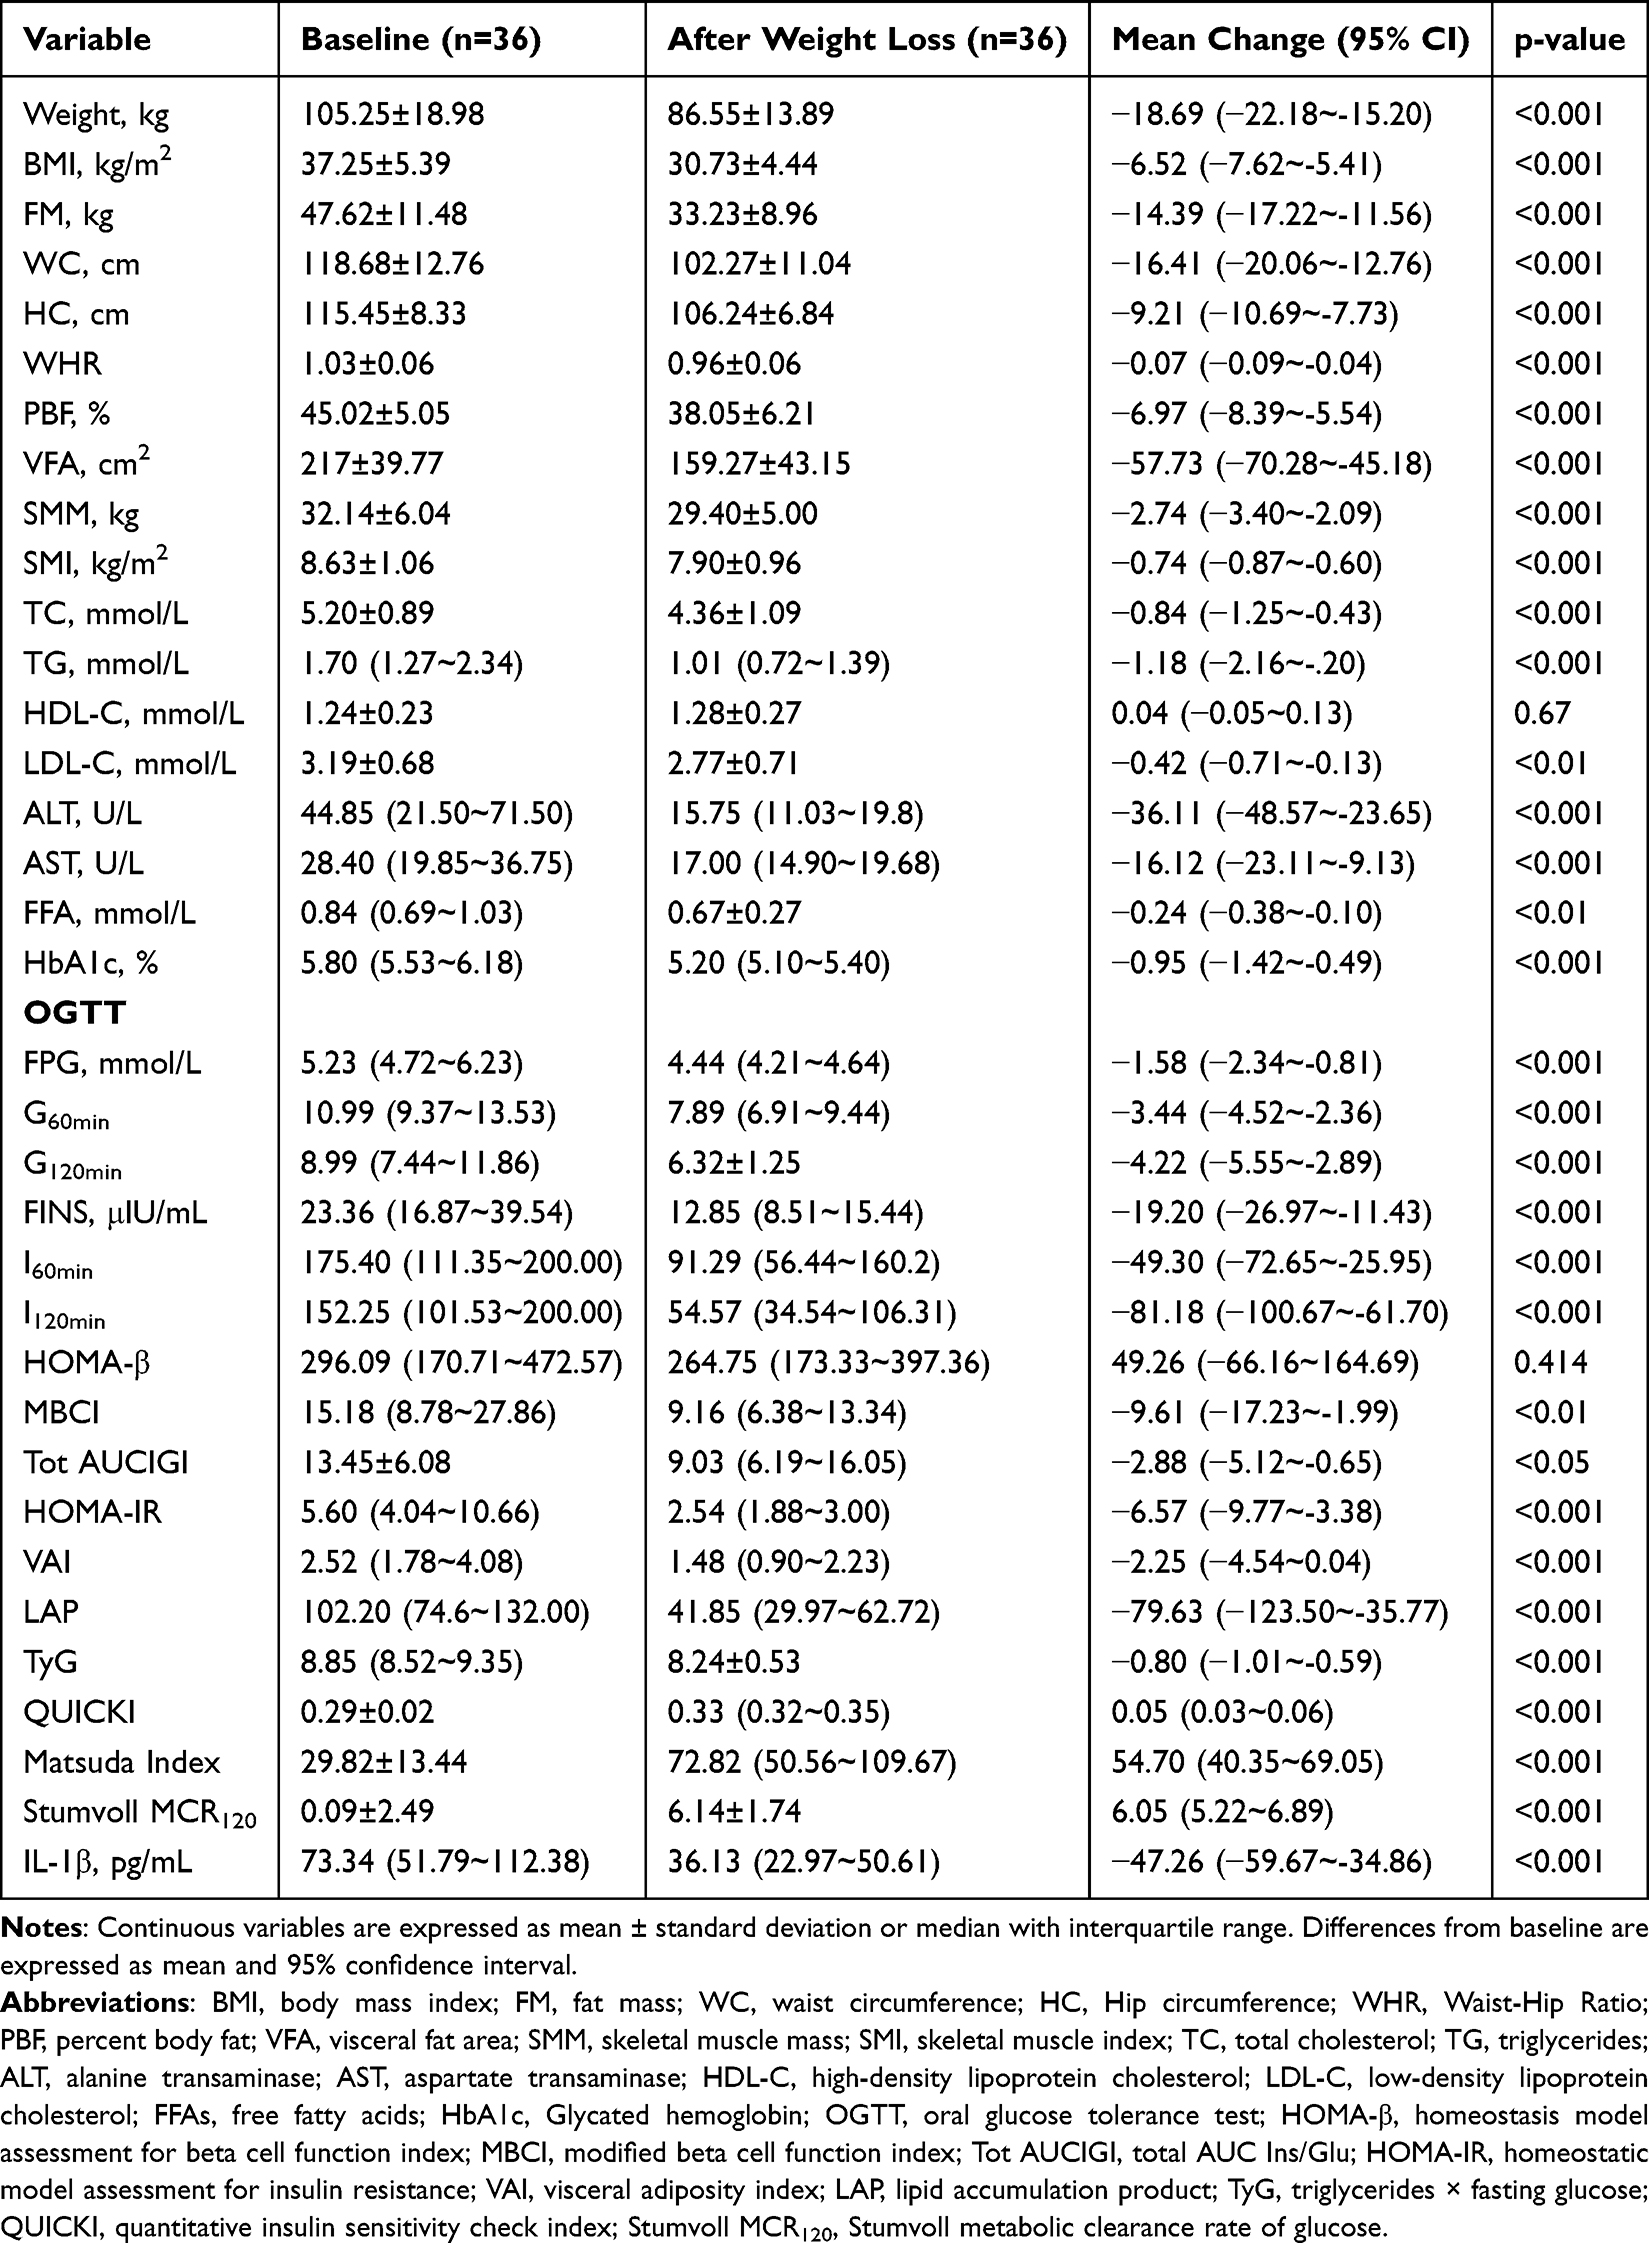 |
Table 2 Changes of Indexes Before and After Weight Loss in Obese People |
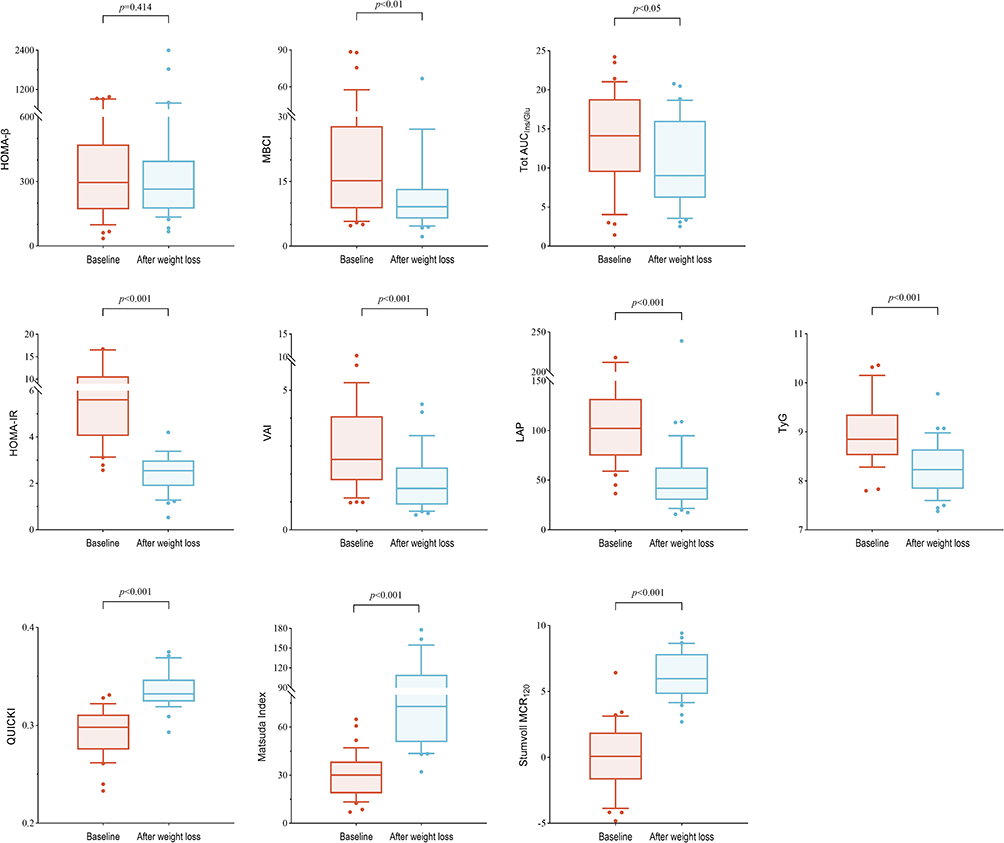 |
Figure 3 Changes in islet function levels before and after weight loss. Abbreviations: HOMA-β, homeostasis model assessment for beta cell function index; MBCI, modified beta cell function index; Tot AUCIGI, total AUC Ins/Glu; HOMA-IR, homeostatic model assessment for insulin resistance; VAI, visceral adiposity index; LAP, lipid accumulation product; TyG, triglycerides × fasting glucose; QUICKI, quantitative insulin sensitivity check index; Stumvoll MCR120, Stumvoll metabolic clearance rate of glucose. |
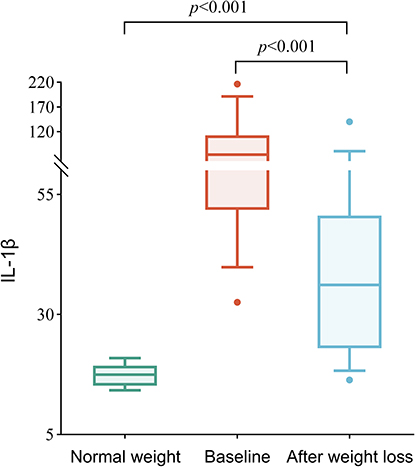 |
Figure 4 Changes in IL-1β levels before and after weight loss. Abbreviation: IL-1β, interleukin-1β. |
Correlation Analysis Between Changes in IL-1β Levels and Pancreatic Function Indicators Before and After Weight Loss
Correlation analysis between changes in IL-1β before and after weight loss and changes in pancreatic function indicators is shown in Table 3. Δ IL-1β showed significant positive correlations with Δ MBCI (r=0.424, p=0.0099) and Δ HOMA-IR (r=0.617, p=0.00006), while it showed a significant negative correlation with Δ QUICKI (r=−0.482, p=0.0029), Δ Matsuda Index (r=−0.366, p=0.0283), and Δ Stumvoll MCR120 (r=−0.680, p=0.000005).
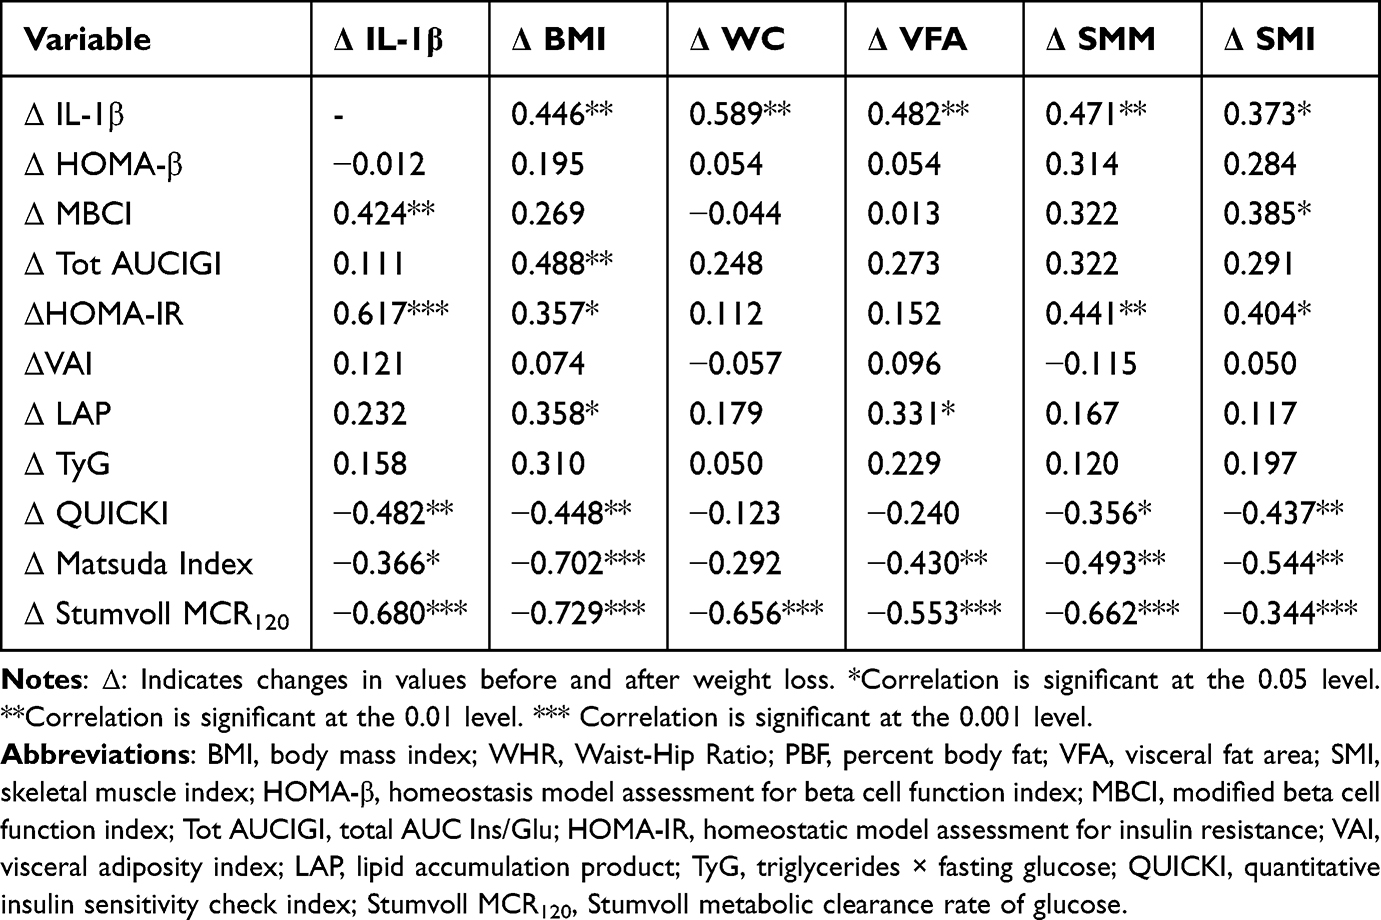 |
Table 3 Correlation Between Changes in IL-1β Levels and Indicators Related to Obesity and Islet Function After Weight Loss |
Pancreatic function indicators also correlate with certain clinical parameters. To ensure the independence of the association between IL-1β and pancreatic function, it is necessary to further exclude the interference of multicollinearity from other related indicators. Table 3 shows that Δ MBCI is significantly correlated with Δ SMI (r=0.385, p=0.02041), ΔHOMA-IR showed significant correlations with ΔBMI (r=0.357, p=0.03254), ΔSMM (r=0.441, p=0.0071), and ΔSMI (r=0.404, p=0.0145). Δ QUICKI and Δ BMI (r=−0.448, p=0.0062), Δ SMM (r=−0.356, p=0.0330), and Δ SMI (r=−0.437, p=0.0077) also exhibited significant correlations. Δ Matsuda Index correlated significantly with Δ BMI (r=−0.702, p=0.000002), Δ VFA (r=−0.430, p=0.0088), Δ SMM (r=−0.493, p=0.0022), and Δ SMI (r=−0.544, p=0.0006), Δ Stumvoll MCR120 showed significant correlations with Δ BMI (r=−0.729, p=0.000001), Δ WC (r=−0.656, p=0.00001), Δ VFA (r=−0.553, p=0.0004), Δ SMM (r=−0.662, p=0.00001), and Δ SMI (r=−0.598, p=0.0001). To avoid multicollinearity bias caused by VIF>5, duplicate obesity indicators and muscle mass indicators were screened, with results shown in Table 4. After adjusting for confounding factors, changes in IL-1β remained correlated with MBCI, HOMA-IR, and Stumvoll MCR120. Notably, although ΔQUICKI and Δ Matsuda Index showed significant bivariate correlations with ΔIL-1β (Table 3), these associations lost statistical significance after multivariate adjustment (Table 4). Whereas MBCI, HOMA-IR, and Stumvoll MCR120 respectively represent pancreatic β-cell function, insulin resistance, and insulin sensitivity. Therefore, the decrease in IL-1β levels following weight loss is independently associated with improved pancreatic function in obese individuals. The regression models explained moderate proportions of variance (adjusted R2 = 0.265–0.587), indicating additional unmeasured factors contribute to changes in pancreatic function.
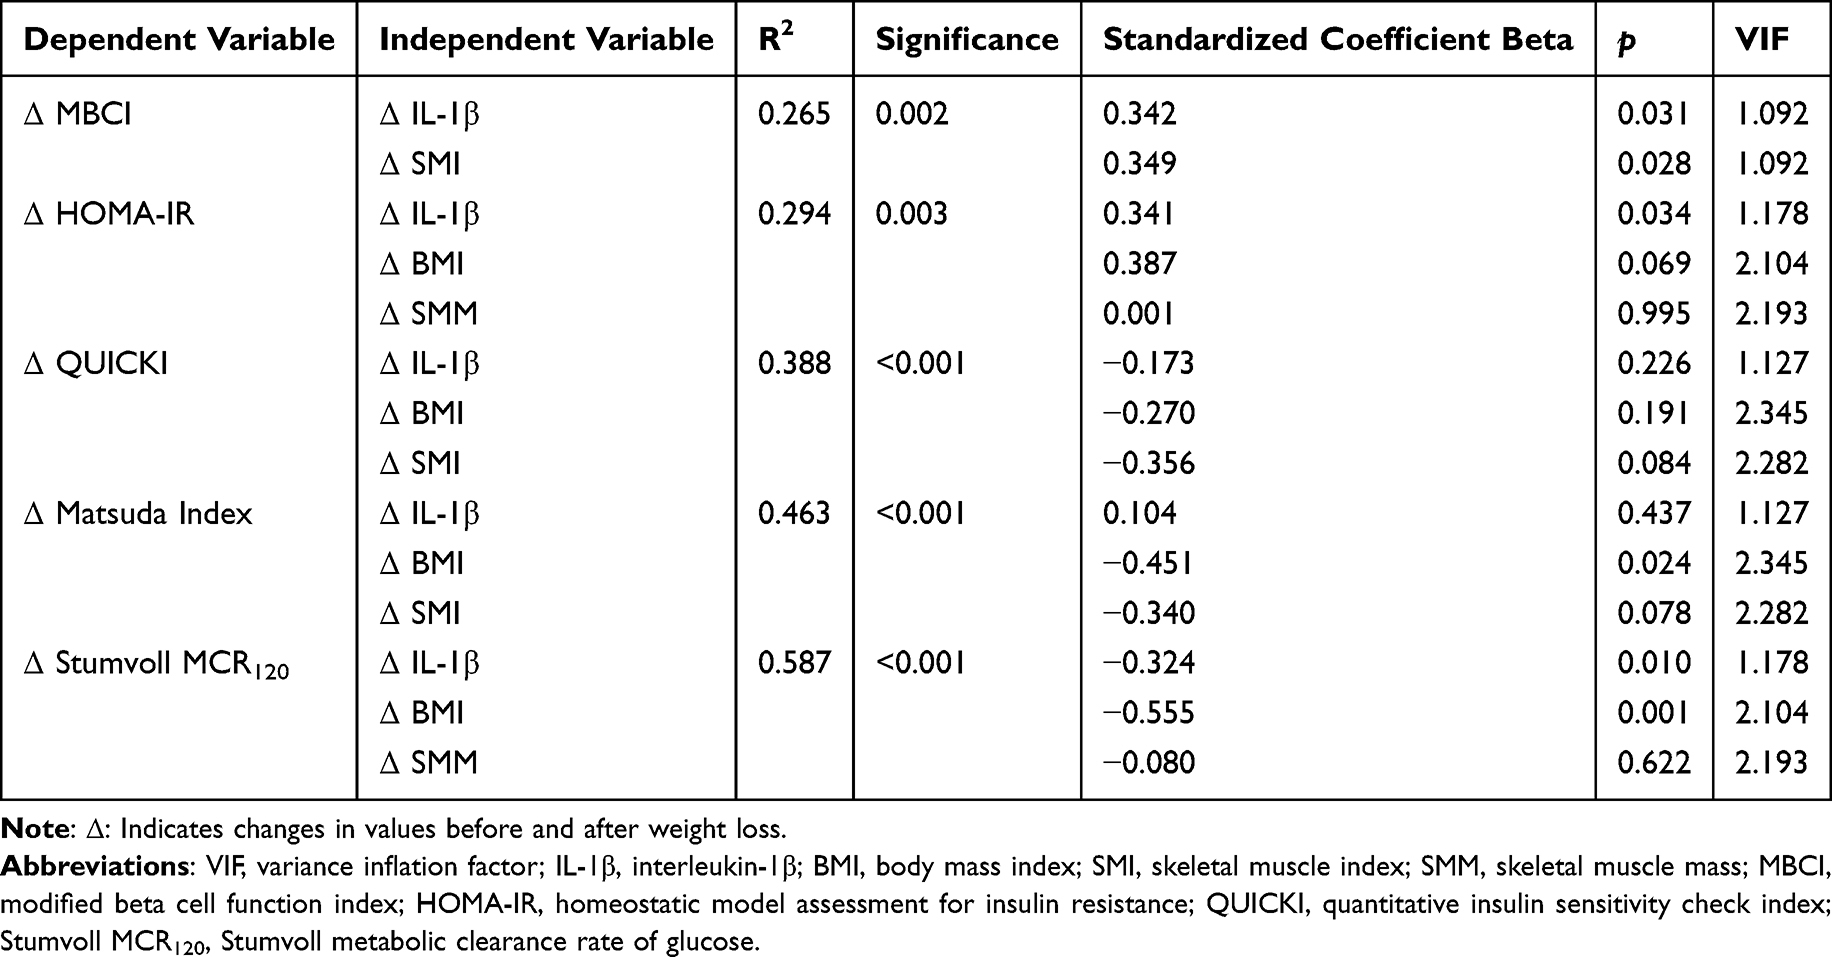 |
Table 4 Correction of Confounding Factors |
Discussion
Our study analyzed the associations between changes in IL-1β levels before and after weight loss and improvements in pancreatic function. We found that moderate weight loss achieved via lifestyle interventions in obese individuals is accompanied by significant reductions in circulating IL-1β and parallel improvements in multiple indices of insulin secretion, insulin resistance, and insulin sensitivity. Changes in IL-1β were significantly correlated with improvements in pancreatic function, and remained independently associated with changes in MBCI, HOMA-IR, and Stumvoll MCR120 after adjustment for body composition confounders. Our findings extend current knowledge by characterizing dynamic relationships between IL-1β and pancreatic function recovery following nonsurgical lifestyle-induced weight loss in a Chinese obese cohort. Given the observational design, these relationships reflect associations rather than proven causality.
Substantial evidence supports a central role of IL-1β in linking obesity-associated inflammation to pancreatic β-cell dysfunction and insulin resistance in type 2 diabetes.23 In vitro and clinical studies demonstrate that IL‑1β impairs glucose‑stimulated insulin secretion, promotes β‑cell apoptosis, and disrupts insulin signaling in peripheral tissues. Clinical trials further show that IL‑1β blockade improves glycemic control in patients with type 2 diabetes, supporting a causal role for IL‑1β in metabolic dysregulation.24–26 In the context of obesity, weight loss consistently reduces systemic inflammation, with greater reductions observed with weight loss exceeding 10–15%.27,28 While prior work has documented IL‑1β reductions following weight loss, few human studies have specifically linked changes in IL‑1β to dynamic pancreatic function indices after lifestyle intervention, particularly adjusted for adiposity and muscle mass.
Contemporary weight loss strategies aim not only to reduce body weight but also to mitigate visceral adiposity and chronic low‑grade inflammation. Consistent with previous reports, our participants achieved an average weight loss of 17.8%, exceeding the 5–10% threshold associated with meaningful metabolic benefits.28 This magnitude of weight loss was accompanied by marked reductions in visceral fat, improved insulin sensitivity, and reduced systemic inflammation. Notably, IL‑1β levels decreased significantly but remained higher than those in healthy controls, consistent with the concept of inflammatory memory in obesity, whereby epigenetic modifications in adipose tissue sustain pro‑inflammatory gene expression even after weight reduction.29,30 A key finding of this study is that Δ IL‑1β was independently associated with Δ MBCI, Δ HOMA‑IR, and Δ Stumvoll MCR120 after controlling for BMI, skeletal muscle mass, and visceral fat. These associations support the existence of an inflammation‑metabolic clearance axis and suggest that IL-1β may influence pancreatic function and insulin sensitivity beyond its effects on adiposity.17 While we observed strong correlations, our observational design cannot exclude residual confounding or bidirectional relationships. For example, improved insulin sensitivity may also reduce inflammatory burden, creating a reciprocal relationship between inflammation and metabolism. Interpretation of changes in pancreatic function indices requires careful consideration.
The reduction in MBCI and Tot AUCIGI observed in our cohort reflects a transition from compensatory hyperinsulinemia to more physiological insulin secretion, rather than β‑cell dysfunction. This interpretation is supported by parallel improvements in insulin sensitivity indices (Matsuda, Stumvoll MCR120) and stable HOMA-β, indicating enhanced peripheral glucose utilization and reduced secretory demand on β‑cells. These findings align with previous studies demonstrating that significant weight loss reduces β‑cell compensatory burden while preserving insulin secretory capacity.31
Several limitations of this study should be acknowledged. First, the small sample size (n=36 obese participants, n=18 controls) limits statistical power, particularly for multivariate regression analyses, and increases the risk of type I error due to multiple correlations without formal multiplicity adjustment. Second, the retrospective observational design precludes causal inference and may introduce selection bias, as participants were recruited from a clinical setting and may represent a highly motivated subgroup. Third, lifestyle intervention adherence was assessed descriptively without objective measures (eg, dietary records, accelerometry), limiting evaluation of intervention fidelity. Fourth, healthy controls were only evaluated at baseline, precluding longitudinal comparison of inflammatory and metabolic changes. Finally, the lack of intermediate follow‑up time points (eg, 3 months) prevents characterization of the temporal relationship between IL‑1β reduction and pancreatic function improvement.
Despite these limitations, our study provides novel evidence linking IL‑1β dynamics to pancreatic function recovery following substantial lifestyle‑induced weight loss in obesity. These findings have potential clinical implications, targeting IL‑1β signaling in combination with lifestyle intervention may offer additive metabolic benefits, particularly in obese individuals with high baseline inflammation. Future research should include larger prospective cohorts, objective adherence monitoring, longitudinal follow-up, and mechanistic studies to validate the inflammation‑metabolic clearance axis. NLRP3 inhibition has been shown to reduce systemic and tissue‑specific inflammation in diet‑induced obesity models, accompanied by improvements in body weight, hyperglycemia, and hepatic steatosis. Moreover, the combination of NLRP3 inhibition with GLP‑1 receptor agonism yields additive metabolic benefits, highlighting the therapeutic potential of targeting the IL‑1β pathway alongside lifestyle interventions.32 Stratified analyses by weight loss magnitude or baseline inflammation status may further identify subgroups most likely to benefit from anti-inflammatory interventions.
In conclusion, lifestyle‑induced weight loss in obese individuals reduces IL-1β and improves pancreatic function, with changes in IL-1β independently associated with improvements in insulin secretion, insulin resistance, and insulin sensitivity. While these associations do not prove causality, they highlight IL-1β as a promising biomarker and potential therapeutic target for obesity-related metabolic disorders.
Conclusion
Weight loss achieved through scientifically structured lifestyle interventions yields multifaceted benefits for obese patients, including improvements in body composition characteristics such as weight, body fat, and visceral fat. biochemical indicators like lipid profiles and liver function. IL-1β levels, and pancreatic function metrics. As IL-1β levels decrease, improvements occur in pancreatic β-cell function, insulin resistance, and insulin sensitivity. Furthermore, changes in IL-1β levels and insulin-related indicators demonstrate independent associations. Despite the observed associations, the small sample size and retrospective observational design limit the statistical power and generalizability of our findings. These results should be warrant validation in larger, prospective cohorts.
Data Sharing Statement
Data available on request from the authors. The data that support the findings of this study are available from the corresponding author, L.C.J (Email: [email protected]), upon reasonable request.
Acknowledgment
We sincerely acknowledge all participants for their invaluable contributions to this study. We also thank Nankai University and the Health Management Center of The First Affiliated Hospital of Nankai University for supporting the successful implementation of this research.
Author Contributions
Xiaoxuan Guo: Writing - original draft, conceptualization, data curation, formal analysis, investigation, software, validation, visualization. Mingxin Leng: Conceptualization, investigation, software, validation, writing - original draft. Dangmin Hou: Data curation, investigation, software, validation, writing - original draft. Zhouhuiling Li: Data curation, software, conceptualization, validation, writing - original draft. Xinying Gao: Software, data curation, conceptualization, validation, writing - original draft. Chunjun Li: Funding acquisition, conceptualization, resources, supervision, validation, writing – review and editing. All authors gave final approval of the version to be published; have agreed on the journal to which the article has been submitted; and agree to be accountable for all aspects of the work.
Funding
This study was supported by grants from Natural Science Foundation of Tianjin [23JCZDJC01040] and Tianjin Health Research Project [TJWJ2022MS019].
Disclosure
The authors declare that they have no conflicts of interest.
References
1. Swinburn BA, Kraak VI, Allender S, et al. The global syndemic of obesity, undernutrition, and climate change: the lancet commission report. Lancet. 2019;393(10173):791–15. doi:10.1016/S0140-6736(18)32822-8
2. Rigamonti A, Brennand K, Lau F, Cowan CA. Rapid cellular turnover in adipose tissue. PLoS One. 2011;6(3):e17637. doi:10.1371/journal.pone.0017637
3. Koenen M, Hill MA, Cohen P, Sowers JR. Obesity, adipose tissue and vascular dysfunction. Circ Res. 2021;128(7):951–968. doi:10.1161/CIRCRESAHA.121.318093
4. Muriach M, Flores-Bellver M, Romero FJ, Barcia JM. Diabetes and the brain: oxidative stress, inflammation, and autophagy. Oxid Med Cell Longev. 2014;2014:102158. doi:10.1155/2014/102158
5. Fu J, Wu H. Structural mechanisms of NLRP3 inflammasome assembly and activation. Annu Rev Immunol. 2023;41(1):301–316. doi:10.1146/annurev-immunol-081022-021207
6. Xu J, Núñez G. The NLRP3 inflammasome: activation and regulation. Trends Biochem Sci. 2023;48(4):331–344. doi:10.1016/j.tibs.2022.10.002
7. Meier DT, de Paula Souza J, Donath MY. Targeting the NLRP3 inflammasome-IL-1β pathway in type 2 diabetes and obesity. Diabetologia. 2025;68(1):3–16. doi:10.1007/s00125-024-06306-1
8. Alfadul H, Sabico S, Al-Daghri NM. The role of interleukin-1β in type 2 diabetes mellitus: a systematic review and meta-analysis. Front Endocrinol. 2022;13:901616. doi:10.3389/fendo.2022.901616
9. Wiedemann SJ, Trimigliozzi K, Dror E, et al. The cephalic phase of insulin release is modulated by IL-1β. Cell Metab. 2022;34(7):991–1003.e1006. doi:10.1016/j.cmet.2022.06.001
10. Chen X, Zhang D, Li Y, Wang W, Bei W, Guo J. NLRP3 inflammasome and IL-1β pathway in type 2 diabetes and atherosclerosis: friend or foe? Pharmacol Res. 2021;173:105885. doi:10.1016/j.phrs.2021.105885
11. Aamir AB, Kumari R, Latif R, et al. Effects of intermittent fasting and caloric restriction on inflammatory biomarkers in individuals with obesity/overweight: a systematic review and meta-analysis of randomized controlled trials. Obes Rev. 2025;26(1):e13838. doi:10.1111/obr.13838
12. Sobreviela Sánchez S, Giusfredi Quevedo R, Fernandes T, da Fonseca GWP. The role of exercise and nutrition in modulating inflammatory cytokines activity for obesity management. Front Endocrinol. 2025;16:1618360. doi:10.3389/fendo.2025.1618360
13. Ridker PM, Everett BM, Thuren T, et al. Antiinflammatory therapy with canakinumab for atherosclerotic disease. N Engl J Med. 2017;377(12):1119–1131. doi:10.1056/NEJMoa1707914
14. Larsen CM, Faulenbach M, Vaag A, et al. Interleukin-1-receptor antagonist in type 2 diabetes mellitus. N Engl J Med. 2007;356(15):1517–1526. doi:10.1056/NEJMoa065213
15. Maedler K, Sergeev P, Ris F, et al. Glucose-induced beta cell production of IL-1beta contributes to glucotoxicity in human pancreatic islets. J Clin Invest. 2002;110(6):851–860. doi:10.1172/JCI200215318
16. Donath MY. Targeting inflammation in the treatment of type 2 diabetes. Diabetes Obes Metab. 2013;15 Suppl 3(s3):193–196. doi:10.1111/dom.12172
17. Simeone PG, Costantino S, Liani R, et al. Interleukin-1β in circulating mononuclear cells predicts steatotic liver disease improvement after weight loss in subjects with obesity and prediabetes or type 2 diabetes. Cardiovasc Diabetol. 2025;24(1):247. doi:10.1186/s12933-025-02706-8
18. Cao C, Koh HE, Reeds DN, Patterson BW, Klein S, Mittendorfer B. Critical evaluation of indices used to assess β-cell function. Diabetes. 2024;73(3):391–400. doi:10.2337/db23-0613
19. Leng M, Guo X, Wei C, et al. Progressive weight loss-induced remission of insulin resistance/hyperinsulinemia and improvements in cardiovascular risk factors. Diabetes Metab Syndr Obes. 2025;18:1099–1110. doi:10.2147/DMSO.S501876
20. Park SY, Gautier JF, Chon S. Assessment of insulin secretion and insulin resistance in human. Diabetes Metab J. 2021;45(5):641–654. doi:10.4093/dmj.2021.0220
21. Fortin E, Lundin M, Mellbin L, et al. Empagliflozin improves insulin sensitivity in patients with recent acute coronary syndrome and newly detected dysglycaemia: experiences from the randomized, controlled SOCOGAMI trial. Cardiovasc Diabetol. 2023;22(1):208. doi:10.1186/s12933-023-01950-0
22. Gastaldelli A. Measuring and estimating insulin resistance in clinical and research settings. Obesity. 2022;30(8):1549–1563. doi:10.1002/oby.23503
23. Aguree S. Iron-inflammasome crosstalk in adipose tissue: unresolved roles of NLRP3 and IL-1β in metabolic inflammation. Int J Mol Sci. 2025;26(17):8304. doi:10.3390/ijms26178304
24. Everett BM, Donath MY, Pradhan AD, et al. Anti-inflammatory therapy with canakinumab for the prevention and management of diabetes. J Am Coll Cardiol. 2018;71(21):2392–2401. doi:10.1016/j.jacc.2018.03.002
25. Ridker PM, MacFadyen JG, Glynn RJ, et al. Inhibition of interleukin-1β by canakinumab and cardiovascular outcomes in patients with chronic kidney disease. J Am Coll Cardiol. 2018;71(21):2405–2414. doi:10.1016/j.jacc.2018.03.490
26. Stienstra R, Joosten LA, Koenen T, et al. The inflammasome-mediated caspase-1 activation controls adipocyte differentiation and insulin sensitivity. Cell Metab. 2010;12(6):593–605. doi:10.1016/j.cmet.2010.11.011
27. Tajik N, Keshavarz SA, Masoudkabir F, et al. Effect of diet-induced weight loss on inflammatory cytokines in obese women. J Endocrinol Invest. 2013;36(4):211–215. doi:10.3275/8465
28. Magkos F, Fraterrigo G, Yoshino J, et al. Effects of moderate and subsequent progressive weight loss on metabolic function and adipose tissue biology in humans with obesity. Cell Metab. 2016;23(4):591–601. doi:10.1016/j.cmet.2016.02.005
29. Chang KV, Wu WT, Chen YH, et al. Enhanced serum levels of tumor necrosis factor-α, interleukin-1β, and −6 in sarcopenia: alleviation through exercise and nutrition intervention. Aging. 2023;15(22):13471–13485. doi:10.18632/aging.205254
30. Caceres L, Guha Ray A, Emont MP, Weinstock A. Influence of weight loss and weight regain on adipose tissue inflammation. Arterioscler Thromb Vasc Biol. 2025;45(12):2155–2163. doi:10.1161/ATVBAHA.125.322196
31. Sarin SM, Valliyot B, Pramod VK. Beta-cell secretory function in recent-onset type 2 diabetes mellitus: a comparative study across body mass index categories. Cureus. 2025;17(9):e92288. doi:10.7759/cureus.92288
32. Bultinck J, Yuan S, Cantuti-Castelvetri L, et al. NLRP3 inhibition by VTX3232 tempers inflammation resulting in reduced body weight, hyperglycemia, and hepatic steatosis in obese male mice. Mol Metab. 2026;103:102282. doi:10.1016/j.molmet.2025.102282
 © 2026 The Author(s). This work is published and licensed by Dove Medical Press Limited. The
full terms of this license are available at https://www.dovepress.com/terms
and incorporate the Creative Commons Attribution
- Non Commercial (unported, 4.0) License.
By accessing the work you hereby accept the Terms. Non-commercial uses of the work are permitted
without any further permission from Dove Medical Press Limited, provided the work is properly
attributed. For permission for commercial use of this work, please see paragraphs 4.2 and 5 of our Terms.
© 2026 The Author(s). This work is published and licensed by Dove Medical Press Limited. The
full terms of this license are available at https://www.dovepress.com/terms
and incorporate the Creative Commons Attribution
- Non Commercial (unported, 4.0) License.
By accessing the work you hereby accept the Terms. Non-commercial uses of the work are permitted
without any further permission from Dove Medical Press Limited, provided the work is properly
attributed. For permission for commercial use of this work, please see paragraphs 4.2 and 5 of our Terms.