Back to Journals » Clinical, Cosmetic and Investigational Dermatology » Volume 15
Changes in Gut Microbiota of Patients with Atopic Dermatitis During Balneotherapy
Authors Thirion F, Guilly S, Fromentin S, Plaza Oñate F, Alvarez AS, Le Chatelier E, Pons N, Levenez F, Quinquis B, Ehrlich S, Doré J, Martin R, Seité S ![]()
Received 30 September 2021
Accepted for publication 13 January 2022
Published 2 February 2022 Volume 2022:15 Pages 163—176
DOI https://doi.org/10.2147/CCID.S342104
Checked for plagiarism Yes
Review by Single anonymous peer review
Peer reviewer comments 4
Editor who approved publication: Dr Jeffrey Weinberg
Florence Thirion,1,* Susie Guilly,1,* Sébastien Fromentin,1 Florian Plaza Oñate,1 Anne-Sophie Alvarez,1 Emmanuelle Le Chatelier,1 Nicolas Pons,1 Florence Levenez,1 Benoît Quinquis,1 Stanislav Ehrlich,1 Joel Doré,1,2 Richard Martin,3 Sophie Seité4
1University Paris-Saclay, INRAE, MGP, Jouy-en-Josas, 78350, France; 2University Paris-Saclay, INRAE, AgroParisTech, Micalis Institute, Jouy-en-Josas, France; 3Mercurialis Biotech, Rochecorbon, France; 4La Roche-Posay Dermatological Laboratories, Levallois-Perret, France
*These authors contributed equally to this work
Correspondence: Sophie Seité
La Roche-Posay Dermatological Laboratories, 62 quai Charles Pasqua, Levallois-Perret, 92300, France
, Tel +33 1 49 64 33 40
, Email [email protected]
Introduction: Balneotherapy (BT) is the treatment of disease through the use of thermal spring water (TSW). It has been used for centuries and remains a popular form of treatment for dermatologic diseases such as atopic dermatitis (AD). Recent findings highlighted the role of the gut microbiota in AD and the possible crosstalk between gut and skin microbiomes in this pathology. Nevertheless, changes in the composition of the gut microbiota after balneotherapy remain to be elucidated.
Methods: A total of 96 patients, with moderate to severe AD according to the SCORAD, were enrolled. Stool samples were collected prior and post a 3-week balneotherapy at the thermal care center of La Roche-Posay (France). Composition of the gut microbiota was assessed by shotgun metagenomic sequencing.
Results: Species associated with high gut microbiota richness tended to correlate negatively with disease severity (SCORAD) and positively with SCORAD reduction, while species associated with low richness displayed the opposite pattern. Relative abundance of 23 species was significantly altered during BT, these changes being significantly associated with SCORAD reduction during BT, suggesting that gut microbiota composition and AD progression were associated through the treatment. Microbial functions related to gut-brain axis such as GABA and tryptophan metabolism were also altered by the treatment. Long-standing AD patients exhibited a better gut microbial profile than recently diagnosed patients, with higher MSP richness and species associated with SCORAD reduction.
Conclusion: In patients with AD, clinical disease parameters such as SCORAD or disease duration are intricately linked to the gut microbiota composition. SCORAD reduction occurring during BT was also associated with gut microbiota. The gut-brain-skin axis via neurotransmitter such as GABA should be further studied in diseases such as AD.
Keywords: atopic dermatitis, balneotherapy, gut microbiota, shotgun metagenomics, thermal spring water
Introduction
Atopic dermatitis (AD) is a common inflammatory skin disorder affecting 15–30% of children and 2–10% of adults.1 AD results from a complex interaction between genetics and the environment both decreasing skin barrier function. Abnormalities of the skin barrier, the immune barrier, and more recently, the microbial barrier or microbiota have been described.2
Thermal Spring Water (TSW) has been used successfully since the eighteenth century in treating skin diseases including atopic dermatitis (AD) and psoriasis.3,4 La Roche-Posay thermal spring water (LRP-TSW) in France is a selenium-rich water (0.053 mg/l) that contains bicarbonate, calcium, silicate, magnesium, and strontium.5 The regimen consists of an 18-day treatment (3 weeks) including a daily high-pressure filiform shower (15 bars for 3 minutes) performed by a dermatologist. Clinical trials have demonstrated positive effects of balneotherapy with LRP-TSW on AD.5,6 Recently, the role of LRP-TSW to improve the diversity of the skin microbiota and to reduce dryness and pruritus in AD and psoriasis has been highlighted.6 The concentration of minerals and non-pathogenic microbes in LRP-TSW may explain its therapeutic benefit.3 Clinical studies have shown that topical LRP-TSW treatment results in increase in Gram-negative bacteria with reduction of Gram-positive bacteria, and improvement in skin microbial diversity.7 At the same time, skin condition and general dryness have been shown to improve.8
Gut microbiota was particularly investigated during the last decade for its potential role in immune-mediated dermatological diseases such as AD through the gut-skin axis.9–12 This cross-talk between gut and skin could be mediated by immunity, by metabolites (such as short-chain-fatty acids) or by neuroendocrine molecules produced by the gut microbiota.10 In attempting to characterize the gut microbiota of patients with AD, observational studies, considering especially infants or children, used various techniques (mainly 16S rRNA sequencing, but also qPCR or cultivation) and reported sometimes-contradictory results.13 Gut microbiota diversity was either decreased in patients with AD,14–16 increased,17 or without any difference.13 Most studies focused mainly on Bifidobacteria, Clostridia and Lactobacilli.13 Depending on the studies, Bifidobacteria were either increased13,18 or decreased10,13,19 in AD patients. The same contradictory results were observed with Clostridia,16,20,21 while Lactobacilli were mostly found decreased.13,18 Other studies reported that AD gut microbiome showed higher abundance of Clostridioides difficile, Escherichia coli and Staphylococcus aureus.10
In this study, we used shotgun metagenomics to evaluate gut microbiota changes during BT, and how it is connected with the improvement of the pathology observed after BT (SCORAD).
Materials and Methods
Patient Recruitment and Sampling
This open label observational study did not need an institutional review board approval but complied with the ethical guidelines of the 1975 Declaration of Helsinki and was conducted between April and September 2016 according to ICH guidelines for Good Clinical Practice. This research used anonymous data without direct patient contact, and institutional review board approval was not necessary prior to the study initiation. Ninety-six individuals, 51 females and 45 males, between 6 and 70 years old, suffering from AD were followed before and at the end of an 18 days balneotherapy treatment at the thermal care center of La Roche-Posay (France) (Table 1). Patients were not prospectively assigned balneotherapy but rather as part of routine treatment, as deemed by the dermatologists. All subjects provided informed consent to participate in the study, when patients were minors, consents were signed by their parents/guardians instead. The electronic file compiling the data recorded in the study was submitted to the French Commission in charge of Personal Data Protection and was approved for data treatment. The study protocol and corresponding appendices were also transmitted to a French Research Ethics Committee (CPP, Poitiers, France) for information purposes. The CPP confirmed the non-necessity to get an approval for this study.
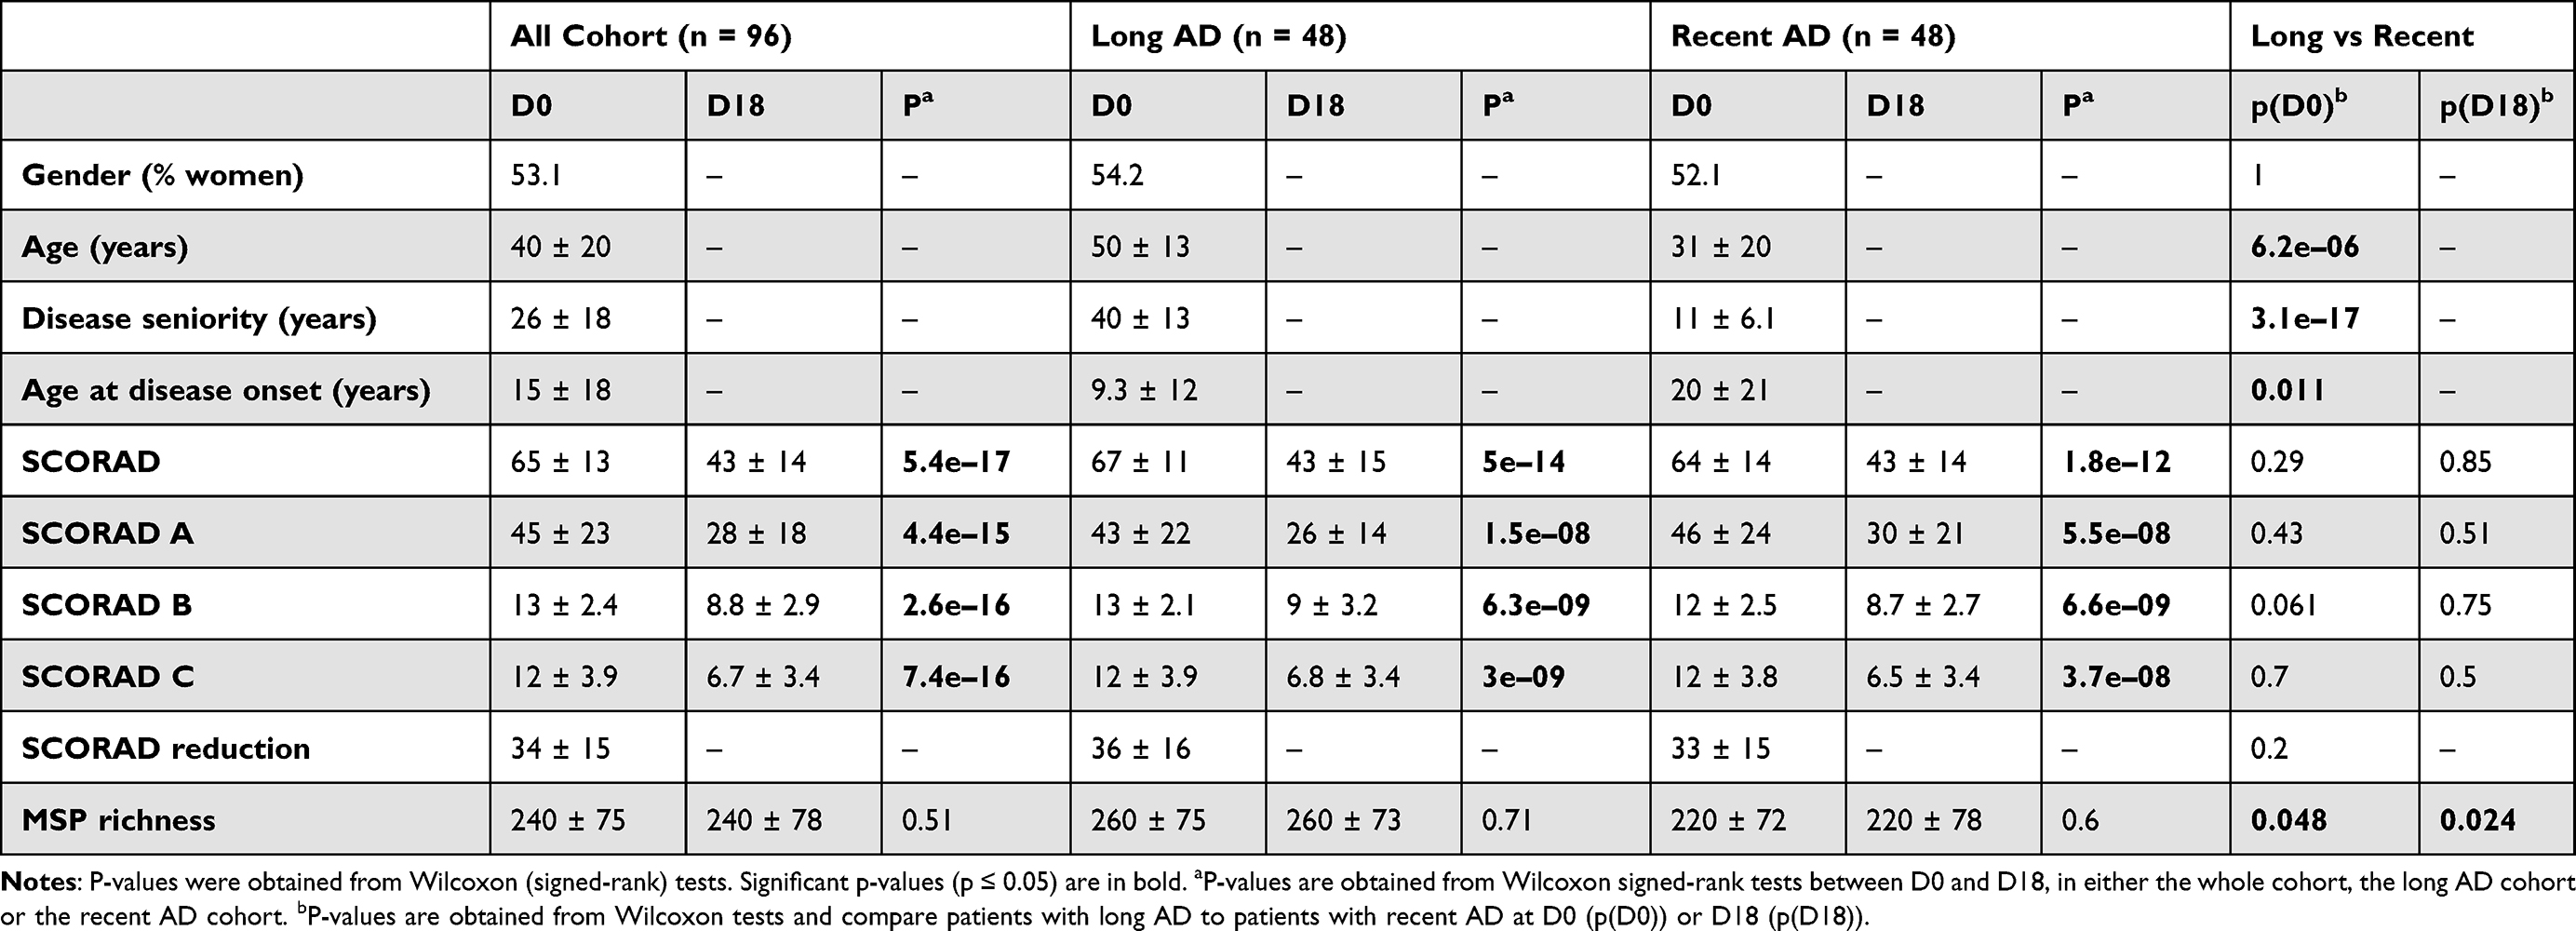 |
Table 1 Phenotypic Description of the Cohort and Its Evolution During the Balneotherapy |
During the 2 visits (D0 and D18), the same investigating dermatologist assessed the severity of AD with the SCORAD (SCORing Atopic Dermatitis) based on SCORAD A (disease extension), SCORAD B (disease intensity) and SCORAD C (subjective symptoms such as pruritus or sleep loss).22
At the same visits, fecal samples were collected in a stabilizing solution (RNAlater®) according to the International Human Microbiome Standards (IHMS), SOP 005 V2.23
DNA Extraction and Shotgun Metagenomics Sequencing
Fecal DNA was extracted following the SOP 07 V2 H from IHMS.23 The DNA preparation was subjected to quality control using Qubit Fluorometric (ThermoFisher Scientific, Waltham, US) and qualified using DNA size profiling on a Fragment Analyzer instrument (Agilent Technologies, Santa Clara, US).
3 µg of high molecular weight DNA (>10 kbp) was used to build sequencing libraries. Shearing of DNA into fragments of approximately 150 bp was performed using an ultrasonicator (Covaris, Woburn, US) and DNA fragment library construction was performed using the Ion Plus Fragment Library and Ion Xpress Barcode Adapters Kits (ThermoFisher Scientific, Waltham, US). Purified and amplified DNA fragment libraries were sequenced using the Ion Proton Sequencer (ThermoFisher Scientific, Waltham, US) leading to 22.7 million reads (± 1.3 million) on average per sample.
Sequencing Data Processing
Read cleaning, filtering and mapping were performed with the METEOR software suite24 that relies on Bowtie2 for read mapping.25 First, quality control was performed with AlienTrimmer:26 sequencing adapters were removed and low quality reads were trimmed or discarded. Then, reads mapped to the human genome (GRCh38.p13) with nucleotide identity ≥90% were also discarded.
Remaining reads were mapped to the updated Integrated Gene Catalogue of the human gut microbiota (IGC2),27 comprising 10.4 million of genes. Gene counts were computed with a two-step procedure as previously described.28 The resulting count table was further processed using the R package MetaOMineR v1.31.29 Downsizing at 15 million mapped reads was performed to take into account differences in sequencing depth and in mapping rate across samples. Then, the downsized matrix was normalized according to gene length and transformed into a frequency matrix (FPKM normalization).
MetaGenomic Species (MSP) Abundance Profiles
The IGC2 gene catalogue has been previously clustered into 1990 MetaGenomic Species (MSP, clusters of >100 co-abundant genes belonging to the same microbial species, in 1601 samples) using MSPminer.30 Taxonomic annotation of MSP was performed using an in-house pipeline. First, all genes are aligned on public databases (NCBI nt and WGS, versions of March 202031) using blastn.32 An MSP was assigned to the lowest taxonomic rank (from species to superkingdom) that brought consensus in at least 50% of its genes. To avoid misleading annotations due to error in databases, for each gene the 20 first hits were being considered. Relative abundance of an MSP was computed as the mean abundance of its 100 “marker” genes (that is, the genes that correlate the most altogether). If less than 10% of “marker” genes were seen in a sample, the abundance of the MSP was set to 0. Relative abundances at higher taxonomic ranks were computed as the sum of the MSP that belong to a given taxa. MSP richness was assessed as the number of MSP detected in a sample (that is, whose abundance is strictly positive).
Functional Profiling
Three databases were used to predict gene functions: Kyoto Encyclopedia of Genes and Genomes (KEGG);33 eggNOG database34 and TIGRFAM.35 Genes from the IGC2 catalogue were mapped with diamond36 onto KEGG Orthologous (KO) from KEGG database (version 89). Each gene was assigned to the best-ranked KO among hits with e-value < 10e-05 and bit score ≥60. The same procedure was used with eggnog (version 3.0). TIGRFAM families (version 15.0) were searched in the IGC2 catalogue using HMMER 3.2.1.37
Then we assessed presence of KEGG modules, Gut-Metabolic Modules38 and Gut-Brain Modules39 in an MSP. A functional module consists in a set of KOs (or NOGs, or TIGRFAMs). Since MSPs are pangenomes, their genes are divided into “core” genes which are present in all samples harboring the MSP or “accessory” genes which might be absent from a sample even if the MSP is detected. Thus, we first considered a functional module to be present in an MSP if at least 90% of its components were present in the “core” genes of the MSP. Then we re-affined this assumption sample by sample, by adding to the “core” genes the accessory genes detected in a given sample. Finally, we estimated the abundance of a module in a sample by summing abundances of all MSPs found to carry this module in the sample.
Statistical Analysis
All statistical analyses and graphs were performed with R software (version 3.6.0).40 For each individual, we computed the SCORAD reduction between D18 an D0 as:
With  being the SCORAD at D18 and
  the SCORAD at D0.
We defined as richness species’ MSPs that were positively correlated to richness, and ‘anti-richness’ species MSPs that were negatively correlated to richness (at baseline, p ≤ 0.05, Spearman’s correlation). Differential analysis in MSPs or functional modules abundances were performed using Wilcoxon signed-rank tests. Correlations between variables (either metagenomics variables or clinical variables) were performed using Spearman’s correlations. All p-values were corrected for multiple testing with the Benjamini Hochberg method. Unless stated otherwise, a corrected p-value is considered as significant when under the threshold of 0.1.
To account for age effect in the relations between disease duration and metagenomic features, we computed Spearman’s partial correlations using the R package ppcor v1.1.41
Principal Components Analysis (PCA) were performed on MSPs relative abundance after they have been log10-transformed with the package FactoMineR v1.42.42 Clinical variables were used as supplementary variables.
Effect size was computed using the Cliff’s Delta statistic with the package effsize v0.7.4.43 This metrics compares abundance of a given value between two groups and is comprised between −1 and 1 (0: no difference between both groups regarding the considered value; from 0 to 1: the value is larger in the first group as compared to the second group; from −1 to 0: the value is larger in the second group as compared to the first group). Magnitude of the effect size d is defined in44 as negligible if |d| < 0.147, small if |d| < 0.33, medium if |d| < 0.474, and large otherwise.
Results
Abundances of Species Associated with High or Low MSP Richness Correlate with SCORAD and SCORAD Reduction
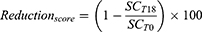
At D0, disease severity estimated by SCORAD was not directly associated with the number of metagenomic species detected in samples (MSP richness). Indeed, correlation between MSP richness and SCORAD was not significant (Spearman’s ρ = −0.022, P = 0.82, Figure S1). However, species associated with high richness (“richness” species) tended to correlate negatively to SCORAD and positively to SCORAD reduction, whereas species associated with low richness (“anti-richness” species) tended to correlate positively to SCORAD and negatively to SCORAD reduction (Figure 1A-C). Among the “anti-richness” species, we found Escherichia coli, Streptococcus sanguinis, two Eggertellaceae (Eggerthella lenta and Rubneribacter badeniensis), two Lachnospiraceae (Sellimonas intestinalis and Anaerotignum lactatifermentans), and two Erysipelotrichaceae (Longicatena caecimuris and Faecalitalea sp.) that were all positively correlated to SCORAD (P ≤ 0.05, Spearman correlation), and Anaerotruncus colihominis that was negatively correlated to SCORAD reduction (P ≤ 0.05, Spearman correlation). In contrast, a group of “richness” species, composed of six Lachnospiraceae, three Ruminococcaceae (among which Faecalibacterium prausnitzii, subspecies msp_0457), one Eggerthellaceae (Senegalimassilia anaerobia), one Christensenellaceae and two unclassified Clostridiales, correlated negatively with SCORAD (P ≤ 0.05, Spearman correlation). In addition, another group of “richness” species correlated positively with SCORAD reduction (among which two Lachnospiraceae, two Eggerthellaceae, two Christensenellaceae) (P ≤ 0.05, Spearman correlation).
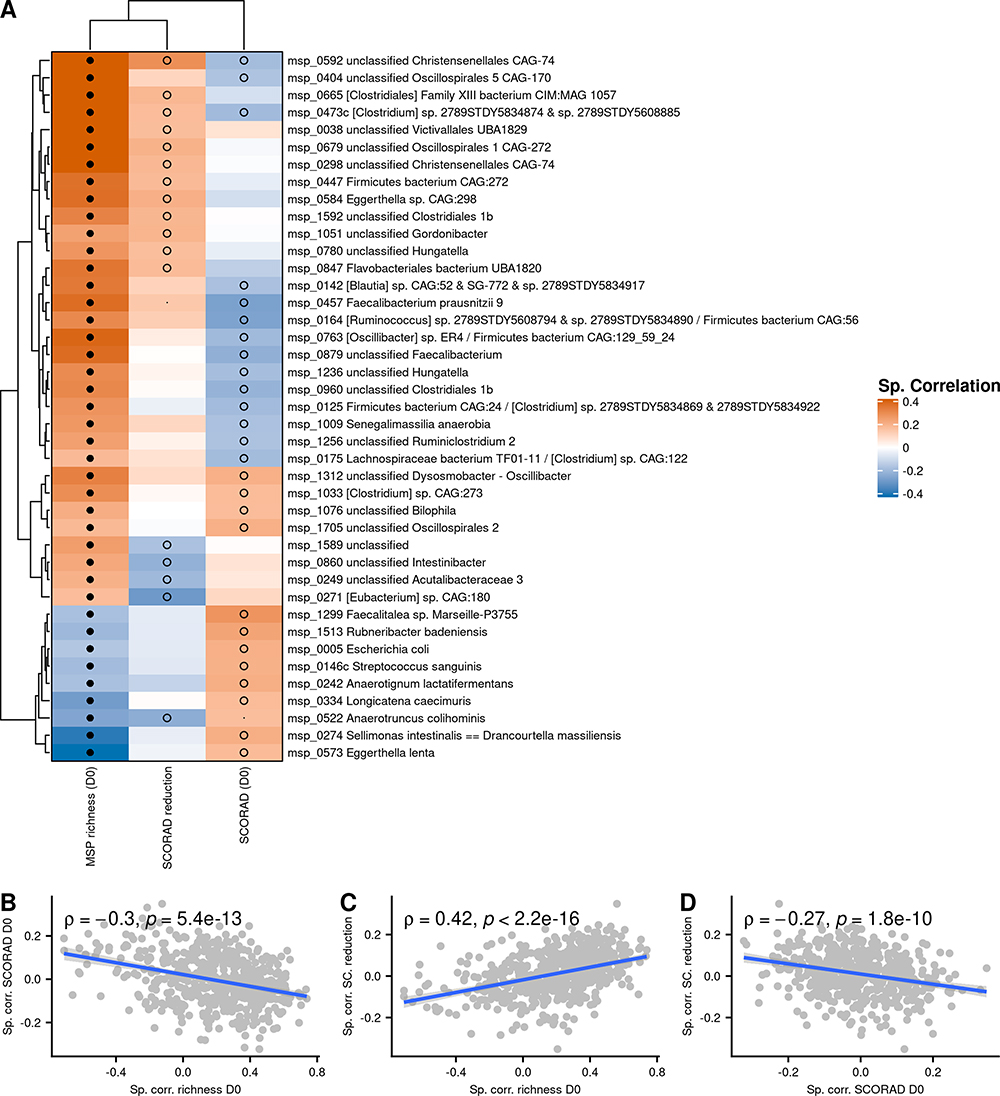 |
Figure 1 (A) Spearman correlations between abundance of Metagenomics Species (MSP) at D0 and MSP richness, SCORAD (D0) and SCORAD reduction. Only MSPs with at least one significant correlation with SCORAD or SCORAD reduction, and significantly correlated with gut richness, are shown. Black dots represent correlations with FDR ≤ 0.1; empty circles represent correlations with p ≤ 0.05. (B and C) Relation between MSP correlations with richness and SCORAD at baseline or SCORAD reduction; (D) Relation between species correlation with SCORAD at baseline and reduction. Spearman correlations are indicated. |
MSPs that tended to be negatively associated with disease severity also consistently tended to be positively associated with SCORAD reduction, and vice versa (Figure 1D). Two species had significant associations: an unclassified Lachnospiraceae and an unclassified Christensenellaceae, both “richness” species associated with lower SCORAD at baseline and with SCORAD reduction.
Moderate but Positive Changes in Gut Microbiota During Balneotherapy
At baseline, mean SCORAD of the 96 individuals was 65 ±13, with 84 individuals (87.5%) suffering from severe AD (SCORAD ≥ 50), and 12 individuals (12.5%) suffering from moderate AD (25 ≤ SCORAD < 50) (Table 1). The 18-day balneotherapy drastically reduced the mean SCORAD (by 33.8%), going down from 65 ±13 to 43 ± 14 (P < 2.2e-16, Wilcoxon signed-rank test, Table 1, Figure 2A). Among the 84 individuals with severe AD at D0, 55 (65%) had moderate AD at D18, and 6 (7%) had slight AD. 33% of the 12 individuals with moderate AD at D0 had slight AD at the end of BT and the remaining 67% had still moderate AD. At the end of the treatment, there were only 23 individuals (24.0%) with severe AD while 63 (65.6%) had moderate AD and 10 (10.4%) had mild AD (SCORAD < 25). However, we found no difference between MSP richness at baseline and end of treatment (p = 0.51, Figure 2B).
 |
Figure 2 (A) SCORAD evolution during the balneotherapy. (B) MSP richness evolution during the balneotherapy. (C) Cliff’s Delta of contrasted MSPs (above) and functional modules (below) between D0 and D18, along with their correlation to SCORAD reduction (Cliff’s Delta positive: enriched at D0; Cliff’s Delta negative: enriched at D18). (D) Correlations between MSPs abundance (at D0) and SCORAD amelioration (y-axis) in function of the Cliff’s Delta between D0 and D18 of the MSPs (x-axis). (E) Correlations between modules abundance (at D0) and SCORAD amelioration (y-axis) in function of the Cliff’s Delta between D0 and D18 of the modules (x-axis). Empty circles represent correlations with p ≤ 0.05. |
At the species level, differences between D0 and D18 were slight. Out of 554 MSP present in at least 10% of individuals, 23 (4%) were differentially abundant between D0 and D18 (P ≤ 0.05, Figures 2C and S2). Among them, 14 were reduced at D18 and 9 were increased in relative abundance. Only Mediterraneibacter faecis, Lactobacillus delbrueckii and Eisenbergiella tayi had a non-negligible effect size (absolute Cliff’s Delta > 0.1), and the 3 of them were depleted at D18. Of interest, Faecalibacterium prausnitzii (phylogroup represented by the L2-6 strain) was enriched at D18, even though the effect size was negligible (Cliff’s Delta = −0.044).
Regarding functional potential of species, 24 out of 270 functional modules (9%) were differentially abundant between D0 and D18 (P < 0.05) (Figure 2C). Noteworthy, 14% of Gut-Brain Modules (GBM), which focus on metabolites involved in the gut-brain axis, were found to be differentially abundant, while only 7% and 8% of GMM and KEGG modules (that also contain modules related to gut-brain axis but are not specific to them) were contrasted, respectively. GABA degradation was increased at D18, while acetate synthesis, quinolinic acid degradation, tryptophan degradation, quinolinic acid synthesis, menaquinone synthesis and nitric oxide synthesis were decreased at D18. Many modules related to tryptophan metabolism were more abundant at D0: tryptophan degradation (MGB049 and MF0009), quinolinic acid synthesis, quinolinic acid degradation, NAD biosynthesis from aspartate, and all of them had Cliff’s Delta >0.1.
The changes in abundance of an MSP between D0 and D18 (measured by Cliff’s Delta) was associated with its relation to SCORAD reduction (Spearman’s ρ = −0.12, P = 0.0042, Figure 2D): MSPs more abundant at baseline in well-improving patients tended to increase during the treatment, while MSPs more abundant in poorly-improving patients tended to decrease. The same global effect was observed at the functional level (Spearman’s ρ = −0.23, P = 0.00013, Figure 2E).
Microbiota Composition is Associated with History of Atopy
MSP richness at D0 and D18 was positively correlated with disease duration (Spearman’s ρ = 0.24, P = 0.017 and ρ = 0.28, P = 0.005, respectively, Figure 3A and B), which means that long-term patients had a richer gut microbiota than short-term patients (Table 1). After accounting for age with Spearman’s partial correlation, the association between disease duration and MSP richness was still significant at D18 (Spearman’s ρ = 0.23, P = 0.02) and close to be at D0 (Spearman’s ρ = 0.18, P = 0.07), suggesting that there was a positive association between disease duration and MSP richness independently of age. This observation was confirmed by Principal Component Analysis (PCA), since disease duration and age projected on orthogonal components (component 1 and component 2, respectively, see Figure S3).
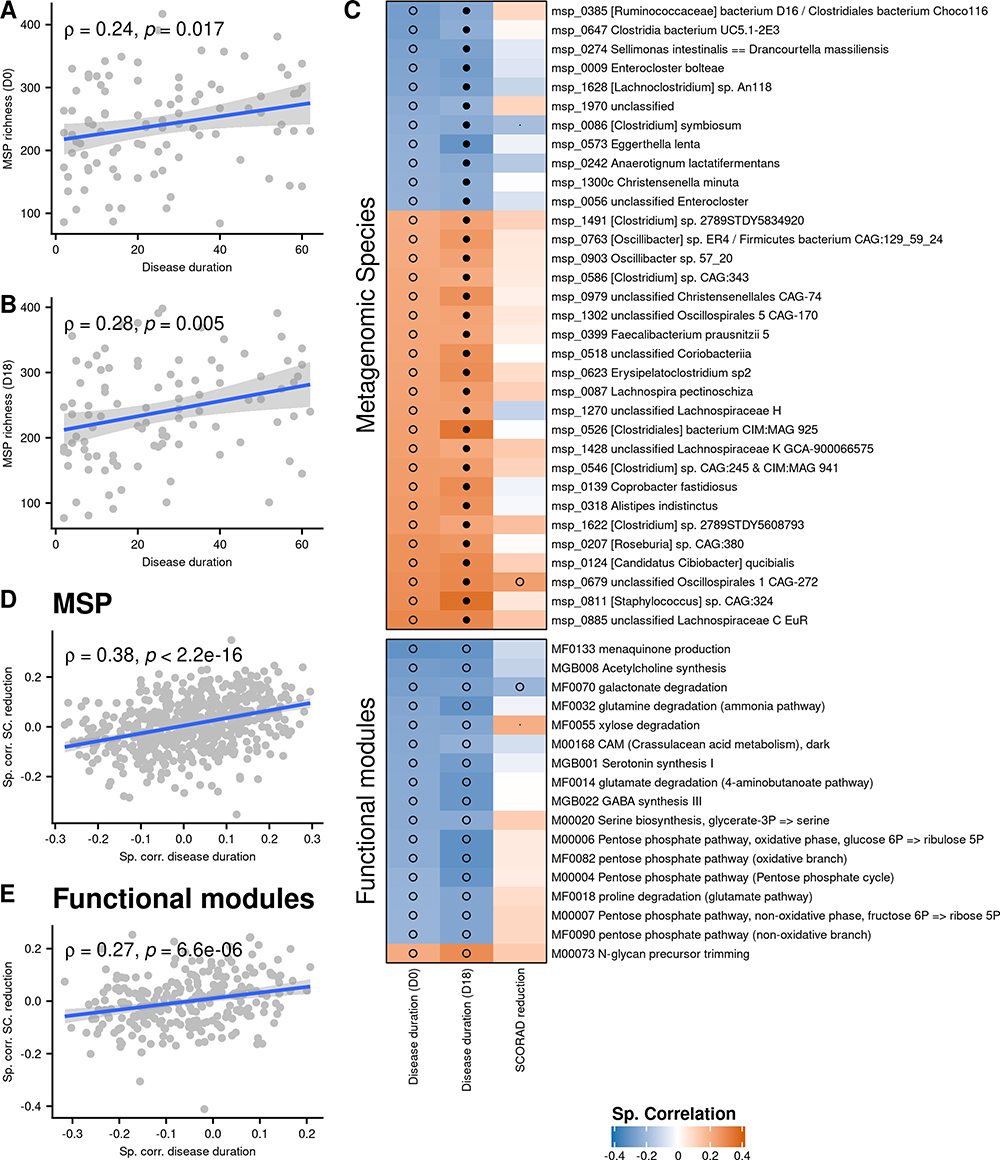 |
Figure 3 (A and B) MSP richness as a function of disease duration at D0 and D18. (C) Spearman correlations between abundance of Metagenomics Species (MSP) or functional modules, disease duration and SCORAD reduction. Only MSPs and functional modules correlated with disease duration at both D0 and D18 (p ≤ 0.05) are shown. Correlation between disease duration and metagenomics features are computed using a partial Spearman correlation to take age into account. Black dots represent correlations with FDR ≤ 0.1; empty circles represent correlations with p ≤ 0.05. (D) Correlations of MSPs with SCORAD amelioration (y-axis) in function of correlations of MSPs with disease duration (x-axis). (E) Correlations of functional modules with SCORAD amelioration (y-axis) in function of correlations of functional modules with disease duration (x-axis). |
The relation between richness and disease duration was of special interest since we observed that species which positively correlated with severity were negatively correlated with richness, and vice versa (c.f. previous section). Inconsistently, we found that disease duration was positively associated with severity at baseline, especially regarding SCORAD B (sub-score of SCORAD related to intensity of symptoms) (Spearman’s ρ = 0.26, P = 0.01, Figure S4). This relationship disappeared at D18 (Spearman’s ρ = 0.09, P = 0.37), suggesting that the long-term patients might be better responders to the treatment. However, disease duration was not significantly correlated to SCORAD reduction (Spearman’s ρ= 0.13, P = 0.20).
At the species level, 33 MSPs were correlated with disease duration at both D0 and D18 after adjusting for age (P ≤ 0.05, Spearman’s partial correlation). Among them, 22 were increased in abundance in long-term patients and 11 were increased in short-term patients (Figure 3C). The species increased in long-term patients tended to be positively correlated to SCORAD reduction while those of short-term patients were negatively correlated to SCORAD reduction (Spearman’s ρ = 0.38, P < 2.2e-16, Figure 3D). The former species included Lachnospira pectinoschiza and Faecalibacterium prausnitzii (phylogroup represented by the strain CNCM I-4573), while the latter species included Clostridium symbiosum, Anaerotignum lactatifermentans, Enterocloster bolteae, Eggerthella lenta and Christensenella minuta. The same pattern was observed at the functional level (Figure 3E). We found 17 modules correlated with disease duration when taking age into account (P ≤ 0.05, Spearman’s partial correlation), among which only one was increased in long-term patients. This unbalanced ratio may be an annotation bias, since 9 out of 11 short-term MSPs (81%) were annotated at the species level vs only 14 out of 22 long-term MSPs (64%). Nevertheless, among the 16 modules increased in short-term patients we found numerous functions related to gut-brain axis, notably glutamine degradation (ammonia pathway), glutamate degradation (4-aminobutanoate pathway), GABA synthesis, menaquinone production, serotonin synthesis and acetylcholine synthesis. All of them were negatively associated with SCORAD reduction (Figure 3C).
We divided the cohort into two subgroups: patients with history of AD ≥ 23 years (n = 48, “long” patients) and patients with history of AD < 23 years (n = 48, “recent” patients). Both subgroups had 42 species whose abundance changed between D0 and D18 (P ≤ 0.1, Wilcoxon signed-rank test). However, only two species were common to long and recent patients, and among them, only one had a consistent evolution between the groups: Desulfovibrio piger, a sulfate-reducing bacterium which prevalence lies below 20% in both groups. Moreover, median Cliff’s delta of the species from the long patients group was −0.02, meaning that most species increased during balneotherapy, whereas median Cliff’s delta of the species from the recent group was +0.02, meaning that most species decreased during balneotherapy. This difference in median was significant (P = 0.03, Wilcoxon test, Figure S5).
Discussion
In this study, we have shown that species associated with high gut microbiota richness were negatively associated with SCORAD and positively associated with SCORAD reduction. Since dysbiotic gut microbiota has been linked to a low richness and inflammatory markers,29 these results suggest that the inflammatory potential of the gut microbiota, AD severity, and symptoms reduction are connected altogether. In particular, the “richness” species Faecalibacterium prausnitzii (subspecies msp_0457), a butyrate-producing bacterium with documented anti-inflammatory properties45,46 was negatively associated with SCORAD and positively associated with SCORAD reduction. On the opposite, Escherichia coli, “anti-richness” species with LPS associated pro-inflammatory properties and here associated with disease severity, was found to be more abundant in infants with AD in several studies.10 However, no direct correlation of gut microbiota richness and baseline SCORAD was detected, possibly because of the insufficient statistical power of the study.
Changes in the gut microbiota during the 18-days balneotherapy were slight, with only 4% of the gut species exhibiting a significant but moderate or negligible evolution (according to the effect size). However, abundance of these species at baseline was related to SCORAD evolution, in a consistent way: increasing species were positively associated with SCORAD reduction, while decreasing species were negatively associated. In other words, increasing species were more abundant at baseline in individuals showing the highest SCORAD reduction, while decreasing species were more abundant at baseline in individuals showing the lowest SCORAD reduction. These results suggest that gut microbiota might co-evolve with disease severity. Of interest, a subspecies of Faecalibacterium prausnitzii (msp_0388) increased during the balneotherapy and was positively associated with SCORAD reduction. However, this particular phylogroup of F. prausnitzii was previously found to be more abundant in individuals with AD in a study using 16S gene sequencing.47 This difference in results may arise from technical differences (16S vs shotgun). In our study, relative abundance of this species was negatively related to severity (SCORAD and SCORAD B), sleep problem, and itching (data not shown).
One of the decreasing species with the largest effect size (Cliff’s Delta = 0.12) was Lactobacillus delbrueckii, possibly due to a decrease in dairy product consumption during BT. Its baseline abundance was also negatively correlated with SCORAD reduction (Spearman’s ρ = −0.13, P = 0.2). This result is inconsistent with different studies48–50 that found that two subspecies of L. delbrueckii (bulgaricus and lactis) reduced inflammation in AD, and thus are thought to alleviate AD.
At the functional level, GABA degradation was positively associated with SCORAD reduction and increased during the treatment. On the other hand, modules related to tryptophan metabolism decreased during balneotherapy and were negatively associated with SCORAD reduction. Interestingly, GABA and tryptophan were both found to be related to AD.51–55
Finally, even though the changes in gut microbiota were slight, there was a significant relation between these changes and the disease evolution, suggesting that gut microbiota and AD tended to co-evolve during the treatment. The short duration of the balneotherapy (18 days) and the absence of medication known to strongly affect the gut microbiota such as antibiotics might explain why these changes were subtle and why effect size was low.
Patients with a long history of atopy were more severe at baseline than patients with a recent disease onset (especially regarding SCORAD B), but this relationship disappeared after balneotherapy. On the other hand, the former exhibited a gut microbiota with beneficial markers such as higher MSP richness and species positively related to SCORAD reduction, while the latter exhibited lower MSP richness and potentially detrimental species. Faecalibacterium prausnitzii (phylogroup represented by the strain CNCM I-4573) was among the species enriched in patients with a long history of atopy, and is known for its anti-inflammatory properties. Enterocloster bolteae, Eggerthella lenta and Anaerotignum lactatifermentans, increased in patients with a recent disease onset, were of particular interest. Indeed, both E. bolteae and E. lenta were found increased in asthmatic individuals.56 As for A. lactatifermentans, as well as E. lenta, they were part of the “anti-richness” species which abundance positively correlated with disease severity at baseline. Moreover, gut microbiota displayed a different evolution pattern considering these two groups: most species impacted by the balneotherapy in long-term patients tended to increase at D18, while they mostly decreased in short-term patients. Considering all these observations together – difference in microbiota at baseline, difference in microbiota evolution, disappearance of the baseline acute severity in the long-term patients – we might hypothesize that AD course may induce change in habits,57 which in turn affect gut microbiota as well as balneotherapy benefits.
Not only gut-skin axis, but also gut-brain axis might play a key role in the relation between gut microbiota and AD, patients with AD being at increased risk of psychological wellbeing issues.58 In our study, we found that 29% of the contrasted functional modules between D0 and D18 were specific to the gut-brain axis modules, whereas they represent only 18% of all considered modules. Among the different modules associated to gut-brain axis, modules related to GABA are of particular interest. Indeed, GABA degradation (MGB019) was significantly associated with SCORAD reduction (positively) and significantly increased between D0 and D18. Moreover, GABA biosynthesis from putrescine (M00135) was significantly associated with disease severity (positively) (with SCORAD A at D0 and at D18, data not shown). Finally, GABA synthesis (MGB022) was more abundant in short-term patients, and negatively associated with SCORAD reduction (though non-significantly). These different results suggest that the ability of the microbiota to degrade GABA could be beneficial for the host, while conversely its ability to produce GABA might have noxious effects on the host in the context of atopy. Since GABA or GABA receptor agonists administration have been shown to alleviate induced-AD in mouse models,54,55 these findings could seem inconsistent and more GABA-specific studies should be carried out to explore thoroughly the relationship between GABA dosage in the different host’s compartments, GABA intake and gut-microbial GABA production.
Recent studies have shown that skin exposure to external elements, such as ultraviolet59 or topical medication60 could impact gut microbiota composition. In our study, we also reported changes in gut microbiota occurring during balneotherapy. However, since balneotherapy takes place at La Roche Posay center, it comes along with changes in environmental factors that could confound the observed modifications. For example, diet is known to play a key role in shaping gut microbiota. Absence of information about changes in diet during balneotherapy – including LRP-TSW drinking – is a major limitation in our study. Other uncontrolled factor such as physical exercise or stress reduction might also account for changes in gut microbiota.
Another major limitation is the absence of control group, which was not feasible given the way of recruitment (AD patients coming to the centre to follow the balneotherapy). Hence, the observed changes in patients gut microbiota cannot be bounded to balneotherapy alone but may rather be due to confounding factors such as the mixture of treatment and all environmental factors.
Conclusion
In a balneotherapy treatment for patients with atopic dermatitis, disease parameters such as severity, severity reduction or disease duration, are intricately linked to gut microbiota composition. However, we cannot exclude that changes in the gut microbiota might be due to an effect of lifestyle and diet modifications that occurred during the balneotherapy. Nevertheless, the gut-brain-skin axis, via neurotransmitter such as GABA, should be further studied in diseases such as AD.
Summary
Why carry out this study ?
- Atopic disease (AD) is an immune-mediated dermatologic disease for which balneotherapy has been an effective treatment for centuries.
- Gut microbiota may be involved in AD, though its implications are still unclear.
What was the aim of this study ?
- This study aims at assessing how gut microbiota from patients with AD changes during balneotherapy, and how these changes relate to disease severity (SCORAD).
What was learned from the study ?
- In patients with AD, gut microbiota richness is associated with lower SCORAD, higher SCORAD reduction during BT and higher disease duration.
- Gut microbiota changes during BT are moderate but correlate with SCORAD reduction.
Data Sharing Statement
Sequencing data generated in this study have been deposited in the EMBL-EBI European Nucleotide Archive (ENA) under accession number PRJEB43611.
Compliance with Ethics Guidelines
This open label observational study did not need an institutional review board approval but complied with the ethical guidelines of the 1975 Declaration of Helsinki and was conducted between April and September 2016 according to ICH guidelines for Good Clinical Practice. All subjects provided informed consent to participate in the study, when patients were minors, consents were signed by their parents/guardians instead.
Acknowledgments
The authors acknowledge the great help of D. Moyal and the technical support of G. Le Dantec, M. Fortuné, and N. Galleron. They also acknowledge the Thermal Center of La Roche Posay and particularly Dr P. Delaire.
Funding
This study was funded by La Roche-Posay Dermatological Laboratories, France. Additional funding was from the Metagenopolis grant ANR-11-DPBS-0001.
Disclosure
Sophie Seité is employee of La Roche-Posay Dermatological Laboratories. Richard Martin is consultant of La Roche-Posay Dermatological Laboratories and is a consultant in the field of microbiology. Florence Thirion, Susie Guilly, Sébastien Fromentin, Florian Plaza Oñate, Anne-Sophie Alvarez, Emmanuelle Le Chatelier, Nicolas Pons, Florence Levenez, Benoît Quinquis, Stanislav D. Ehrlich and Joel Doré declare that they have no conflicts of interest.
References
1. Weidinger S, Novak N. Atopic dermatitis. Lancet (London, England). 2016;387(10023):1109–1122. doi:10.1016/S0140-6736(15)00149-X
2. Seite S, Bieber T. Barrier function and microbiotic dysbiosis in atopic dermatitis. Clin Cosmet Investig Dermatol. 2015;8:479–483. doi:10.2147/CCID.S91521
3. Huang A, Seité S, Adar T. The use of balneotherapy in dermatology. Clin Dermatol. 2018;36(3):363–368. doi:10.1016/j.clindermatol.2018.03.010
4. Martin R, Henley JB, Sarrazin P, Seité S. Skin microbiome in patients with psoriasis before and after balneotherapy at the thermal care Center of La Roche-Posay. J Drugs Dermatol. 2015;14(12):1400–1405.
5. Seite S. Thermal waters as cosmeceuticals: la Roche-Posay thermal spring water example. Clin Cosmet Investig Dermatol. 2013;6:23–28. doi:10.2147/CCID.S39082
6. Zeichner J, Seite S. From probiotic to prebiotic using thermal spring water. J Drugs Dermatol. 2018;17(6):657–662.
7. Seite S, Flores GE, Henley JB, et al. Microbiome of affected and unaffected skin of patients with atopic dermatitis before and after emollient treatment. J Drugs Dermatol. 2014;13(11):1365–1372.
8. Baldwin HE, Bhatia ND, Friedman A, Eng RM, Seite S. The role of cutaneous microbiota harmony in maintaining a functional skin barrier. J Drugs Dermatol. 2017;16(1):12–18.
9. Salem I, Ramser A, Isham N, Ghannoum MA. The gut microbiome as a major regulator of the gut-skin axis. Front Microbiol. 2018;9:1459. doi:10.3389/fmicb.2018.01459
10. Lee SY, Lee E, Park YM, Hong SJ. Microbiome in the gut-skin axis in atopic dermatitis. Allergy Asthma Immunol Res. 2018;10(4):354–362. doi:10.4168/aair.2018.10.4.354
11. Colucci R, Moretti S. Implication of human bacterial gut microbiota on immune-mediated and autoimmune dermatological diseases and their comorbidities: a narrative review. Dermatol Ther (Heidelb). 2021;11(2):363–384. doi:10.1007/s13555-021-00485-0
12. Alghamdi HA, Behieldin A, Edris S. Gut microbiome skin axis in the development of atopic dermatitis. J Pak Med Assoc. 2021;71(4):1221–1227. doi:10.5455/JPMA.1415
13. Petersen EBM, Skov L, Thyssen JP, Jensen P. Role of the gut microbiota in atopic dermatitis: a systematic review. Acta Derm Venereol. 2019;99(1):5–11. doi:10.2340/00015555-3008
14. Ismail IH, Oppedisano F, Joseph SJ, et al. Reduced gut microbial diversity in early life is associated with later development of eczema but not atopy in high-risk infants. Pediatr Allergy Immunol off Publ Eur Soc Pediatr Allergy Immunol. 2012;23(7):674–681. doi:10.1111/j.1399-3038.2012.01328.x
15. Abrahamsson TR, Jakobsson HE, Andersson AF, Björkstén B, Engstrand L, Jenmalm MC. Low diversity of the gut microbiota in infants with atopic eczema. J Allergy Clin Immunol. 2012;129(2):
16. Ye S, Yan F, Wang H, et al. Diversity analysis of gut microbiota between healthy controls and those with atopic dermatitis in a Chinese population. J Dermatol. 2021;48(2):158–167. doi:10.1111/1346-8138.15530
17. Nylund L, Satokari R, Nikkilä J, et al. Microarray analysis reveals marked intestinal microbiota aberrancy in infants having eczema compared to healthy children in at-risk for atopic disease. BMC Microbiol. 2013;13:12. doi:10.1186/1471-2180-13-12
18. Melli LCFL, do Carmo-Rodrigues MS, Araújo-Filho HB, et al. Gut Microbiota of Children with Atopic Dermatitis: Controlled Study in the Metropolitan Region of São Paulo, Brazil. Allergol Immunopathol (Madr) 2020;48(2):107–115.
19. Reddel S, Del Chierico F, Quagliariello A, et al. Gut microbiota profile in children affected by atopic dermatitis and evaluation of intestinal persistence of a probiotic mixture. Sci Rep. 2019;9(1):4996. doi:10.1038/s41598-019-41149-6
20. Park YM, Lee SY, Kang MJ, et al. Imbalance of gut streptococcus, clostridium, and akkermansia determines the natural course of atopic dermatitis in infant. Allergy Asthma Immunol Res. 2020;12(2):322–337. doi:10.4168/aair.2020.12.2.322
21. Penders J, Gerhold K, Stobberingh EE, et al. Establishment of the intestinal microbiota and its role for atopic dermatitis in early childhood. J Allergy Clin Immunol. 2013;132(3):601–607.e8. doi:10.1016/j.jaci.2013.05.043
22. Severity scoring of atopic dermatitis: the SCORAD index. Consensus Report of the European Task Force on Atopic Dermatitis. Dermatology. 1993;186(1):23–31. doi:10.1159/000247298
23. IHMS [Internet]. [cited 2020 Oct 5]. Available from: http://www.human-microbiome.org/.
24. Pons N, Batto J-M, Kennedy S, et al. METEOR -a platform for quantitative metagenomic profiling of complex ecosystems; 2010. Available from: https://forgemia.inra.fr/metagenopolis/meteor.
25. Langmead B, Salzberg SL. Fast gapped-read alignment with Bowtie 2. Nat Methods. 2012;9(4):357–359. doi:10.1038/nmeth.1923
26. Criscuolo A, Brisse S. AlienTrimmer: a tool to quickly and accurately trim off multiple short contaminant sequences from high-throughput sequencing reads. Genomics. 2013;102(5–6):500–506. doi:10.1016/j.ygeno.2013.07.011
27. Wen C, Zheng Z, Shao T, et al. Quantitative metagenomics reveals unique gut microbiome biomarkers in ankylosing spondylitis. Genome Biol. 2017;18(1):142. doi:10.1186/s13059-017-1271-6
28. Qin N, Yang F, Li A, et al. Alterations of the human gut microbiome in liver cirrhosis. Nature. 2014;513(7516):59–64. doi:10.1038/nature13568
29. Le Chatelier E, Nielsen T, Qin J, et al. Richness of human gut microbiome correlates with metabolic markers. Nature. 2013;500(7464):541–546. doi:10.1038/nature12506
30. Plaza Oñate F, Le Chatelier E, Almeida M, et al. MSPminer: abundance-based reconstitution of microbial pan-genomes from shotgun metagenomic data. Bioinformatics. 2019;35(9):1544–1552. doi:10.1093/bioinformatics/bty830
31. Sayers EW, Agarwala R, Bolton EE, et al. Database resources of the National Center for Biotechnology Information. Nucleic Acids Res. 2019;47(D1:D23–8. doi:10.1093/nar/gky1069
32. Altschul SF, Gish W, Miller W, Myers EW, Lipman DJ. Basic local alignment search tool. J Mol Biol. 1990;215(3):403–410. doi:10.1016/S0022-2836(05)80360-2
33. Kanehisa M, Goto S. KEGG: Kyoto Encyclopedia of Genes and Genomes. Nucleic Acids Res. 2000;28(1):27–30. doi:10.1093/nar/28.1.27
34. Huerta-Cepas J, Szklarczyk D, Forslund K, et al. EGGNOG 4.5: a hierarchical orthology framework with improved functional annotations for eukaryotic, prokaryotic and viral sequences. Nucleic Acids Res. 2016;44(D1):D286–93. doi:10.1093/nar/gkv1248
35. Haft DH. TIGRFAMs: a protein family resource for the functional identification of proteins. Nucleic Acids Res. 2001;29(1):41–43. doi:10.1093/nar/29.1.41
36. Buchfink B, Xie C, Huson DH. Fast and sensitive protein alignment using DIAMOND. Nat Methods. 2015;12(1):59–60. doi:10.1038/nmeth.3176
37. Eddy S. HMMER User’s Guide: Biological Sequence Analysis Using Profile Hidden Markov Models. 1998. Available from: http://hmmer.org/. Accessed January 19, 2022.
38. Vieira-Silva S, Falony G, Darzi Y, et al. Species-function relationships shape ecological properties of the human gut microbiome. Nat Microbiol. 2016;1(8):16088. doi:10.1038/nmicrobiol.2016.88
39. Valles-Colomer M, Falony G, Darzi Y, et al. The neuroactive potential of the human gut microbiota in quality of life and depression. Nat Microbiol. 2019;Apr(4):623–632. doi:10.1038/s41564-018-0337-x
40. Team R core. A Language and Environment for Statistical Computing. Vienna, Austria: R Foundation for Statistical Computing; 2019. Available from: https://www.R-project.org/R-projectViennaAustria.
41. Kim S. ppcor: an R package for a fast calculation to semi-partial correlation coefficients. Commun Stat Appl Methods. 2015;22(6):665–674. doi:10.5351/CSAM.2015.22.6.665
42. Lê S, Josse J, Husson F. {FactoMineR}: a Package for Multivariate Analysis. J Stat Softw. 2008;25(1):1–18. doi:10.18637/jss.v025.i01
43. Torchiano M effsize: efficient effect size computation; 2018. Available from: https://cran.r-project.org/package=effsize.
44. Romano J, Kromrey JD, Coraggio J, Skowronek J Appropriate statistics for ordinal level data: should we really be using t-test and Cohen's d for evaluating group differences on the NSSE and other surveys? Annual meeting of the Florida Association of Institutional Research; 2006: 1–3.
45. Sokol H, Pigneur B, Watterlot L, et al. Faecalibacterium prausnitzii is an anti-inflammatory commensal bacterium identified by gut microbiota analysis of Crohn disease patients. Proc Natl Acad Sci U S A. 2008;105(43):16731–16736. doi:10.1073/pnas.0804812105
46. Martín R, Miquel S, Benevides L, et al. Functional characterization of novel faecalibacterium prausnitzii strains isolated from healthy volunteers: a step forward in the use of F. Prausnitzii as a Next-Generation Probiotic. Front Microbiol. 2017;8:1226.
47. Song H, Yoo Y, Hwang J, Na Y-C, Kim HS. Faecalibacterium prausnitzii subspecies-level dysbiosis in the human gut microbiome underlying atopic dermatitis. J Allergy Clin Immunol. 2016;137(3):852–860. doi:10.1016/j.jaci.2015.08.021
48. Watanabe T, Hamada K, Tategaki A, et al. Oral administration of lactic acid bacteria isolated from traditional South Asian fermented milk “dahi” inhibits the development of atopic dermatitis in NC/Nga mice. J Nutr Sci Vitaminol (Tokyo). 2009;55(3):271–278. doi:10.3177/jnsv.55.271
49. Kano H, Kita J, Makino S, Ikegami S, Itoh H. Oral administration of Lactobacillus delbrueckii subspecies bulgaricus OLL1073R-1 suppresses inflammation by decreasing interleukin-6 responses in a murine model of atopic dermatitis. J Dairy Sci. 2013;96(6):3525–3534. doi:10.3168/jds.2012-6514
50. Sheikhi A, Giti H, Heibor MR, et al. Lactobacillus Delbrueckii subsp. Bulgaricus Modulates the Secretion of Th1/Th2 and Treg Cell-Related Cytokines by PBMCs from Patients with Atopic Dermatitis. Drug Res (Stuttg). 2017;67(12):724–729.
51. Fyhrquist N, Muirhead G, Prast-Nielsen S, et al. Microbe-host interplay in atopic dermatitis and psoriasis. Nat Commun. 2019;Oct;10(1):4703. doi:10.1038/s41467-019-12253-y
52. Harden JL, Lewis SM, Lish SR, et al. The tryptophan metabolism enzyme L-kynureninase is a novel inflammatory factor in psoriasis and other inflammatory diseases. J Allergy Clin Immunol. 2016;137(6):1830–1840. doi:10.1016/j.jaci.2015.09.055
53. Gostner JM, Becker K, Kofler H, Strasser B, Fuchs D. Tryptophan Metabolism in Allergic Disorders. Int Arch Allergy Immunol. 2016;169(4):203–215. doi:10.1159/000445500
54. Lee YJ, Kim JE, Kwak MH, et al. Quantitative evaluation of the therapeutic effect of fermented soybean products containing a high concentration of GABA on phthalic anhydride-induced atopic dermatitis in IL-4/Luc/CNS-1 Tg mice. Int J Mol Med. 2014;33(5):1185–1194. doi:10.3892/ijmm.2014.1685
55. Cevikbas F, Braz JM, Wang X, et al. Synergistic antipruritic effects of gamma aminobutyric acid A and B agonists in a mouse model of atopic dermatitis. J Allergy Clin Immunol. 2017;140(2):454–464.e2. doi:10.1016/j.jaci.2017.02.001
56. Wang Q, Li F, Liang B, et al. A metagenome-wide association study of gut microbiota in asthma in UK adults. BMC Microbiol. 2018;18(1):114. doi:10.1186/s12866-018-1257-x
57. Solomon I, Ilie MA, Draghici C, et al. The impact of lifestyle factors on evolution of atopic dermatitis: an alternative approach. Exp Ther Med. 2019;17(2):1078–1084. doi:10.3892/etm.2018.6980
58. Smirnova J, Montgomery S, Lindberg M, Svensson Å, von Kobyletzki L. Associations of self-reported atopic dermatitis with comorbid conditions in adults: a population-based cross-sectional study. BMC Dermatol. 2020;20(1):23. doi:10.1186/s12895-020-00117-8
59. Bosman ES, Albert AY, Lui H, Dutz JP, Vallance BA. Skin Exposure to Narrow Band Ultraviolet (UVB) Light Modulates the Human Intestinal Microbiome. Front Microbiol. 2019;10:2410. doi:10.3389/fmicb.2019.02410
60. Shinno-Hashimoto H, Hashimoto Y, Wei Y, et al. Abnormal composition of microbiota in the gut and skin of imiquimod-treated mice. Sci Rep. 2021;11(1):11265. doi:10.1038/s41598-021-90480-4
 © 2022 The Author(s). This work is published and licensed by Dove Medical Press Limited. The
full terms of this license are available at https://www.dovepress.com/terms
and incorporate the Creative Commons Attribution
- Non Commercial (unported, 3.0) License.
By accessing the work you hereby accept the Terms. Non-commercial uses of the work are permitted
without any further permission from Dove Medical Press Limited, provided the work is properly
attributed. For permission for commercial use of this work, please see paragraphs 4.2 and 5 of our Terms.
© 2022 The Author(s). This work is published and licensed by Dove Medical Press Limited. The
full terms of this license are available at https://www.dovepress.com/terms
and incorporate the Creative Commons Attribution
- Non Commercial (unported, 3.0) License.
By accessing the work you hereby accept the Terms. Non-commercial uses of the work are permitted
without any further permission from Dove Medical Press Limited, provided the work is properly
attributed. For permission for commercial use of this work, please see paragraphs 4.2 and 5 of our Terms.