Back to Journals » Clinical Ophthalmology » Volume 12
Changes in choroidal thickness and volume are related to urinary albumin excretion in type 2 diabetic patients without retinopathy
Authors Farias LB, Lavinsky D, Benfica CZ ![]() , da Silva MO
, da Silva MO ![]() , Lavinsky J, Canani LH
, Lavinsky J, Canani LH ![]()
Received 31 January 2018
Accepted for publication 22 March 2018
Published 10 August 2018 Volume 2018:12 Pages 1405—1411
DOI https://doi.org/10.2147/OPTH.S164195
Checked for plagiarism Yes
Review by Single anonymous peer review
Peer reviewer comments 2
Editor who approved publication: Dr Scott Fraser
Lucas Brandolt Farias,1,2 Daniel Lavinsky,1,2 Camila Zanella Benfica,1,2 Monica Oliveira da Silva,1,2 Jacó Lavisnky,1,2 Luis Henrique Canani2,3
1Department of Ophthalmology, Federal University of Rio Grande do Sul, Porto Alegre, Brazil; 2Ophthalmology Section, Hospital de Clínicas de Porto Alegre, Porto Alegre, Brazil; 3Department of Endocrinology, Federal University of Rio Grande do Sul, Porto Alegre, Brazil
Purpose: To evaluate choroidal thickness and volume in patients with type 2 diabetes and microalbuminuria using spectral-domain optical coherence tomography.
Methods: We recruited 37 diabetic patients without diabetic retinopathy (18 normoalbuminuric and 19 microalbuminuric) and 21 healthy controls. Choroidal thickness and volume were mapped using the automated Early Treatment Diabetic Retinopathy Study grid and a topographic map of thickness was generated manually. Choroid was also measured at 10 locations under the fovea, temporally and nasally.
Results: Mean choroidal thickness and volume among patients with diabetes and microalbuminuria was reduced in all locations compared to controls (P<0.05). A sectoral decrease of choroidal thickness and volume was shown between microalbuminuric and normoalbuminuric groups.
Conclusion: Choroidal changes were present in type 2 diabetic patients before clinical development of retinopathy. Microalbuminuria was associated with a decrease in choroidal thickness and volume in diabetic patients without diabetic retinopathy.
Keywords: choroidal thickness, type 2 diabetes, microalbuminuria, optical coherence tomography
Introduction
Clinical and histopathological studies demonstrate that vascular dysfunction in diabetes may affect the choroid, in addition to retinal changes. Several choroidal abnormalities have been described in diabetic eyes, including increased vascular tortuosity, microaneurysms formation, obstruction of the choriocapillaris, areas of nonperfusion, and choroidal neovascularization.1–4 Indocyanine green angiography findings revealed a mottled “salt and pepper” appearance caused by lobular spotty hyperfluorescent and hypofluorescent areas in patients with nonproliferative diabetic retinopathy (DR).5 Studies using laser Doppler flowmetry have shown that subfoveal choroidal blood flow and volume were decreased in patients with diabetes, even in eyes without DR.6,7 These results suggest that choroidal microangiopathy may play a role in the early pathogenesis of ocular manifestations of diabetes.
Spectral-domain optical coherence tomography (OCT) systems and enhanced depth imaging (EDI) mode have allowed more detailed observation and measurement of the choroid. In this technique, scan acquisition of the sclerochoroidal interface is placed close to the zero delay line, increasing the sensitivity of the outer limit of the choroid.8 Many studies have evaluated the choroidal thickness in diabetic eyes, which is significantly different from that in healthy eyes.9–14 However, findings from these clinical studies are controversial, especially in patients without DR. Poor control of factors influencing choroidal thickness, such as axial length, age, refractive error, and diurnal variation, could be responsible for these inconsistent results. In addition, the diabetic vascular dysfunction may be modulated by the presence of other concomitant cardiovascular risk factors, like systemic hypertension and microalbuminuria, contributing to the heterogeneity of the chronic complications of diabetes.
Microalbuminuria is an early marker of generalized endothelial damage and has been associated with an increased risk of developing DR.15,16 Since increased urinary albumin excretion (UAE) reflects microvascular chronic complications of patients with diabetes, we hypothesized that impaired renal function might be associated with simultaneous choroidal vascular changes in diabetic eyes, especially in early-stage type 2 diabetes. Therefore, the purpose of this study was to evaluate choroidal thickness and volume using EDI spectral-domain OCT in controls and in diabetic patients with or without microalbuminuria, as well as to analyze a choroidal topographic map of thickness.
Methods
Subjects
This was a cross-sectional study conducted at the Ophthalmology Department of the Hospital de Clinicas de Porto Alegre, Brazil. We recruited 37 consecutive patients with type 2 diabetes without clinically diagnosed DR and 21 age-matched healthy control subjects. Diabetic patients were divided into 2 groups: 18 subjects with normal UAE and 19 subjects with microalbuminuria. Microalbuminuria was defined as a UAE rate between 17 and 176 mg/L in a random urinary sample. This study was performed according to the Declaration of Helsinki, and informed written consent was obtained from all patients. The Research Ethics Committee at the Hospital de Clinicas de Porto Alegre approved the study protocol (ethics assessment certificate number: 24082113.0.0000.5327).
All patients were subjected to a complete ophthalmologic examination that included slit-lamp biomicroscopy, indirect ophthalmoscopy, fundus photography, and spectral-domain OCT. Only 1 random eye of each participant was selected for the study. Age, gender, diabetes duration, UAE, glycosylated hemoglobin (HbA1c), and systemic hypertension were recorded. Exclusion criteria were history of any ocular disease, previous eye surgery, refractive errors above ±3 diopters, and media opacities.
Spectral-domain OCT imaging
Choroidal measurements were performed using Spectralis spectral-domain OCT (Heidelberg Engenieering Co, Heidelberg, Germany), which operates at a wavelength of 870 nm and performs 40,000 A-scans/s. The OCT examinations were acquired after pupillary dilatation, at the same time of the day to avoid diurnal variation. The examiner was blinded from the diagnosis of the participants. All scans were reviewed before being included in the study, and those images with artifacts or inaccurate choroidal limits were excluded.
Choroid was imaged with a 31 horizontal line scan (30°, 9.2 mm) using the EDI mode, with 20 B-scans averaged per section. Ten vertical linear sections of the choroidal thickness were obtained perpendicularly from the outer edge of the hyperreflective retinal pigment epithelium to the sclerochoroidal interface in intervals varying every 500 μm from the fovea up to 2,500 μm temporal and 2,000 μm nasal using a built-in linear caliper tool (Figure 1).
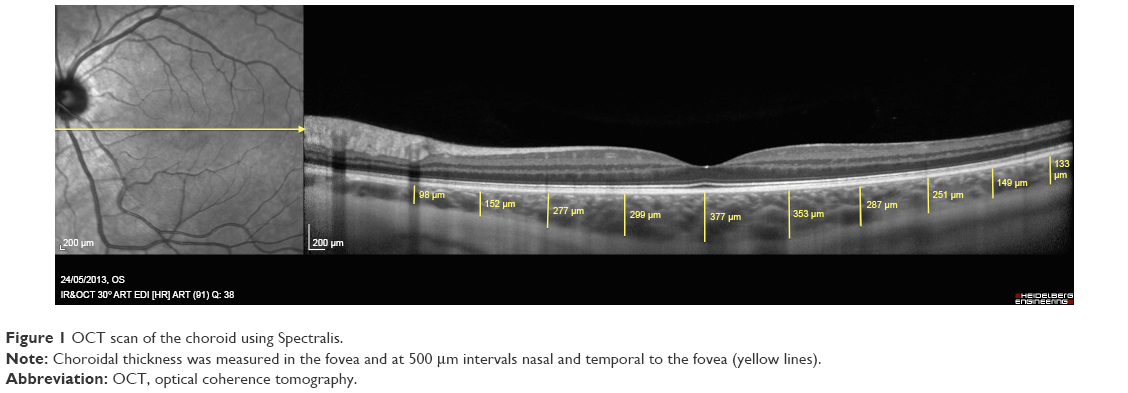 | Figure 1 OCT scan of the choroid using Spectralis. |
Choroidal thickness and volume were mapped using the automated Early Treatment Diabetic Retinopathy Study (ETDRS) grid, which was comprised of inner and outer rings (diameters: 1–3 and 3–6 mm, respectively) divided into 4 quadrants: superior, inferior, temporal, and nasal.
A topographic map of thickness was generated using built-in mapping software. We selected a posterior pole scan protocol (31 high-resolution B-scans, 9.0 mm length, and spaced 240 μm apart) to cover a 30°×25° area centered on the fovea. Each of the automatically plotted boundary lines of the retinal segmentation was manually adjusted to demarcate choroidal boundaries. Internal limiting membrane line and basement membrane line were moved to the base of retinal pigment epithelium and to sclerochoroidal interface, respectively.
Statistical analysis
Statistical data were analyzed using SPSS Statistics software version 20.0 (IBM Corporation, Armonk, NY, USA). Results of continuous variables are shown as mean values and standard deviation or the number and percentage of patients. Student’s t-test was used to compare independent groups’ averages. Comparisons of choroidal measurements between all 3 groups at each macular location were performed using the one-way analysis of variance, followed by Tukey post hoc analysis to correct for multiple comparisons. A P-value <0.05 was considered significant.
Results
Clinical characteristics of patients in this study are summarized in Table 1. There was no significant difference in age, gender, systemic arterial hypertension, HbA1c levels, or duration of diabetes between groups (P>0.05).
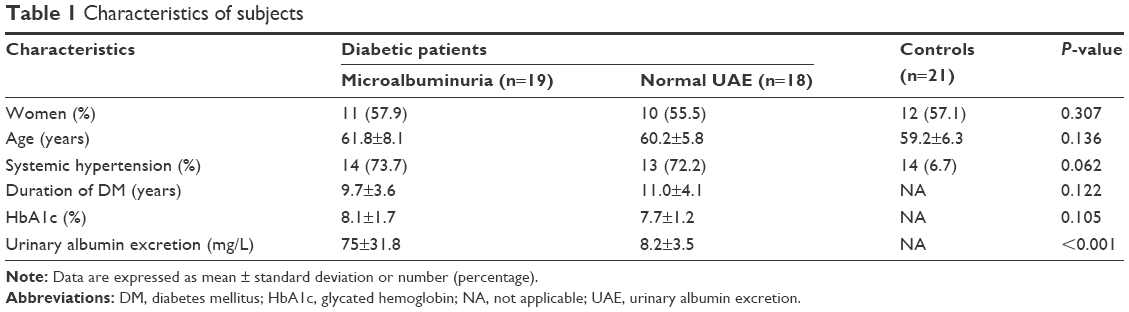 | Table 1 Characteristics of subjects |
Choroid was significantly thinner in diabetic patients with microalbuminuria compared to controls in the 10 locations under the fovea, temporally and nasally (P<0.05; Table 2). Mean subfoveal choroidal thickness was 199.1±52.7 μm in microalbuminuric group, 269.7±81.2 μm in normal UAE group, and 296.3±63.2 μm in controls (P=0.001). Although choroidal thicknesses of microalbuminuric group were reduced throughout the comparison in the 10 locations in normal UAE group, this difference only reached statistical significance from the subfoveal location up to 2,000 μm temporal (P<0.05). In all 3 groups, choroid was thickest in the subfoveal region and thinnest nasally.
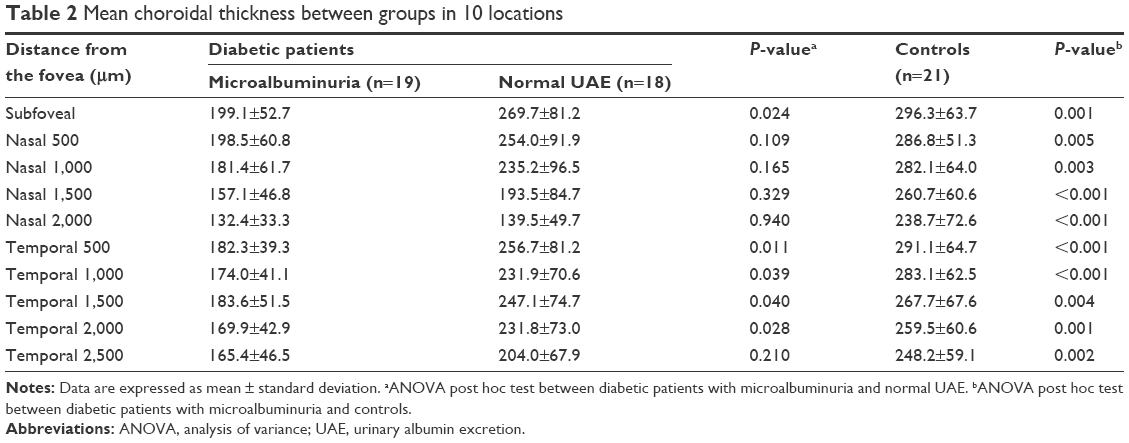 | Table 2 Mean choroidal thickness between groups in 10 locations |
Figure 2 shows mean values of choroidal thickness among 9 different ETDRS grid sectors. Average choroidal thickness among patients with diabetes and microalbuminuria was thinner in all ETDRS grid sectors compared to controls (P<0.05). There was a significant difference in choroidal thickness between microalbuminuria and normal UAE groups in the inner temporal and outer temporal sectors. There was no statistically significant difference at any grid sector in choroidal thickness between normal UAE group and controls.
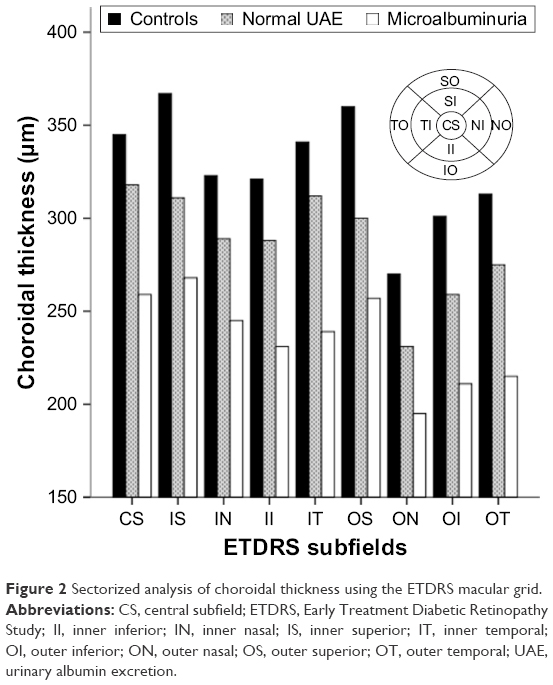 | Figure 2 Sectorized analysis of choroidal thickness using the ETDRS macular grid. |
Mean total choroidal volume in the macula was reduced in patients with diabetes and microalbuminuria compared to controls (7.33±1.40 vs 9.00±1.63; P<0.05; Figure 3). In addition, sectored analysis of choroidal volume showed significant thinning in the outer superior and outer temporal regions of macula between patients with microalbuminuria and controls (outer superior: 1.56±0.27 vs 1.91±0.37 μm, P=0.029; outer temporal: 1.33±0.26 vs 1.66±0.36 μm, P=0.043).
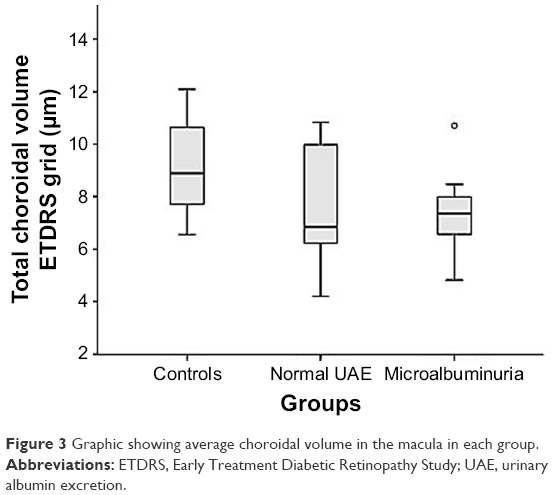 | Figure 3 Graphic showing average choroidal volume in the macula in each group. |
Analyzing the topographic map of thickness at the posterior pole, choroid was thickest in the temporal superior quadrant and thinner in the inferior nasal quadrant (Figure 4). There was a progressive overall reduction in mean choroidal thickness in patients with diabetes and microalbuminuria compared to other groups. The upper hemisphere of the posterior pole presented the greatest reduction in choroidal thickness values.
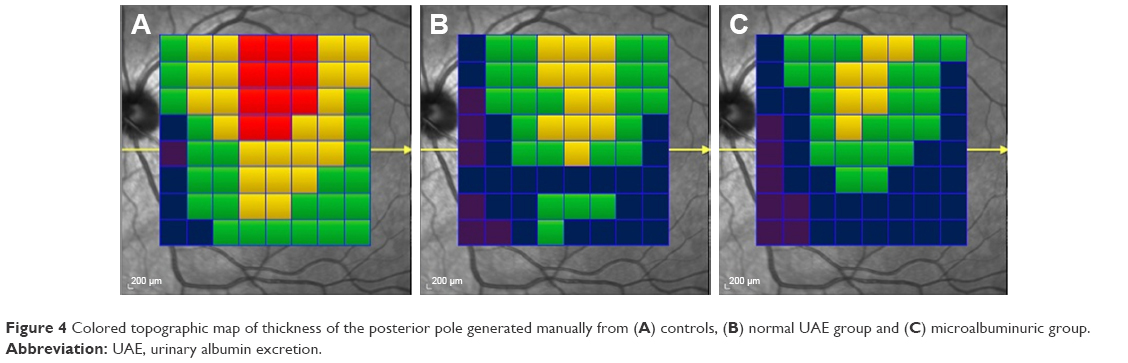 | Figure 4 Colored topographic map of thickness of the posterior pole generated manually from (A) controls, (B) normal UAE group and (C) microalbuminuric group. |
Mean difference in choroidal thickness of controls compared to normal UAE group and microalbuminuric group are represented in Figure 5A and B, respectively. There was an increasing average difference in choroidal measurements with increased UAE.
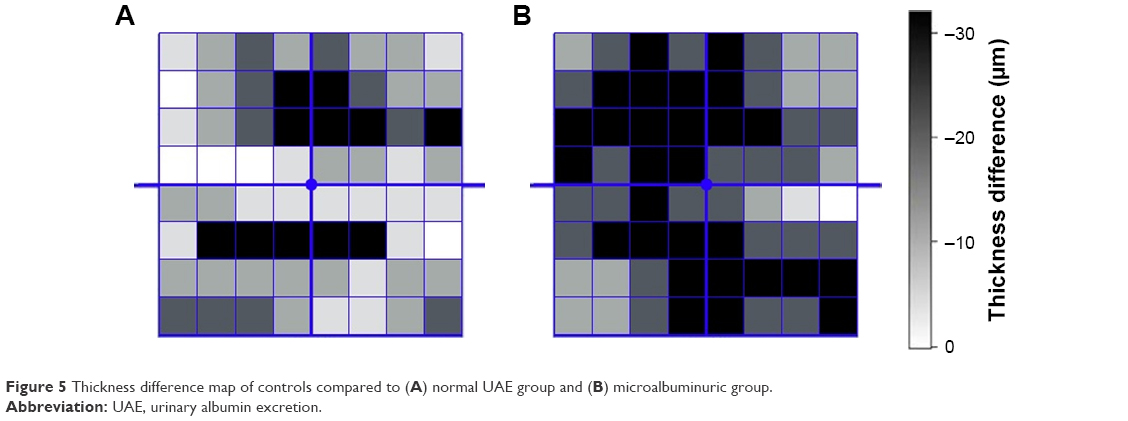 | Figure 5 Thickness difference map of controls compared to (A) normal UAE group and (B) microalbuminuric group. |
Discussion
In this study, we used EDI spectral-domain OCT to analyze macular choroidal changes in type 2 diabetic patients with microalbuminuria and no DR. Our results showed that microalbuminuria was associated with an overall macular choroidal thinning in patients without retinopathy compared to nondiabetic controls. In addition, we observed a sectoral reduction in choroidal thickness and volume in the diabetic group with microalbuminuria compared to normal UAE group. These findings suggest that diabetic choroidopathy may be related to other microvascular chronic complications of diabetes independent of DR.
Several studies have evaluated choroidal changes in patients with type 2 diabetes with focus on choroidal thickness. Most studies demonstrate a degree of choroidal thinning in diabetic eyes; however, diverse results have been published, especially between diabetic eyes without DR and controls. Esmaeelpour et al9 evaluated choroidal thickness maps (36°×36°) of 63 eyes from 42 diabetic subjects using 3D-OCT imaging at 1,060 nm. A central and inferior decrease in choroidal thickness was shown in all diabetic patients compared to healthy subjects, including diabetic subjects without retinopathy. Querques et al10 and Shen et al11 also reported a reduction of the mean subfoveal choroidal thickness in eyes with different stages of DR, including those eyes without DR. They suggest that this choroidal thinning may be due to a loss of choroidal capillaries and a decreased choroidal blood flow beneath the fovea. There are some studies which show increase in choroidal thickness in patients with diabetes. In a population-based study, Xu et al12 reported that patients with diabetes had a slightly, but significantly, thicker subfoveal choroid, despite the disease stage. This difference was not related to the presence or grade of DR, and they also did not consider the effect of diurnal variation on choroidal measurements. Furthermore, this study only analyzed 1 subfoveal measurement. Tavares Ferreira et al13 evaluated macular choroidal thickness of 125 diabetic patients without DR at 13 locations compared to 50 nondiabetic controls and showed a significant increase of choroidal thickness at only 1 location, 1,500 μm superior of the fovea. Recent studies using swept-source OCT found a significantly reduced choroidal thickness only in more advanced stages of DR.17,18
One explanation for these conflicting results may be the multiple protocols for imaging the choroid using different OCT devices. The manual measurement of the choroidal limits exposes the need for automatic segmentation algorithms in order to obtain a more accurate and reproducible evaluation of the choroid structure. Tan et al19 reported that the presence of retinal disease increases the variability of choroidal measurements among different OCT devices, especially in eyes with choroid thicker than 200 μm. In addition, previous studies using OCT measure the choroid at only limited number of points, leading to greater variations because of focal thickening or thinning of the choroid. In our study, we generate a topographic map of thickness in the entire area of the posterior pole, centered on the fovea. We also measure the choroidal thickness at 10 linear sections under the horizontal scan crossing the fovea and evaluated the choroidal thickness and volume in each subfield of ETDRS grid. These measurements may provide a more representative and reliable quantitation of choroidal changes in diabetic eyes, although it required more effort and time for the manual segmentation process.
Some systemic factors may also influence the choroidal thickness. Jo et al20 evaluated the choroidal changes in type 2 diabetic patients after a program of intensive diabetic control. They reported that choroidal thickness appears to be correlated with glycemic and blood pressure control. The authors found that baseline HbA1c was significantly associated with changes in choroidal thickness. In our study, there was no difference between the groups regarding the main systemic characteristics, such as age, refractive error, systemic hypertension, and HbA1c level. Furthermore, all choroidal measurements were also performed at the same time of the day to reduce the effects of diurnal variations.
Kocasarac et al21 investigated the effect of diffuse vascular dysfunction to choroidal thickness in 35 type 2 diabetic patients with nephropathy compared with diabetic patients without nephropathy and with controls. They found a significant choroidal thinning under the fovea and at 1,500 μm in the nasal and temporal sides in the diabetic nephropathy group with mild or no DR, and also a negative correlation between proteinuria and choroidal thickness in this group. Similar to Kocasarac et al,21 we reported an overall reduction in both volume and thickness of the choroid at several points in the macula. In a previous pilot report, thinner diabetic choroid was found with increased microalbuminuria, suggesting that microalbuminuria and choroidal thickness would be prognostic markers for disease progression in eyes with early-stage DR.22 A thicker choroid has also been described in a small sample of patients with type 1 diabetes and microalbuminuria.23 These conflicting results may have been due to this population being younger than ours with a mean age of 21.4 years. Since microalbuminuria represents the first clinical sign of diabetic nephropathy and is an early marker of generalized endothelial dysfunction, we hypothesized that its relation with retinopathy could be explained by the common mechanism involving vascular insufficiency in diabetes. The heterogeneity of microvascular chronic complications of diabetes might be due to inaccurate diagnosis. Microvascular dysfunction might be responsible for changes in choroidal thickness, and choroidal thinning may represent an early evidence of choroidal microvascular damage in diabetic patients without detectable DR. These results are consistent with a previous study that showed a correlation between a thinner choroid and greater degrees of proteinuria.24
A choroidal map of mean differences in thickness that we have generated to compare measurements between groups might be a valuable method for evaluating chorioretinal disorders. We suggest that the darker points could represent specific areas of vascular insufficiency or vulnerability to choroidal ischemia. These results are in line with new quantitative parameters of choroidal vasculature recently introduced by Wang et al.25 In addition, the use of OCT angiography, a novel imaging system that allows the evaluation of both structural and blood flow of retinal and choroidal layers, could be useful in future analysis.
Our study had potential limitations, including its cross-sectional design. We only describe associations; hence, longitudinal studies are necessary to establish a casual relationship between the factors investigated. It remains unclear whether diabetic choroidopathy is a predicting, modulating, or causative factor of DR. The sample size presented here is relatively small, although there was a strict inclusion criterion and matched characteristics between the groups. Choroidal measurements were done manually. As described above, automated segmentation of the choroid similar to the retinal map analysis protocols should be created to decrease the potential variability of the measures. Finally, the determination of the onset the disease in patients with type 2 diabetes is less precise, and thus disease duration may have been underestimated.
Conclusion
In summary, this study provided proof of concept that the choroidal changes are presented in diabetic eyes, even before the clinically evident DR Microalbuminuria was associated with a choroidal thinning in diabetic patients without DR, with a significant choroidal volume decrease. Larger prospective clinical studies are warranted to further understand the role of diabetic choroidopathy in early pathogenesis of DR and disease progression.
Acknowledgment
Parts of this study were presented at the Annual Meeting of the Association for Research In Vision and Ophthalmology (ARVO); April 28–May 3, 2017; Baltimore, MD, USA.
Disclosure
The authors report no conflicts of interest in this work.
References
Hidayat AA, Fine BS. Diabetic choroidopathy. Light and electron microscopic observations of seven cases. Ophthalmology. 1985;92(4):512–522. | ||
Fryczkowski AW, Sato SE, Hodes BL. Changes in the diabetic choroidal vasculature: scanning electron microscopy findings. Ann Ophthalmol. 1988;20(8):299–305. | ||
Fryczkowski AW, Hodes BL, Walker J. Diabetic choroidal and iris vasculature scanning electron microscopy findings. Int Ophthalmol. 1989;13(4):269–279. | ||
Fukushima I, McLeod DS, Lutty GA. Intrachoroidal microvascular abnormality: a previously unrecognized form of choroidal neovascularization. Am J Ophthalmol. 1997;124(4):473–487. | ||
Weinberger D, Kramer M, Priel E, Gaton DD, Axer-Siegel R, Yassur Y. Indocyanine green angiographic findings in nonproliferative diabetic retinopathy. Am J Ophthalmol. 1998;126(2):238–247. | ||
Nagaoka T, Kitaya N, Sugawara R, et al. Alteration of choroidal circulation in the foveal region in patients with type 2 diabetes. Br J Ophthalmol. 2004;88(8):1060–1063. | ||
Schocket LS, Brucker AJ, Niknam RM, Grunwald JE, DuPont J, Brucker AJ. Foveolar choroidal hemodynamics in proliferative diabetic retinopathy. Int Ophthalmol. 2004;25(2):89–94. | ||
Mrejen S, Spaide RF. Optical coherence tomography: imaging of the choroid and beyond. Surv Ophthalmol. 2013;58(5):387–429. | ||
Esmaeelpour M, Považay B, Hermann B, et al. Mapping choroidal and retinal thickness variation in type 2 diabetes using three-dimensional 1,060 nm optical coherence tomography. Invest Ophthalmol Vis Sci. 2011;52(8):5311–5316. | ||
Querques G, Lattanzio R, Querques L, et al. Enhanced depth imaging optical coherence tomography in type 2 diabetes. Invest Ophthalmol Vis Sci. 2012;53(10):6017–6024. | ||
Shen ZJ, Yang XF, Xu J, et al. Association of choroidal thickness with early stages of diabetic retinopathy in type 2 diabetes. Int J Ophthalmol. 2017;10(4):613–618. | ||
Xu J, Xu L, Du KF, et al. Subfoveal choroidal thickness in diabetes and diabetic retinopathy. Ophthalmology. 2013;120(10):2023–2028. | ||
Tavares Ferreira JT, Vicente A, Proença R, et al. Choroidal thickness in diabetic patients without diabetic retinopathy. Retina. 2018;38(4):795–804. | ||
Kim JT, Lee DH, Joe SG, Kim JG, Yoon YH. Changes in choroidal thickness in relation to the severity of retinopathy and macular edema in type 2 diabetic patients. Invest Ophthalmol Vis Sci. 2013;54(5):3378–3384. | ||
Manaviat MR, Afkhami M, Shoja MR. Retinopathy and microalbuminuria in type II diabetic patients. BMC Ophthalmol. 2004;4:9. | ||
Chen H, Zheng Z, Huang Y, et al. A microalbuminuria threshold to predict the risk for the development of diabetic retinopathy in type 2 diabetes mellitus patients. PLoS One. 2012;7(5):e36718. | ||
Laíns I, Talcott KE, Santos AR, et al. Choroidal thickness in diabetic retinopathy assessed with swept-source optical coherence tomography. Retina. 2018;38(1):173–182. | ||
Abadia B, Suñen I, Calvo P, Bartol F, Verdes G, Ferreras A. Choroidal thickness measured using swept-source optical coherence tomography is reduced in patients with type 2 diabetes. PLoS One. 2018;13(2):e0191977. | ||
Tan CS, Ngo WK, Cheong KX. Comparison of choroidal thicknesses using swept source and spectral domain optical coherence tomography in diseased and normal eyes. Br J Ophthalmol. 2015;99(3):354–358. | ||
Jo Y, Ikuno Y, Iwamoto R, Okita K, Nishida K. Choroidal thickness changes after diabetes type 2 and blood pressure control in a hospitalized situation. Retina. 2014;34(6):1190–1198. | ||
Kocasarac C, Yigit Y, Sengul E, Sakalar YB. Choroidal thickness alterations in diabetic nephropathy patients with early or no diabetic retinopathy. Int Ophthalmol. 2017;38(2):721–726. | ||
Farias LB, Lavinsky D, Schneider WM, Guimarães L, Lavinsky J, Canani LH. Choroidal thickness in patients with diabetes and microalbuminuria. Ophthalmology. 2014;121(10):2071–2073. | ||
Malerbi FK, Regatieri CV, de Sa JR, Morales PH, Farah ME, Dib SA. Microalbuminuria is associated with increased choroidal thickness in type 1 diabetes mellitus patients without diabetic retinopathy. Acta Ophthalmol. 2017;96(1):e95–e97. | ||
Balmforth C, van Bragt JJ, Ruijs T, et al. Chorioretinal thinning in chronic kidney disease links to inflammation and endothelial dysfunction. JCI Insight. 2016;1(20):e89173. | ||
Wang JC, Laíns I, Providência J, et al. Diabetic choroidopathy: choroidal vascular density and volume in diabetic retinopathy with swept-source optical coherence tomography. Am J Ophthalmol. 2017;184:75–83. |
 © 2018 The Author(s). This work is published and licensed by Dove Medical Press Limited. The
full terms of this license are available at https://www.dovepress.com/terms
and incorporate the Creative Commons Attribution
- Non Commercial (unported, 3.0) License.
By accessing the work you hereby accept the Terms. Non-commercial uses of the work are permitted
without any further permission from Dove Medical Press Limited, provided the work is properly
attributed. For permission for commercial use of this work, please see paragraphs 4.2 and 5 of our Terms.
© 2018 The Author(s). This work is published and licensed by Dove Medical Press Limited. The
full terms of this license are available at https://www.dovepress.com/terms
and incorporate the Creative Commons Attribution
- Non Commercial (unported, 3.0) License.
By accessing the work you hereby accept the Terms. Non-commercial uses of the work are permitted
without any further permission from Dove Medical Press Limited, provided the work is properly
attributed. For permission for commercial use of this work, please see paragraphs 4.2 and 5 of our Terms.