
Back to Journals » Vascular Health and Risk Management » Volume 21
Changes and Diagnostic Value of Serum CCL26 and CCR3 in T2DM with Lower Extremity Artery Disease
Authors Zhang X  , Jia T, Li L, Jiang X, Wang M
Received 15 May 2025
Accepted for publication 26 September 2025
Published 15 October 2025 Volume 2025:21 Pages 823—833
DOI https://doi.org/10.2147/VHRM.S540586
Checked for plagiarism Yes
Review by Single anonymous peer review
Peer reviewer comments 2
Editor who approved publication: Dr Harry Struijker-Boudier
Xuyan Zhang,* Ting Jia,* Li Li, Xiaowan Jiang, Mengjie Wang
Department of Endocrinology, The Central Hospital of Wuhan, Tongji Medical College, Huazhong University of Science and Technology, Wuhan, Hubei, People’s Republic of China
*These authors contributed equally to this work
Correspondence: Xuyan Zhang, Department of Endocrinology, The Central Hospital of Wuhan, Tongji Medical College, Huazhong University of Science and Technology, No. 26 Shengli Street, Jiang’an District, Wuhan, Hubei, 430014, People’s Republic of China, Email [email protected]
Objective: To investigate the serum levels of Chemokine CCL26 (CCL26) and Receptors, CCR3 (CCR3) in patients with Diabetes Mellitus, Type 2 (T2DM) complicated by lower extremity artery disease (LEAD), and to evaluate their potential as diagnostic biomarkers for T2DM with LEAD.
Methods: A retrospective study was conducted involving 197 patients with T2DM between June 2022 and February 2025. Patients were divided into T2DM group (n=157) and LEAD group (n=40). Clinical data and fasting venous blood were collected to measure serum CCL26 and CCR3 levels. Pearson correlation analysis was used to assess the correlation between CCL26 and CCR3. Lasso regression and logistic regression models were employed to identify risk factors for LEAD. The receiver operating characteristic (ROC) curve was constructed to evaluate the predictive efficacy of CCL26 and CCR3 for LEAD.
Results: The LEAD group had significantly higher BMI, disease duration, HbA1C, FINS, and HOMA-IR compared to the T2DM group (P< 0.05). Serum levels of CCL26 and CCR3 were elevated in the LEAD group (P< 0.05). A positive correlation was found between CCL26 and CCR3 (r=0.337, P=0.034). Lasso regression identified 12 indicators, including CCL26 and CCR3, as predictors of LEAD. Logistic regression revealed that BMI, disease duration, HbA1C, CCL26, and CCR3 were independent risk factors for LEAD (P< 0.05). The combined detection of serum CCL26 and CCR3 had an AUC of 0.812, indicating high predictive value for LEAD in T2DM patients.
Conclusion: Serum CCL26 and CCR3 levels are elevated in T2DM patients with LEAD and are closely associated with its occurrence. Combined detection of these biomarkers shows good predictive value for LEAD in T2DM patients.
Keywords: diabetes mellitus, type 2, peripheral arterial disease, chemokine CCL26, receptors, CCR3
Introduction
Diabetes Mellitus, Type 2 (T2DM) is a chronic metabolic disease with an increasing incidence worldwide. It is often accompanied by a variety of complications, among which lower extremity artery disease (LEAD), also known as peripheral arterial disease (PAD), is one of the complications that seriously threaten patients’ quality of life and life safety.1–3 he occurrence and development of LEAD are related to a variety of factors, including hyperglycemia, insulin resistance, inflammatory response, and oxidative stress.4,5 Therefore, early diagnosis and intervention of LEAD are of great significance for enhancing the quality of life and prognosis of diabetic individuals.
In recent years, with the in-depth study of diabetes and its vascular complications, the role of a variety of biomarkers in the occurrence and development of the disease has gradually attracted attention.6,7 Chemokines are a class of cytokines that can induce directional cell migration and exert significant influence on inflammatory responses and immune regulation.8 Chemokine CCL26 (CCL26) is a chemokine of the CC subfamily, which can attract specific immune cells, such as eosinophils, to participate in local immune responses and inflammatory processes.9,10 Receptors, CCR3 (CCR3) serves as its cognate receptor, exhibiting broad expression on the cellular surface of inflammatory effectors, including eosinophils, monocytes, and macrophages. A study has shown that CCR3 is associated with gastric emptying abnormalities in patients with diabetes. It may contribute to the pathogenesis and complications of diabetes by influencing type 2 immune responses and T-cell functions.11 In individuals with T2DM, a state of chronic low-grade inflammation is often present, characterized by alterations in the expression and function of various inflammation-related molecules, including tumor necrosis factor-alpha (TNF-α) and interleukin-6 (IL-6).12 Given the pivotal roles of CCL26 and CCR3 in inflammatory processes and the complications of diabetes, a notable research gap exists regarding the expression changes and diagnostic potential of CCL26 and CCR3 in T2DM patients with LEAD.
This investigation is designed to elucidate the alterations of serum CCL26 and CCR3 in T2DM with LEAD and evaluate their potential as diagnostic biomarkers. It aspires to furnish novel biomarker evidence for the early diagnosis of T2DM with LEAD and offer new ideas and directions for clinical diagnosis and treatment.
Materials and Methods
Study Subjects
Previous studies have indicated that the prevalence of LEAD in patients with T2DM is approximately 19.99%.13 To ensure the scientific validity and reliability of this study, an error margin not exceeding 5.0% (ie, a confidence interval width of 10.0%) and a significance level of 1 - α = 0.9 (two-sided test) were set. The sample size was determined utilizing PASS 15.0 software, revealing that a minimum of 186 participants were necessary to guarantee the scientific validity and reliability of the study outcomes.
A retrospective selection of clinical data from 197 patients with T2DM who were treated in The Central Hospital of Wuhan, Tongji Medical College, Huazhong University of Science and Technology from June 2022 to February 2025 was conducted. Patients were stratified into the T2DM group (n=157) and the LEAD group (n=40) based on the presence or absence of LEAD.
Inclusion Criteria: (1) Patients fulfilled the diagnostic criteria for T2DM, which were defined as either a FPG level of ≥7.0 mmol/L, a random plasma glucose level of ≥11.1 mmol/L, or a 2-hour plasma glucose level of ≥11.1 mmol/L following a 75-g oral glucose tolerance test (OGTT);14 (2) Patients with LEAD were identified through color Doppler ultrasound or lower limb angiography, showing stenosis or occlusion of the lower limb arteries, accompanied by clinical symptoms such as intermittent claudication, rest pain, or lower limb ulcers; (3) Patients had no other significant cardiovascular or lower limb vascular diseases; (4) Patients had not received any drug therapy, surgical treatment, or lifestyle interventions within the 3 months prior to inclusion in the study. (5) Age ranging from 45 to 75 years.
Exclusion Criteria: (1) Patients with other types of diabetes, such as type 1 diabetes or specific types of diabetes; (2) Patients with malignant tumors; (3) Patients with acute complications of T2DM; (4) Patients with bleeding or coagulation disorders; (5) Patients with cerebrovascular diseases; (6) Patients with dysfunction of other important organs such as the heart, liver, or lungs; (7) Patients with infectious or acute/chronic infections; (8) Patients with autoimmune diseases; (9) Patients with alcohol or drug addiction; (10) Pregnant or breastfeeding women; (11) Patients with severe mental illness; (12) Patients with severe malnutrition or electrolyte imbalances.
Collection of Clinical Data
Clinical data of all patients at admission were collected, including gender, age, body mass index (BMI), disease duration, smoking history, alcohol consumption history, systolic blood pressure (SBP), diastolic blood pressure (DBP), and the presence of hypertension.
Fasting venous blood samples were obtained from all enrolled patients within 12 hours. Following centrifugation at 3500 revolutions per minute for 15 minutes, the resultant supernatant was collected and subsequently stored at −80°C in a freezer for subsequent analyses.
Fasting plasma glucose (FPG) levels were measured using the glucose oxidase–peroxidase (GOD-POD) method on an Abbott Alinity-c automated biochemical analyzer. Glycated hemoglobin A1C (HbA1C) concentrations were determined by high-performance liquid chromatography (HPLC) using a Tosoh G8 HPLC Analyzer. The automated biochemical analyzer (Abbott Alinity-c) was employed to measure total cholesterol (TC), triglycerides (TG), high-density lipoprotein cholesterol (HDLC), low-density lipoprotein cholesterol (LDLC), serum uric acid (SUA), and serum creatinine (Scr) levels. Fasting insulin (FINS) concentrations were detected using a chemiluminescent immunoassay analyzer (Abbott Architect i2000). Insulin resistance was evaluated using the Homeostasis Model Assessment of Insulin Resistance (HOMA-IR), calculated as follows: HOMA-IR = FPG × FINS/22.5.
Detection Methods for Serum CCL26 and CCR3
Serum CCL26 and CCR3 levels were measured using ELISA kits (Catalog numbers HM11183 and HM11577, respectively, from Wuhan Bioswamp Biotechnology Co., Ltd., China). Blood samples were collected from the biobank of The Central Hospital of Wuhan, Tongji Medical College, Huazhong University of Science and Technology. These samples were collected upon patient admission. The samples were allowed to stand at room temperature for 2 h, followed by centrifugation at 2500–3500×g for 20 minutes at 4°C. The supernatant was collected, aliquoted, and stored at −80°C to avoid repeated freeze-thaw cycles. For detection, the sandwich ELISA method was employed. Microplates coated with capture antibodies were used, to which standards and samples, biotinylated antibodies, and enzyme-labeled reagents were added sequentially. After washing, tetramethylbenzidine (TMB) was added for color development, and the optical density (OD) was measured at a wavelength of 450 nm. Concentrations were calculated using a standard curve. The detection range for CCL26 was 50–4000 pg/mL with a sensitivity of ≤10 pg/mL, and for CCR3, the range was 25–2000 pg/mL with a sensitivity of ≤5 pg/mL.
Statistical Analysis
Statistical analyses were performed using SPSS version 26.0. Normality of continuous variables was assessed prior to analysis. Normally distributed continuous variables were reported as mean ± standard deviation ( ), and intergroup comparisons were conducted using the independent samples t-test. Non-normally distributed continuous variables were summarized as median and interquartile range [M (P25, P75)], with between-group comparisons performed using the Mann–Whitney U-test. Categorical data were presented in the form of frequency (n) and percentage (%), and the chi-square test (χ²) was used to analyze differences between groups. Pearson correlation analysis was used to assess the correlation between CCL26 and CCR3. The LASSO regression model was developed using Python software (Python Software Foundation, Python 3.8, available at https://www.python.org/) to identify factors predicting the occurrence of LEAD, with variable selection implemented using the LASSO module from the scikit-learn library.15 Multivariate logistic regression modeling was employed to identify independent risk factors associated with LEAD in patients with T2DM. Receiver Operating Characteristic (ROC) curve analysis was conducted to assess the discriminatory capacity of serum CCL26 and CCR3 levels in predicting LEAD occurrence among T2DM patients. P<0.05 was considered statistically significant.
Results
Comparison of Clinical Data
As shown in Table 1, in comparison to the T2DM group, the LEAD group exhibited significantly elevated levels of BMI, disease duration, HbA1C, FINS, and HOMA-IR (P<0.05). However, no statistically significant differences were observed between the two groups regarding gender, smoking history, alcohol consumption history, SBP, DBP, prevalence of hypertension, fasting blood glucose, TC, TG, HDLC, LDLC, SUA, and Scr (P>0.05).
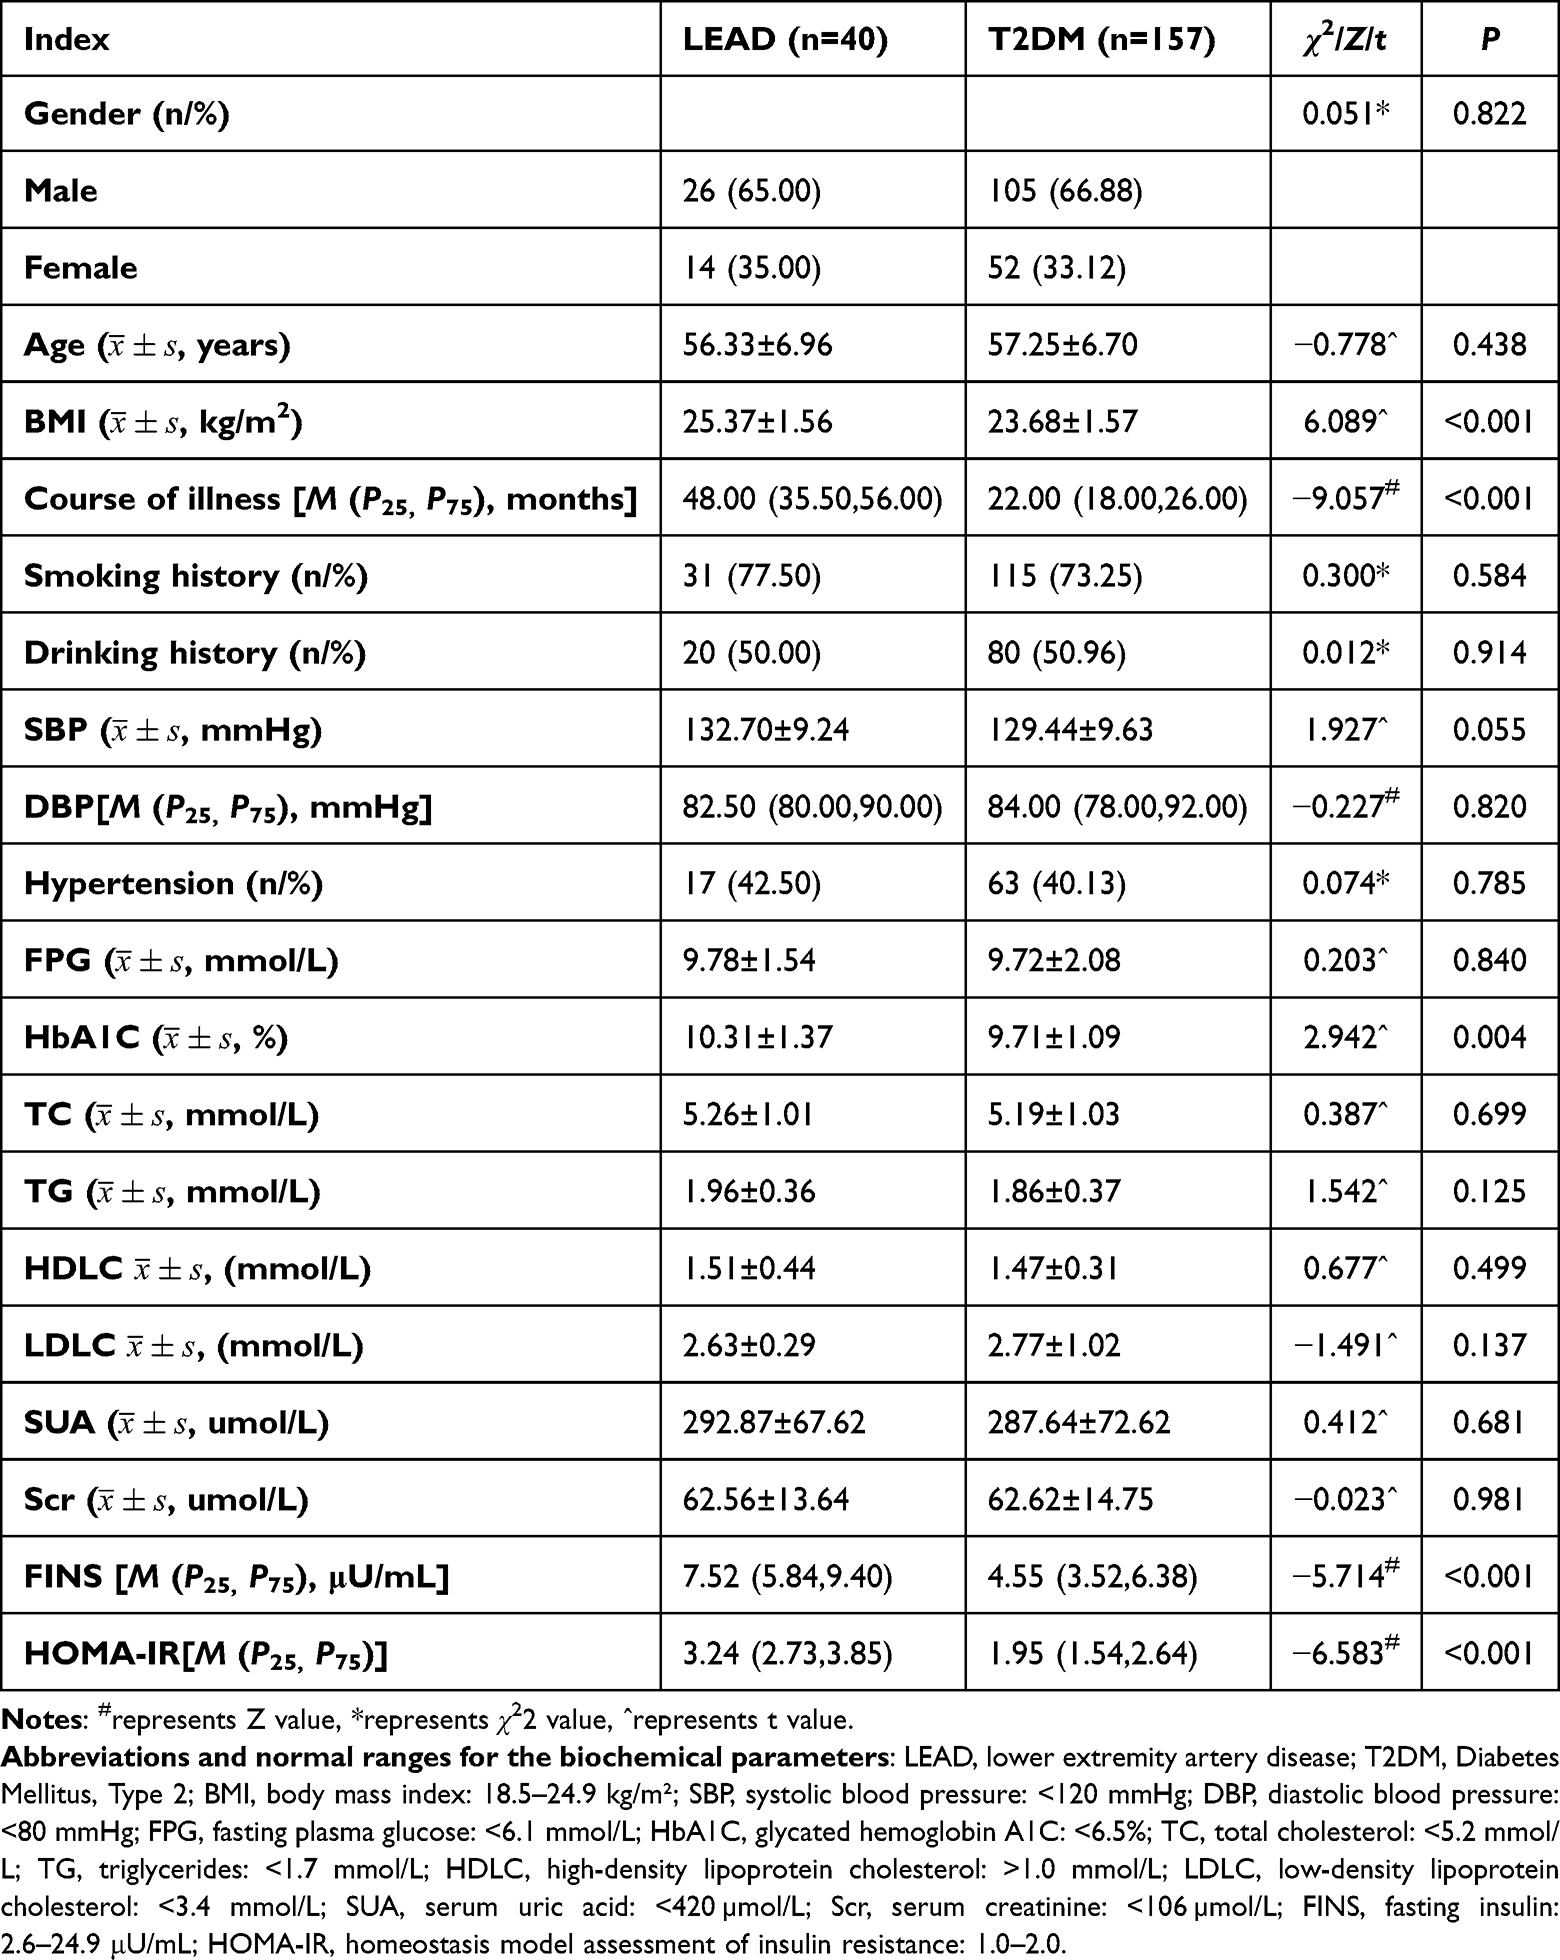 |
Table 1 Clinical Data Comparison |
Comparison of Serum CCL26 and CCR3 Levels Between the Two Groups
Compared with the T2DM group, patients with LEAD exhibited significantly elevated serum levels of CCL26 and CCR3 (P<0.05), as shown in Figure 1A and B.
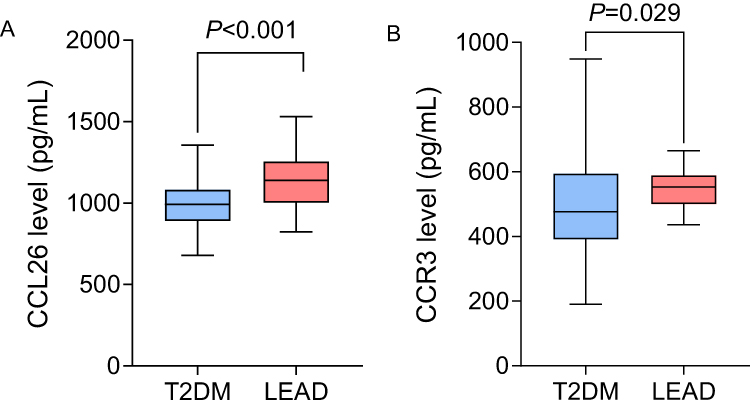 |
Figure 1 Comparison of serum CCL26 and CCR3 levels between two groups of patients. Note: (A) Comparison of serum CCL26 levels; (B) Comparison of serum CCR3 levels. |
Correlation Analysis of Serum CCL26 and CCR3
Pearson correlation analysis demonstrated a statistically significant positive correlation between serum CCL26 and CCR3 concentrations in the LEAD group, as shown in Figure 2.
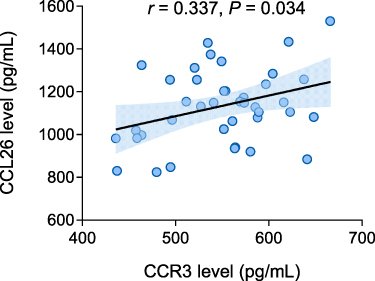 |
Figure 2 Correlation analysis results of serum CCL26 and CCR3 in LEAD group patients. |
LASSO Regression for Predictor Selection
LASSO regression is a linear regression method based on L1 regularization. It achieves sparse variable selection by incorporating an L1 penalty term (the sum of the absolute values of the regression coefficients) into the loss function. This method can simultaneously perform variable selection and parameter estimation, thereby avoiding the multiple comparison issues associated with traditional stepwise regression. The sparsity of the variables is adjusted by the parameter λ: a larger λ results in fewer selected variables, while a smaller λ retains more variables. The optimal value of λ is determined through cross-validation, which helps to balance model complexity and predictive ability, thereby preventing overfitting or underfitting.
In the present research, LASSO regression was utilized for predictor selection, incorporating the following independent variables: gender, age, BMI, diabetes duration, smoking history, alcohol consumption history, SBP, DBP, hypertension status, FPG, HbA1C, TC, TG, HDLC, LDLC, SUA, Scr, FINS, HOMA-IR, and serum CCL26 and CCR3 levels. The dependent variable was defined as the presence of LEAD in patients with T2DM. The optimal λ value was ascertained via cross-validation. The results showed that when λ=0.016, the model was optimal, and a total of 12 indicators were selected, including age, BMI, disease duration, SBP, DBP, FPG, HbA1C, SUA, Scr, FINS, and serum CCL26 and CCR3, as shown in Figures 3 and 4.
 |
Figure 3 LASSO Regression Cross Validation Error Path Diagram. |
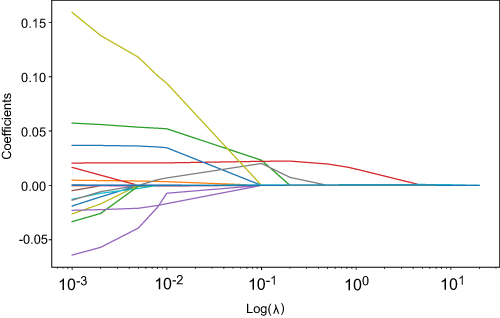 |
Figure 4 LASSO Regression Path Diagram. |
Logistic Regression Analysis of Independent Risk Factors for LEAD in T2DM Patients
Logistic regression analysis was conducted, utilizing the 12 variables identified through LASSO regression as independent predictors, with the presence of LEAD serving as the dependent variable (yes=1, no=0). The results showed that BMI, disease duration, HbA1C, CCL26, and CCR3 levels were independent risk factors for LEAD in T2DM patients (P<0.05), as shown in Table 2 and Figure 5.
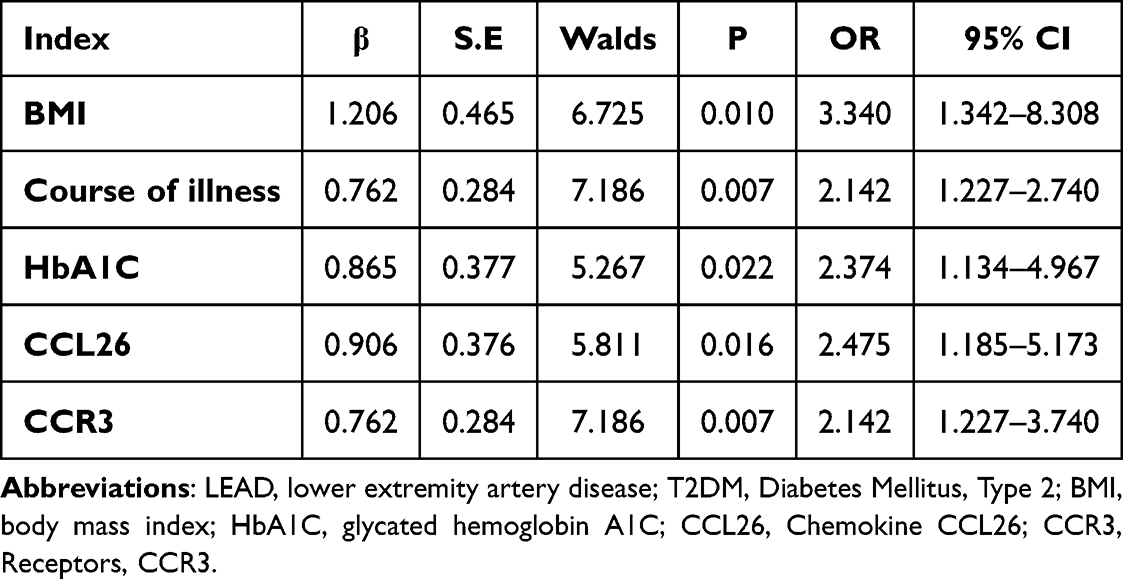 |
Table 2 Logistic Regression Analysis of the Impact of LEAD on T2DM Patients |
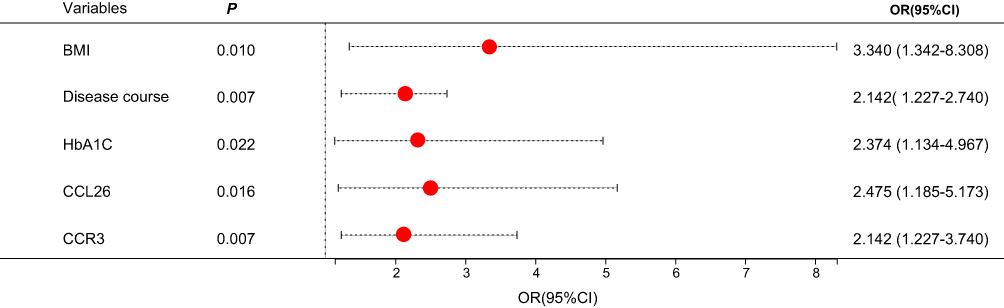 |
Figure 5 Forest plot of independent risk factors affecting the occurrence of LEAD in T2DM patients. Note: Each red dot corresponds to the estimated OR for the listed variables, with the 95% CI indicated by the dotted lines. The vertical dashed line represents the null effect where OR equals 1. |
Predictive Value of Serum CCL26 and CCR3 for LEAD in T2DM Patients
ROC curve analysis revealed that the combined prediction of serum CCL26 and CCR3 for LEAD in T2DM patients had an area under the curve (AUC) of 0.812, which was higher than that of serum CCL26 alone and CCR3 alone, as shown in Table 3 and Figure 6.
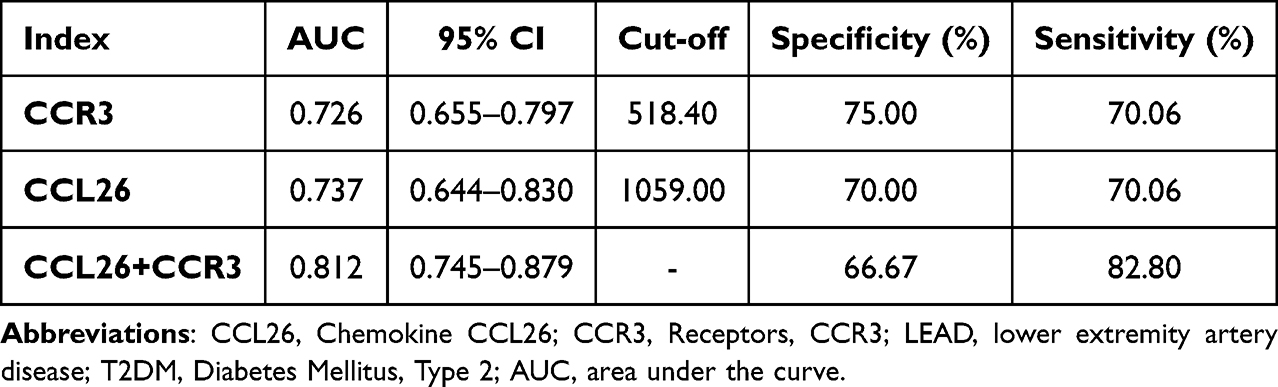 |
Table 3 The Value of Serum CCL26 and CCR3 in Predicting LEAD in T2DM Patients |
 |
Figure 6 ROC curves of serum CCL26 and CCR3 predicting LEAD occurrence in T2DM patients. |
Discussion
The coexistence of T2DM and LEAD represents a prevalent chronic complication observed in diabetic patients, with a high incidence and disability rate.16–18 Research has demonstrated that the risk of LEAD is significantly elevated in patients with T2DM, and the underlying mechanisms may be related to endothelial dysfunction, inflammatory responses, and accelerated atherosclerosis caused by long-term hyperglycemia.19 Therefore, early identification and active management of whether T2DM patients develop LEAD are crucial.
In this study, the disease duration and HOMA-IR were higher in the LEAD group than in the T2DM group. The reason may be that more severe insulin resistance can lead to endothelial dysfunction, promote inflammatory responses and oxidative stress, and thus accelerate the progression of atherosclerosis. At the same time, a longer disease duration means that patients have been in a state of hyperglycemia for a long time, which will further exacerbate vascular damage and increase the risk of atherosclerosis. Compared with the T2DM group, the HbA1C levels were significantly elevated in the LEAD group, whereas no statistically significant difference in FPG concentrations. This discrepancy may be attributed to poor postprandial blood glucose control, greater blood glucose fluctuations, and differences in insulin secretion function. Obesity constitutes a major risk factors for T2DM.20 In this study, the BMI in the LEAD group was significantly higher than that in the T2DM group, suggesting that a higher BMI not only increases the risk of T2DM but also exacerbates the progression of LEAD through various mechanisms.
Inflammation exerts a pivotal influence on the pathogenesis of atherosclerosis, and empirical evidence indicates that anti-inflammatory agents may represent supplementary therapeutic strategies for the prevention and management of atherosclerotic disease.21 Moreover, endothelial cell dysfunction and injury are the initiating factors of LEAD. Diseases such as diabetes and hyperlipidemia can impair the balance of endothelial cell proliferation and apoptosis, leading to anticoagulant dysfunction, inducing inflammatory responses and blood coagulation reactions, and ultimately progressing to atherosclerosis. Inflammatory responses can further damage endothelial cells, creating a vicious cycle.22,23
CCR3 is a receptor expressed on various cell types. Its upregulation can serve as a biomarker for inflammatory responses in the body and has emerged as a potential therapeutic target for eosinophil-associated diseases, such as asthma, allergic rhinitis, and atopic dermatitis.24 The interaction between CCL26 and CCR3 is involved in and modulates inflammatory responses, and elevated levels of CCL26 can serve as a biological indicator for assessing the severity of both acute and chronic inflammatory reactions.25–27 In the pathogenesis of LEAD, inflammatory responses and endothelial dysfunction are key factors. The upregulation of CCL26 and CCR3 is closely associated with the recruitment and activation of inflammatory cells, which may exacerbate vascular inflammation and the progression of atherosclerosis. Additionally, CCR3 is expressed in human microvascular endothelial cells, and its agonists can function as chemoattractants for vascular endothelium, thereby promoting angiogenesis.28 Research has demonstrated that anti-CCR3 therapeutic interventions effectively suppress retinal neovascularization, suggesting a novel pharmacological approach for the management of retinopathic conditions.29 In LEAD, the upregulation of CCL26 and CCR3 may induce the chemotaxis and activation of inflammatory cells, thereby further damaging endothelial cells, and exacerbating vascular inflammation and the progression of atherosclerosis. In this study, serum concentrations of CCL26 and CCR3 were found to be significantly elevated in the LEAD group compared to the T2DM group, and Pearson correlation analysis demonstrated a statistically significant positive association serum CCL26 and CCR3 levels in T2DM patients with LEAD, confirming the synergistic role of CCL26 and CCR3 in inflammatory responses and suggesting that they may play an important role in the pathogenesis of LEAD.
Through LASSO and logistic regression model analysis in this study, it was found that BMI, disease duration, HbA1C, CCL26, and CCR3 are independent risk factors for LEAD in T2DM patients. A higher BMI is usually associated with insulin resistance, chronic low-grade inflammation, and endothelial dysfunction, which promote the occurrence and development of atherosclerosis.30,31 Elevated HbA1C indicates poor long-term blood glucose control in patients, and chronic hyperglycemia can lead to endothelial damage, exacerbated inflammatory responses, and abnormal lipid metabolism.32,33 These pathological changes are important factors in accelerating the occurrence and progression of atherosclerosis and significantly affect the risk of LEAD in T2DM patients. The elevated levels of serum CCL26 and CCR3 indicate their joint participation in the regulation of inflammatory responses, and these factors significantly influence the occurrence and development of LEAD in patients with T2DM. The ROC curve analysis demonstrated that the AUC for predicting LEAD in patients with T2DM using serum CCL26, CCR3, and their combination were all between 0.7 and 0.9, suggesting that serum CCL26 and CCR3 levels can serve as indicators for predicting LEAD in T2DM patients, and combined detection can enhance predictive value.
Conclusion
In this study, we have demonstrated that serum levels of CCL26 and CCR3 are significantly elevated in patients with T2DM complicated by LEAD, and these biomarkers are closely associated with the occurrence of LEAD. Our findings from LASSO regression and logistic regression analyses identified BMI, disease duration, HbA1C, CCL26, and CCR3 as independent risk factors for LEAD in T2DM patients. Furthermore, the combined detection of serum CCL26 and CCR3 showed a high predictive value for LEAD, with an AUC of 0.812, indicating that these biomarkers could serve as effective indicators for early assessment and risk stratification in clinical practice. These results not only provide novel insights into the pathophysiology of LEAD in T2DM but also offer potential new targets for therapeutic interventions. Identifying these biomarkers may facilitate earlier detection and management of LEAD, thereby improving patient outcomes and quality of life. However, we acknowledge the limitations of our study, including its single-center design and relatively small sample size. Future research should involve multicenter studies with larger and more diverse cohorts. This would help validate our findings and further explore the underlying mechanisms through which CCL26 and CCR3 contribute to the development of LEAD. Additionally, investigating the potential therapeutic implications of targeting the CCL26-CCR3 axis in T2DM patients with LEAD could be a promising area for future research. We believe that our study contributes significantly to the field and highlights the need for further investigation into the role of these biomarkers in the management of T2DM and its complications.
Abbreviations
CCL26, Chemokine CCL26; CCR3, Receptors, CCR3; T2DM, Diabetes Mellitus, Type 2; LEAD, lower extremity artery disease; ROC, Receiver Operating Characteristic Curve; OGTT, oral glucose tolerance test; BMI, body mass index; SBP, systolic blood pressure; DBP, diastolic blood pressure; FPG, fasting plasma glucose; HbA1C, glycated hemoglobin A1C; TC, total cholesterol; TG, triglycerides; HDLC, high-density lipoprotein cholesterol; LDLC, low-density lipoprotein cholesterol; SUA, serum uric acid; Scr, serum creatinine; FINS, fasting insulin; HOMA-IR, homeostasis model assessment of insulin resistance; AUC, area under the curve.
Data Sharing Statement
The data are available from the corresponding author upon reasonable request.
Ethics Approval and Informed Consent
This study was approved by the Ethics Committee of The Central Hospital of Wuhan, Tongji Medical College, Huazhong University of Science and Technology (approval number: WHZXKYL-2025-024) and strictly followed the relevant provisions of the Helsinki Declaration. Due to the nature of the retrospective study and the anonymity of the data, informed consent was waived with the approval of The Central Hospital of Wuhan, Tongji Medical College, Huazhong University of Science and Technology.
Acknowledgments
We deeply thank all the all the researchers who contributed to this project.
Funding
This study was funded by the Wuhan Municipal Health Commission Project (WX20B32).
Disclosure
The author(s) report no conflicts of interest in this work.
References
1. Soyoye DO, Abiodun OO, Ikem RT, Kolawole BA, Akintomide AO. Diabetes and peripheral artery disease: a review. World J Diabetes. 2021;12(6):827–838. doi:10.4239/wjd.v12.i6.827
2. Lu X, Xie Q, Pan X, et al. Type 2 diabetes mellitus in adults: pathogenesis, prevention and therapy. Signal Transduct Target Ther. 2024;9(1):262. doi:10.1038/s41392-024-01951-9
3. Abián MF, Vanesa BB, Diego BG, et al. Frequency of lower extremity artery disease in type 2 diabetic patients using pulse oximetry and the ankle-brachial index. Int J Med Sci. 2021;18(13):2776–2782. doi:10.7150/ijms.58907
4. Aleksandrowicz M, Konop M, Rybka M, et al. Dysfunction of microcirculation in atherosclerosis: implications of nitric oxide, oxidative stress, and inflammation. Int J Mol Sci. 2025;26(13):6467. doi:10.3390/ijms26136467
5. Weinberg Sibony R, Segev O, Dor S, Raz I. Overview of oxidative stress and inflammation in diabetes. J Diabetes. 2024;16(10):e70014. doi:10.1111/1753-0407.70014
6. Zaib S, Ahmad S, Khan I, Bin Jardan YA, Fentahun Wondmie G. An evaluation of inflammatory and endothelial dysfunction markers as determinants of peripheral arterial disease in those with diabetes mellitus. Sci Rep. 2024;14(1):15348. doi:10.1038/s41598-024-65188-w
7. Savvopoulos S, Hatzikirou H, Jelinek HF. Comparative analysis of biomarkers in type 2 diabetes patients with and without comorbidities: insights into the role of hypertension and cardiovascular disease. Biomark Insights. 2024;19:11772719231222111. doi:10.1177/11772719231222111
8. Xu H, Lin S, Zhou Z, et al. New genetic and epigenetic insights into the chemokine system: the latest discoveries aiding progression toward precision medicine. Cell Mol Immunol. 2023;20(7):739–776. doi:10.1038/s41423-023-01032-x
9. Pum A, Ennemoser M, Gerlza T, Kungl AJ. The role of heparan sulfate in CCL26-induced Eosinophil chemotaxis. Int J Mol Sci. 2022;23(12):6519. doi:10.3390/ijms23126519
10. Moon HG, Kim SJ, Kim KH, et al. CX(3)CR(1)(+) macrophage facilitates the resolution of allergic lung inflammation via interacting CCL26. Am J Respir Crit Care Med. 2023;207(11):1451–1463. doi:10.1164/rccm.202209-1670OC
11. Puthanmadhom Narayanan S, Lee JH, Bhagwate A, et al. Epigenetic alterations are associated with gastric emptying disturbances in diabetes mellitus. Clin Transl Gastroenterol. 2020;11(3):e00136. doi:10.14309/ctg.0000000000000136
12. Berbudi A, Khairani S, Tjahjadi AI. Interplay between insulin resistance and immune dysregulation in type 2 diabetes mellitus: implications for therapeutic interventions. Immunotargets Ther. 2025;14:359–382. doi:10.2147/ITT.S499605
13. Xu XY, Wu HY, Wei Q. Obesity-related indices as predictors of lower extremity arterial disease in type 2 diabetes mellitus. Endocrine. 2025;87(2):554–561. doi:10.1007/s12020-024-04039-0
14. Harreiter J, Roden M. Diabetes mellitus – definition, Klassifikation, Diagnose, Screening und Prävention (Update 2023) [Diabetes mellitus: definition, classification, diagnosis, screening and prevention (Update 2023)]. Wien Klin Wochenschr. 2023;135(Suppl 1):7–17. doi:10.1007/s00508-022-02122-y
15. Pedregosa F, Varoquaux G, Gramfort A, et al. Scikit-learn: machine learning in python. J Mach Learn Res. 2011;12(85):2825–2830.
16. Zhu R, Zhou S, Xia L, Bao X. Incidence, morbidity and years lived with disability due to type 2 diabetes mellitus in 204 countries and territories: trends from 1990 to 2019. Front Endocrinol. 2022;13:905538. doi:10.3389/fendo.2022.905538
17. Takahara M. Diabetes mellitus and lower extremity peripheral artery disease. JMA J. 2021;4(3):225–231.
18. Grant B, Sandelson M, Agyemang-Prempeh B, Zalin A. Managing obesity in people with type 2 diabetes. Clin Med. 2021;21(4):e327–e231. doi:10.7861/clinmed.2021-0370
19. Shati AA, Maarouf A, Dawood AF, et al. Lower extremity arterial disease in type 2 diabetes mellitus: metformin inhibits femoral artery ultrastructural alterations as well as vascular tissue levels of AGEs/ET-1 axis-mediated inflammation and modulation of vascular iNOS and eNOS expression. Biomedicines. 2023;11(2):361. doi:10.3390/biomedicines11020361
20. Chandrasekaran P, Weiskirchen R. The role of obesity in type 2 diabetes mellitus-an overview. Int J Mol Sci. 2024;25(3):1882. doi:10.3390/ijms25031882
21. Chan NC, Xu K, de Vries TAC, Eikelboom JW, Hirsh J. Inflammation as a mechanism and therapeutic target in peripheral artery disease. Can J Cardiol. 2022;38(5):588–600. doi:10.1016/j.cjca.2022.01.026
22. Kavurma MM, Bursill C, Stanley CP, et al. Endothelial cell dysfunction: implications for the pathogenesis of peripheral artery disease. Front Cardiovasc Med. 2022;9:1054576. doi:10.3389/fcvm.2022.1054576
23. Abu-Saleh N, Yaseen H, Kinaneh S, Khamaisi M, Abassi Z. Combination of hyperglycaemia and hyperlipidaemia induces endothelial dysfunction: role of the endothelin and nitric oxide systems. J Cell Mol Med. 2021;25(4):1884–1895. doi:10.1111/jcmm.15787
24. Wang J, Zhan M, Gu F, et al. Diagnostic use of CCR3, CD63, CD203c and FcεRIα on blood leukocytes of allergic asthma and combined allergic rhinitis and asthma syndrome. J Cell Mol Med. 2025;9(12):e70594. doi:10.1111/jcmm.70594
25. Shou J, Peng J, Zhao Z, et al. CCL26 and CCR3 are associated with the acute inflammatory response in the CNS in experimental autoimmune encephalomyelitis. J Neuroimmunol. 2019;333:576967. doi:10.1016/j.jneuroim.2019.576967
26. Yuan J, Liu Y, Yu J, et al. Gene knockdown of CCR3 reduces eosinophilic inflammation and the Th2 immune response by inhibiting the PI3K/AKT pathway in allergic rhinitis mice. Sci Rep. 2022;12(1):5411. doi:10.1038/s41598-022-09467-4
27. Hoste L, Meertens B, Ogunjimi B, et al. Identification of a 5-Plex cytokine signature that differentiates patients with multiple systemic inflammatory diseases. Inflammation. 2025;48(4):2182–2197. doi:10.1007/s10753-024-02183-3
28. Wang Y, Gao Y, Shi H, et al. CCL11 released by GSDMD-mediated macrophage pyroptosis regulates angiogenesis after hindlimb ischemia. Cell Death Discov. 2024;10(1):294. doi:10.1038/s41420-023-01764-9
29. Hirahara S, Nozaki M, Ohbayashi M, Hasegawa N, Ozone D, Ogura Y. Suppression of retinal neovascularization by anti-CCR3 treatment in an oxygen-induced retinopathy model in mice. Ophthalmic Res. 2017;58(1):56–66. doi:10.1159/000463238
30. Soták M, Clark M, Suur BE, Börgeson E. Inflammation and resolution in obesity. Nat Rev Endocrinol. 2025;21(1):45–61. doi:10.1038/s41574-024-01047-y
31. Chen X, Shi C, Wang Y, et al. The mechanisms of glycolipid metabolism disorder on vascular injury in type 2 diabetes. Front Physiol. 2022;13:952445. doi:10.3389/fphys.2022.952445
32. Sherwani SI, Khan HA, Ekhzaimy A, Masood A, Sakharkar MK. Significance of HbA1c test in diagnosis and prognosis of diabetic patients. Biomark Insights. 2016;11:95–104. doi:10.4137/BMI.S38440
33. Hasheminasabgorji E, Dyslipidemia JJC. Diabetes and atherosclerosis: role of inflammation and ROS-redox-sensitive factors. Biomedicines. 2021;9(11):1602. doi:10.3390/biomedicines9111602
 © 2025 The Author(s). This work is published and licensed by Dove Medical Press Limited. The
full terms of this license are available at https://www.dovepress.com/terms
and incorporate the Creative Commons Attribution
- Non Commercial (unported, 4.0) License.
By accessing the work you hereby accept the Terms. Non-commercial uses of the work are permitted
without any further permission from Dove Medical Press Limited, provided the work is properly
attributed. For permission for commercial use of this work, please see paragraphs 4.2 and 5 of our Terms.
© 2025 The Author(s). This work is published and licensed by Dove Medical Press Limited. The
full terms of this license are available at https://www.dovepress.com/terms
and incorporate the Creative Commons Attribution
- Non Commercial (unported, 4.0) License.
By accessing the work you hereby accept the Terms. Non-commercial uses of the work are permitted
without any further permission from Dove Medical Press Limited, provided the work is properly
attributed. For permission for commercial use of this work, please see paragraphs 4.2 and 5 of our Terms.
Recommended articles

Application of Metabolomics and Traditional Chinese Medicine for Type 2 Diabetes Mellitus Treatment
Li J, Zhu N, Wang Y, Bao Y, Xu F, Liu F, Zhou X
Diabetes, Metabolic Syndrome and Obesity 2023, 16:4269-4282
Published Date: 28 December 2023