Back to Journals » Neuropsychiatric Disease and Treatment » Volume 11
Change in prevalence status for children with developmental delay in Taiwan: a nationwide population-based retrospective study
Authors Kuo H, Muo C, Chang Y, Lin C ![]()
Received 6 March 2015
Accepted for publication 15 April 2015
Published 24 June 2015 Volume 2015:11 Pages 1541—1547
DOI https://doi.org/10.2147/NDT.S84088
Checked for plagiarism Yes
Review by Single anonymous peer review
Peer reviewer comments 2
Editor who approved publication: Professor Wai Kwong Tang
Huang-Tsung Kuo,1,2 Chih-Hsin Muo,1,3 Yu-Tzu Chang,1,4 Chin-Kai Lin5
1School of Medicine, China Medical University, 2Department of Developmental and Behavioral Pediatrics, Children’s Hospital of China Medical University, 3Management Office for Health Data, China Medical University Hospital, 4Department of Pediatric Neurology, Children’s Hospital of China Medical University, 5Program of Early Intervention, Department of Early Childhood Education, National Taichung University of Education, Taichung, Taiwan
Abstract: The purpose of this study was to estimate the prevalence of children aged 0–6 years with developmental delay (DD) and to examine age-period trends in the prevalence of DD diagnosis in Taiwan. For the study population, we selected children aged <6 years at baseline (in 1997–2002, N=2,308,790) from the National Health Insurance Research Database (a longitudinal database with annual medical records of children in Taiwan) to estimate the prevalence of DD. All study subjects were followed up until they were 5 years old; the study period was from 1997 to 2008. The prevalence of DD by year gradually increased from 0.16% to 3.25% from 1997 to 2008 with an increasing ratio of prevalence of 20% over the 12-year study period. The prevalence of DD in boys was 2.13 times (2.09–2.18 from 1997 to 2008) that in girls. The prevalence of DD increased by year of study. The effect of sex on the prevalence of DD was significant. Understanding the trend of prevalence in the study period and the gap between the rate of early treatment and DD prevalence are critical concerns for future research.
Keywords: prevalence, children with developmental delay, assessment center, early intervention, diagnosis
Introduction
Developmental delay (DD) refers to below average psychosocial and mental development in children aged 0–6 years for the following developmental domains: cognitive, physical, language and communication, and social and emotional skills (Ministry of Health and Welfare, 2012, Article 9). The prevalence of DD among children in Taiwan is confirmed by psychometric testing administered by medical specialists (appointed by governmental authorities) before diagnosis certificates are issued. At a minimum, children with DD should be reevaluated annually to reconfirm their diagnostic designation.
Early intervention services involve case finding/detection1 and referral,2 screening,2 assessment and diagnosis,3 case management,4 and intervention placement.5 Case finding/detection and assessment and diagnosis are crucial processes in early intervention to ensure early recognition and referral for children with DD.6,7
The government of Taiwan further promotes the early intervention of DD through the laws of the “Protection of Children and Youths Welfare and Rights Act”. Two units, namely the Child Developmental Assessment Center and Assessment Center for Child Development, have been established by the government and tasked with the assessment and diagnosis of DD. Since its establishment in 1997, the Child Developmental Assessment Center has grown to include 30 diagnostic centers. However, because of the overwhelming number of cases requiring assessment, the Assessment Center for Child Development was established in 2009. Thus far, there are 76 branches of the Assessment Center for Child Development assisting with the diagnosis of children with DD. The main scope of their responsibilities is to screen children at risk, provide transdisciplinary assessments, diagnose the children with DD, and write assessment and therapy recommendation reports.7 The hospital departments providing leadership in these responsibilities are the rehabilitation, pediatric neurology, and pediatric psychiatry departments.
After diagnosis with DD, children can be qualified to receive related services if any service is identified for improving their development; these services are supported by early intervention funding from the government, and include occupational therapy, physical therapy, speech therapy, and special education. Through early detection and diagnostic functions, children with DD can benefit from improvements in their development at an early stage,8,9 thus minimizing their future need for special medical and educational care.
Prevalence or incidence can be used to present the severity of health concerns and predict the level of support required in health care, education, and society.10 The incidence rate of DD is the number of new cases identified by doctors in a given time period and is more frequently used for short and recent period event calculation. An incidence rate is useful for recent impressions and suggestions, such as suggestions for funding levels. A well-known use of incidence rates is that used for special education in Ontario, which is evaluated every 1–2 years and has resulted in spending cuts (Ministry of Education of Ontario, 2014). The DD prevalence rate indicates the proportion of cases at a certain time period for a certain region and is more frequently used for longer time periods in a particular region. The prevalence rate is more useful regarding suggestions or strategies over a longer time period and in comparison with conditions in other nations. This function of incidence and prevalence rates includes the budgeting of estimated funds or the establishment of early therapy policies.
Rosenberg et al11 reported the prevalence of DD as 10%–13% for people aged 9–24 months and born in 2001 in the United States. However, the result does not include prevalence rates for older children. Boyle et al10 found that the prevalence of developmental disability was 13.87% for children aged 3–17 years, based on a sampling from the database of the National Health Interview Survey from 1997 to 2008.10
In a study of parent interviews that included a functional delay questionnaire and a general delay questionnaire, the prevalence rates for functional delay and general delay were 3.3% and 3.4%, respectively, in a sampling of 5,291 infants and children aged 4–59 months from the 1994–1995 National Health Interview Survey on Disability.12 The advantage of this study was that it employed a satisfactory representative sample; its drawback was that the field representatives of the Bureau of Census, who interviewed the parents to obtain the questionnaire responses, underwent only 3 days of training. A study on DD prevalence and incidence rates in Taiwan is needed, including whether an increase in DD detection rates has occurred since the establishment of the Child Developmental Assessment Center in 1997.
The present study used large-scale data of one million insured children randomly selected from the Longitudinal Health Insurance Database to extensively analyze the effects of age, period, and prevalence from 1997 to 2008. The purpose of this study was to estimate the prevalence of DD in children aged 0–6 years and analyze the effects of sex, age, and time period on DD prevalence.
Methods
Data source
Children are included among those insured by the National Health Insurance (NHI) program of Taiwan and whose data are collected by the National Health Research Institutes (NHRI) to form the National Health Insurance Research Database (NHIRD). The NHI program was established on March 1, 1995 and covers over 99% of the population of Taiwan (http://www.nhi.gov.tw). The file of children’s data from the NHRI includes a random selection of 50% of the children in the NHIRD. The database contains all the medical records of each child from 1996 to 2008. The identities of the insured children are recoded to ensure privacy before being sent to researchers, and this study was approved by the institutional review board of the China Medical University and Hospital in Taiwan. Diseases identified in the NHIRD are based on the International Classification of Diseases, Ninth Revision, Clinical Modification (ICD-9-CM).
Measures and procedure
In the NHIRD, we applied diagnostic codes from a version of the ICD-9 prior to 2014 and used psychiatric classifications between 1994 and 2014 from the DSM-IV-TR. For this retrospective study, data were available from 1997 to 2008; therefore, we used the diagnostic concepts and classification from the DSM-IV-TR and determined all of the ICD-9 codes related to DD that would exhibit symptoms in children aged <6 years.
Study sample
We selected children aged <6 years at baseline (in 1997–2002) from the NHIRD as the study population (N=2,308,790). Because the NHIRD is a longitudinal database, it provided the annual medical records of our study participants. Data from the annual medical records were used to estimate the prevalence of DD. The study criteria included children with a DD diagnosis code (ICD-9-CM codes 299, 312.81, 312.89, 312.9, 313–315, 317–319, 783.42, V79.8, and V79.9) who had been administered assessments for DD. About the diagnostic process, children with all kinds of DD will go through a formal developmental assessment process for ascertaining the diagnosis. In this NHI database, we used the diagnostic codes of all kinds of DDs, which was coded by clinician and appears in two continuous years and at the same time, a formal developmental assessment was performed in these 2 years, we then confirm the diagnosis. The diagnostic codes were used according to ICD-9, which correlated with DSM-IV-TR and appears before 6 years old. At the same time, the diagnostic tools are available and standardized in Taiwan and could be performed in all the professional departments. Because the formal assessment codes can only be used by clinical child psychologists, the consensus of the assessment and criteria have been discussed and re-evaluated often among government and assessment centers since 1996 in Taiwan. Study subjects were followed up until they were 5 years old or until the end of 2008. Each year equaled one time point; all of the study participants had a maximum of six time points. There were 9,788,155 time points in this study.
Statistical analysis
A chi-square test was used to assess sex differences and compare the effect of sex on DD prevalence in the children. The prevalence of DD in children by time period and age (%) was estimated. The trend test for each time period employed the Cochran–Armitage test. The effects of sex, age, and time period on the prevalence rate ratio (PRR) were estimated using Poisson regression with a generalized estimating equations (GEE) model designed to control for the potential correlation of within-subject repeated measurements (multiple years for each subject). No severe multicollinearity was observed between age and time period according to the correlation coefficient of the correlation matrix. A multivariable Poisson regression model controlled for age, sex, and time period. All of the analyses were performed using the SAS Version 9.3 statistical software for Windows (SAS Institute Inc., Cary, NC, USA); a two-sided P<0.05 was considered significant.
Results
Prevalence and distribution for children with developmental delays
The overall prevalence of DD in children aged 0–5 years was 1.41% from 1997 to 2008. The prevalence of DD in boys was higher than that in girls (1.84% vs 0.94%, Figure 1), and the prevalence increased with aging from 0.14% at 0 years to 2.55% at 5 years (Figure 2). The same trend occurred in each time period. The annual prevalence of DD increased from 0.16% in 1997 to 3.25% in 2008 (P for trend <0.0001) (Figure 1). The same trends occurred in both sexes and for each age group.
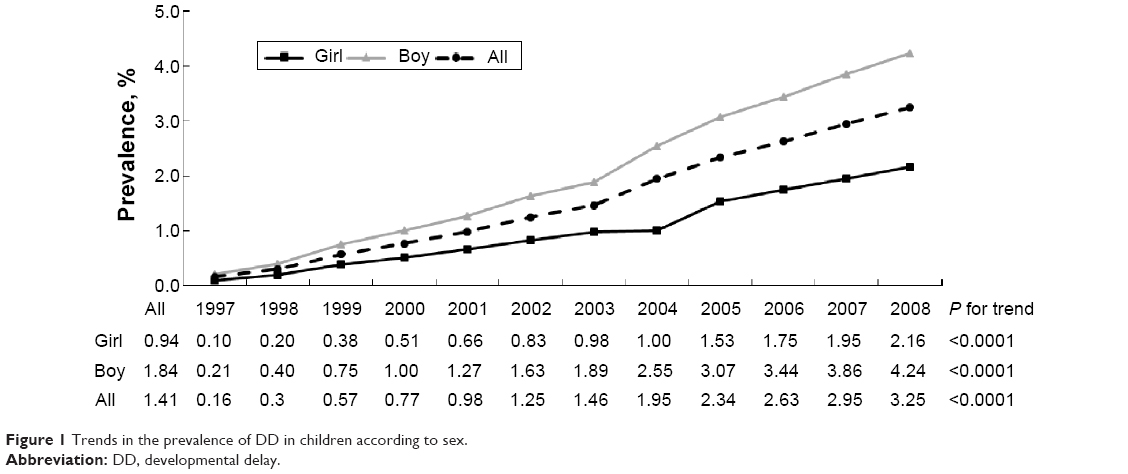 | Figure 1 Trends in the prevalence of DD in children according to sex. |
 | Figure 2 Trends in the prevalence of DD in children of different ages. |
Effects of age, sex, and time period on DD
In the multivariable Poisson regression with a GEE model, the prevalence of DD in boys was 2.13-fold higher than that in girls (95% confidence interval [CI]: 2.09–2.18) (Table 1). The PRR increased with aging (PRR =1.44, 95% CI: 1.44–1.45). Compared with the prevalence in children aged 0 year, the prevalence increased with age from 4.05 times (95% CI: 3.88–4.22) at 1 year old to 18.0 times (95% CI: 17.2–18.9) at 5 years old. The risk of prevalence increased by 1.23 times for every year (95% CI: 1.23–1.23). Compared with the effect of time period in 1997, the effect of time period increased from a risk of 1.82 (95% CI: 1.74–1.89) in 1998 to a risk of 19.5 (95% CI: 18.6–20.5) in 2008.
 | Table 1 Effects of age, sex, and time period on DD in children aged 0–5 years |
The sex-specific PRR is presented in Table 2. The PRR for DD increased with age in boys more than in girls (PRR =1.47 vs 1.40, interaction P<0.0001). In boys, the PRR increased from 4.14 at 1 year old to 21.1 at 5 years old (95% CI from 3.92–4.37 to 19.9–22.4), compared with those aged 0 year. In girls, the risk of prevalence for DD increased from 3.93 at 1 year old to 13.5 at 5 years old (95% CI from 3.68–4.19 to 12.6–14.5).
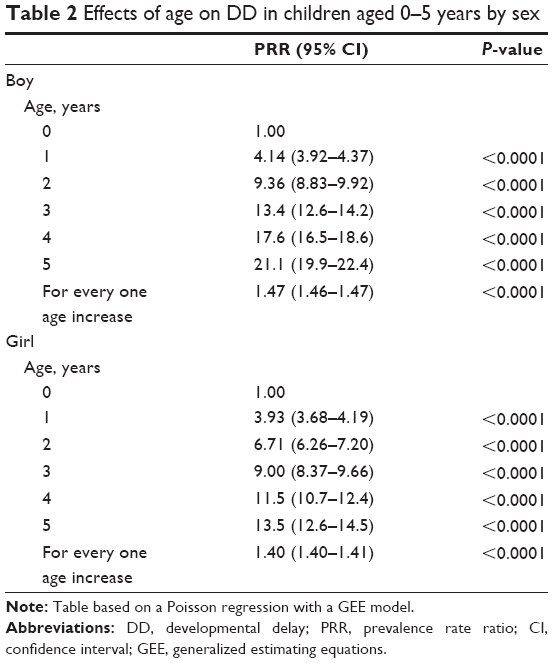 | Table 2 Effects of age on DD in children aged 0–5 years by sex |
Prevalence of different types of DD and the association between the prevalence of different types of DD and sex
The prevalence of different types of DD in children aged 0–5 years is shown in Figure 3. The highest prevalence was in social domain (1.69%), followed by the verbal domain (1.33%), unclassified domain (0.54%), cognitive domain (0.28%), and motor domain (0.17%). The prevalence of all types of DD increased with the year, except the cognitive domain. The prevalence for the cognitive domain increased before 1998 and stabilized after 1998 (P=0.31 for trend, data not shown).
 | Figure 3 Trends in the prevalence of different types of DD in children aged 0–5 years. |
The effect of different types of DD in boys compared with girls is shown in Table 3. Boys exhibited the highest risk of prevalence in the social domain (PRR =2.21, 95% CI: 2.18–2.25), followed by the verbal domain (PRR =2.17, 95% CI: 2.13–2.22), motor domain (PRR =1.91, 95% CI: 1.82–2.01), cognitive domain (PRR =1.79, 95% CI: 1.72–1.87), and unclassified domain (PRR =1.38, 95% CI: 1.34–1.43).
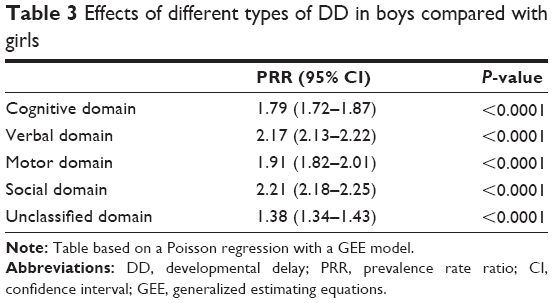 | Table 3 Effects of different types of DD in boys compared with girls |
Discussion
Prevalence and distribution of children with DD
Overall, the prevalence of DD by year gradually increased from 0.16% to 3.25% from 1997 to 2008. The increasing ratio of prevalence (20%) over the 12-year study period was higher than the 17% ratio reported in the study by Boyle et al.10 The prevalence increased each year in our study because of the increase in assessment centers at the county level (previously the national level). However, the National Health Bureau has made a change, ordering doctors working in primary health care to perform health examinations, especially developmental surveillance of children aged 2–3 years and 4–6 years, and requesting them to report results via the Internet when children with abnormal development are found. Doctors are paid Taiwan Dollar (TWD) 80 National Taiwan dollar for each report and in advance if the child is diagnosed with DD, and awarded another TWD 800 as an encouragement for the screening effort. This efficient strategy has increased the rates of eligibility for access to early intervention services and should thus encourage other early intervention professionals. The reason why the DD prevalence showed an increasing trend and did not reach a plateau in our data from one of the developmental assessment centers of more than 20 years in Taiwan could be because although the active legislation process from the “Children’s Welfare Act” (a major change since 1993 to 2003) to the “Protection of Children and Youths Welfare and Rights Act” (substantial progress between 2012 and 2014) promoted this increasing trend, our target period was between 1997 and 2002, and we followed up for 6 years (until 2008); hence, we did not reach the peak. The number of referral centers and assessment centers is increasing per year; the increasing rate (5%–10%) remains higher than the decreasing rate of birth (2%–3%). We suspect the trend reached a plateau around 2011–2013. If the data between 2003 and 2008 from the NHIRD were released, we would be able to follow up until 2014 and may be able to obtain a possible plateau result.
The results showing increasing DD prevalence by year are consistent with the data reported by Boyle et al10 from the 1997–2008 National Health Interview Surveys, although their study included a larger range sample with children aged 3–10 years. The prevalence of DD in Taiwan is lower than that in other countries, such as the 10%–13% prevalence for children aged 9–24 months reported by Rosenberg et al11 3.86% prevalence for children aged 3–10 years reported by Boyle et al10 and 3.4% prevalence for children aged 4–59 months reported by Simpson et al.12 Data on age-specific statistics for children aged 5 years showed a higher proportion (2.55%). From the age of 0 years, the prevalence increased by age (Table 1). Prevalence is an accumulation effect. Because we analyzed the time period of 1997–2002 and followed up for 6 years, the accumulation effect was increased. From this result, the prevalence was not explained by the age-related increasing trend; one possible explanation is that symptoms usually become substantial when a child grows older.
Effects of age, sex, and time period on DD
The prevalence of DD in boys is 2.13 times (2.09–2.18 for 1997–2008) that of girls; however, the ratio of boys and girls with DD in the study by Boyle et al10 was 1.78. Compared with the prevalence presented by Boyle et al10 the prevalence of DD in Taiwan was higher. In our last three studies in Taiwan (2003–2005), the male to female ratio was 2–2.3 to 1.13,14 The sex difference in different domains yielded similar results, for example, 1.3 to 1 in the motor domain such as cerebral palsy,15 1.3–1.9 to 1 in the cognitive domain such as mental retardation,16 and 4–5 to 1 in the social domain such as autistic spectrum disorder (ASD) (Centers for Disease Control and Prevention 2014). These results support the existence of sex differences.
Prevalence of different types of DD and the association between the prevalence of different types of DD and sex
The prevalence of social domain delay answers our findings that the social domain (such as ASD) has higher prevalence (1.69). The Centers for Disease Control and Prevention and their network “autism and developmental disabilities monitoring” (ADDM) among six sites (2000) to 14 sites (2010) demonstrated that the prevalence of ASD changes from 6.7 to 14.7 per 1,000 children (approximately one per 68 children) (Centers for Disease Control and Prevention 2012, 2014).17,18 The male to female ratio is 23.7 to 5.3 (per 1,000).17,18
A possible explanation for the increased diagnosis of ASD among medical professionals is an increased awareness due to the changes in the content of DSM-IV, and participation of organizations such as CDC and DDM, which have promoted case findings. Sex differences in prevalence rates can be explained by the concept of “female protective model”, which shows higher mutation burden in females protects them from the disease and explains the increased male prevalence in many neurodevelopmental disorders.19
Other discussion
The denominator for calculating prevalence in this study was 2,308,790 children aged 0–5 years born from 1997 to 2008. Rosenberg et al11 included a total of 10,200 children aged 9–24 months. The sample size in the study by Boyle et al10 was 119,367. The sample size in our study was the largest among the three studies for the prevalence of DD.
Rosenberg et al11 employed a developmental evaluation tool that included direct assessments of the children (eg, Bayley Short Form – Research Edition), caregiver interviews and questionnaires, and information from birth certificates. The various measurement methods of Rosenberg et al11 for identifying DD may have caused the high prevalence. Boyle et al10 estimated the prevalence by using a questionnaire with parent-reported diagnoses. Boyle et al10 focused on developmental disabilities, including attention deficit hyperactivity disorder/attention deficit disorder, autism, cerebral palsy, mental retardation and other DDs, seizures, stuttering or stammering, hearing loss, blindness, and learning disability. However, the survey included DD as one type of disability. The ICD codes used in our study may have resulted in a lower prevalence rate because of the difficulty in meeting the eligibility criteria of the ICD codes.
Conclusion
The prevalence of DD increased from 0.16 in 1997 to 3.25 in 2008. The prevalence of DD for each year from 1997 to 2008 was significantly different, with the prevalence increasing nearly every year. The effect of sex on the prevalence of DD was significant. The prevalence of DD in boys was higher than that in girls. Future research may focus on the difference in prevalence by socioeconomic status and region. Regarding the budgeting of DD services, strengthening the promotion of early intervention can provide a basis for resource allocation. Understanding the trend of prevalence in the study period and the gap between the rate of early treatment and DD prevalence are critical concerns for future research.
Acknowledgments
The authors would like to thank the support from China Medical University Hospital (grant number: DMR-104-031 and 1MS1); Taiwan Ministry of Health and Welfare Clinical Trial and Research Center of Excellence (MOHW104-TDU-B-212-113002); China Medical University Hospital; Academia Sinica Taiwan Biobank Stroke Biosignature Project (BM104010092); NRPB Stroke Clinical Trial Consortium (MOST 103-2325-B-039-006); Tseng-Lien Lin Foundation, Taichung, Taiwan; Taiwan Brain Disease Foundation, Taipei, Taiwan; Katsuzo and Kiyo Aoshima Memorial Funds, Japan; and the Bureau of Health Promotion, Department of Health, Taiwan (ROC) (DOH99-HP-1205).
Disclosure
No commercial party having a direct financial interest in the results of the research supporting this article has or will confer a benefit upon the authors or upon any organization with which the authors are associated. The authors report no conflicts of interest.
References
Radecki L, Sand-Loud N, O’Connor KG, Sharp S, Olson LM. Trends in the use of standardized tools for developmental screening in early childhood: 2002–2009. Pediatrics. 2011;128(1):14–19. | ||
Oberklaid F, Efron D. Developmental delay: identification and management. Aus Fam Physician. 2005;34(9):739–742. | ||
Matson JL, Sipes M. Methods of early diagnosis and tracking for autism and pervasive developmental disorder not otherwise specified (PDDNOS). J Dev Phys Disabil. 2010;22(4):343–358. | ||
Bailey DB. Case management in early intervention. J Early Interv. 1989;13(2):120–134. | ||
Guralnick MJ. Early intervention approaches to enhance the peer-related social competence of young children with developmental delays: a historical perspective. Infants Young Childr. 2010;23(2):73–83. | ||
Sandler AD, Brazdzuinas D, Cooley W, et al. Developmental surveillance and screening of infants and young children. Pediatrics. 2001;108(1):192–196. | ||
Pan YL, Hwang AW, Simeonsson RJ, Lu L, Liao HF. ICF-CY code set for infants with early delay and disabilities (EDD Code Set) for interdisciplinary assessment: a global experts survey. Disabil Rehabil. 2014;7:1–11. | ||
Zimmer MH, Panko LM. Developmental status and service use among children in the child welfare system: a national survey. Arch Pediatr Adolesc Med. 2006;160(2):183–188. | ||
Engle PL, Black MM, Behrman JR, et al. Strategies to avoid the loss of developmental potential in more than 200 million children in the developing world. Lancet. 2007;369(9557):229–242. | ||
Boyle CA, Boulet S, Schieve LA, et al. Trends in the prevalence of developmental disabilities in US children, 1997–2008. Pediatrics. 2011;127(6):1034–1042. | ||
Rosenberg SA, Zhang D, Robinson CC. Prevalence of developmental delays and participation in early intervention services for young children. Pediatrics. 2008;121(6):e1503–e1509. | ||
Simpson GA, Colpe L, Greenspan S. Measuring functional developmental delay in infants and young children: prevalence rates from the NHIS-D. Paediatr Perinat Epidemiol. 2003;17(1):68–80. | ||
Kuo HT, Tsai MY, Lien JF, Wong SH, Pan YC. Populational based cases analysis of children with developmental delays among assessment center of middle Taiwan. J Child Welf. 2003;5:37–54. Article in Chinese. | ||
Tsai JD, Kuo HT, Chou IC, Tsai MY, Tsai CH. A clinical analysis of children with developmental delay. Acta Paediatrica Taiwanica. 2005;46(4):191–195. | ||
Pharoah P, Platt MJ, Cooke T. The changing epidemiology of cerebral palsy. Arch Dis Child Fetal Neonatal Ed. 1996;75(3):F169–F173. | ||
Aicardi J. The etiology of developmental delay. Semin Pediatr Neurol. 1998;1:15–20. | ||
Centers for disease control and prevention. Prevalence of autism spectrum disorders-autism and developmental disabilities monitoring network, 14 sites, United States, 2008. Surveill Summar. 2012;61(3):1–19. | ||
Centers for disease control and prevention. Prevalence of autism spectrum disorders-autism and developmental disabilities monitoring network, 11 Sites, United States, 2010. Surveill Summary. 2014;63(2):1–24. | ||
Se´bastien J, Bradley PC, Micha H, et al. A higher mutational burden in females supports a “female protective model” in neurodevelopmental disorders. Am J Human Genet. 2014;94:415–425. |
 © 2015 The Author(s). This work is published and licensed by Dove Medical Press Limited. The
full terms of this license are available at https://www.dovepress.com/terms
and incorporate the Creative Commons Attribution
- Non Commercial (unported, 3.0) License.
By accessing the work you hereby accept the Terms. Non-commercial uses of the work are permitted
without any further permission from Dove Medical Press Limited, provided the work is properly
attributed. For permission for commercial use of this work, please see paragraphs 4.2 and 5 of our Terms.
© 2015 The Author(s). This work is published and licensed by Dove Medical Press Limited. The
full terms of this license are available at https://www.dovepress.com/terms
and incorporate the Creative Commons Attribution
- Non Commercial (unported, 3.0) License.
By accessing the work you hereby accept the Terms. Non-commercial uses of the work are permitted
without any further permission from Dove Medical Press Limited, provided the work is properly
attributed. For permission for commercial use of this work, please see paragraphs 4.2 and 5 of our Terms.