Back to Journals » International Journal of Nanomedicine » Volume 10 » Issue 1
Cell type-specific response to high intracellular loading of polyacrylic acid-coated magnetic nanoparticles
Authors Lojk J, Bregar VB, Rajh M, Mis K, Kreft ME ![]() , Pirkmajer S, Veranič P
, Pirkmajer S, Veranič P ![]() , Pavlin M
, Pavlin M ![]()
Received 20 October 2014
Accepted for publication 13 December 2014
Published 18 February 2015 Volume 2015:10(1) Pages 1449—1462
DOI https://doi.org/10.2147/IJN.S76134
Checked for plagiarism Yes
Review by Single anonymous peer review
Peer reviewer comments 5
Editor who approved publication: Dr Thomas Webster
Jasna Lojk,1 Vladimir B Bregar,1 Maruša Rajh,1 Katarina Miš,2 Mateja Erdani Kreft,3 Sergej Pirkmajer,2 Peter Veranič,3 Mojca Pavlin1
1Group for Nano and Biotechnological Applications, Faculty of Electrical Engineering, 2Institute of Pathophysiology, Faculty of Medicine, 3Institute of Cell Biology, Faculty of Medicine, University of Ljubljana, Ljubljana, Slovenia
Abstract: Magnetic nanoparticles (NPs) are a special type of NP with a ferromagnetic, electron-dense core that enables several applications such as cell tracking, hyperthermia, and magnetic separation, as well as multimodality. So far, superparamagnetic iron oxide NPs (SPIONs) are the only clinically approved type of metal oxide NPs, but cobalt ferrite NPs have properties suitable for biomedical applications as well. In this study, we analyzed the cellular responses to magnetic cobalt ferrite NPs coated with polyacrylic acid (PAA) in three cell types: Chinese Hamster Ovary (CHO), mouse melanoma (B16) cell line, and primary human myoblasts (MYO). We compared the internalization pathway, intracellular trafficking, and intracellular fate of our NPs using fluorescence and transmission electron microscopy (TEM) as well as quantified NP uptake and analyzed uptake dynamics. We determined cell viability after 24 or 96 hours’ exposure to increasing concentrations of NPs, and quantified the generation of reactive oxygen species (ROS) upon 24 and 48 hours’ exposure. Our NPs have been shown to readily enter and accumulate in cells in high quantities using the same two endocytic pathways; mostly by macropinocytosis and partially by clathrin-mediated endocytosis. The cell types differed in their uptake rate, the dynamics of intracellular trafficking, and the uptake capacity, as well as in their response to higher concentrations of internalized NPs. The observed differences in cell responses stress the importance of evaluation of NP–cell interactions on several different cell types for better prediction of possible toxic effects on different cell and tissue types in vivo.
Keywords: intracellular fate, transmission electron microscopy, uptake quantification, ROS, cell viability
Introduction
The small size of nanoparticles (NPs) enabled a new approach to the treatment of several medical conditions as well as the development of new in vivo and in vitro biotechnological applications. One of the most prominent advantages of NPs is targeted delivery; facilitated accumulation of appropriately functionalized NPs in the tissue of interest, which also reduces the side effects of the treatment,1–3 although implementation of NPs in clinical settings still faces several obstacles. Besides that, NPs have been shown to improve solubility of the attached cargo, reduce its cytotoxicity, protect it from degradation or the immune system, and can prolong its circulation half-life.4–7 The desired effects of NPs depend on specific applications, but NPs should generally be nontoxic, nonimmunogenic, biocompatible, stable, and possibly biodegradable, most of which can be achieved by careful design of NPs.2,3,8
Due to their small size, sometimes even comparable to regular endocytic cargo,9 most NPs enter the cells through the cell’s innate mechanisms of endocytosis.10 Specific regions of the plasma membrane enclose the cargo to be internalized and detach from the membrane to form an endocytic vesicle.11–13 There are several distinctive endocytic pathways, which enable tight regulation of cell uptake and secretion processes and appropriate managing of control over the internalized cargo.14,15 The employed endocytic mechanism determines the rate of uptake, intracellular fate, NP retention, and also influences the negative effects of NP presence. Internalized NPs can sterically hinder the cellular processes and cause cell stress, which manifests as lower proliferation rate,16 induction of oxidative stress,17,18 cytoskeleton disruption,19 hindered differentiation,20–23 and DNA damage.24 NPs can also cause autophagy and lysosomal dysfunctions25 and other effects, which can eventually trigger apoptosis21,26 or induce necrosis. All these effects are even more pronounced in applications, which require high intracellular loading.
The used uptake pathway and consequences of NP internalization are highly influenced by NP properties such as size,27,28 shape,27,29 and surface properties,10,30–33 as well as the physiology of the targeted cell type.34,35 The behavior of the cell in terms of size, type, and frequency of endocytosis, division rate, and level of metabolism can result in toxic effects of seemingly biocompatible NPs as well as different intracellular fate of NPs,34,36–40 which is crucial for NP applications. Determining the interactions between NPs and different cell types is thus pivotal for proper evaluation of the suitability of the designed NPs for a certain application. This knowledge is also invaluable for further design of NPs to target specific intracellular organelles.20
In this study, we analyzed the cellular responses to magnetic NPs coated with polyacrylic acid (PAA) in three cell types; Chinese Hamster Ovary (CHO) cell line, mouse melanoma (B16) cell lines, and primary human myoblasts (MYO). We compared the internalization pathway, intracellular trafficking, and intracellular fate of our NPs using fluorescence and transmission electron microscopy (TEM) as well as quantifying NP uptake and analyzing uptake dynamics. We determined cell viability after 24 or 96 hours’ exposure to increasing concentrations of NPs, and quantified the generation of reactive oxygen species (ROS) upon 24 and 48 hours’ exposure.
Materials and methods
Cell lines and cell culturing
All cells were cultured at 37°C in a humidified 5% CO2 atmosphere in the following culture media: Chinese hamster ovary cells CHO-K1 (CHO) in F-12 HAM (Sigma-Aldrich Co., St Louis, MO, USA), murine melanoma cell line B16-F1 (B16) in Dulbecco’s Modified Eagle’s Medium (Sigma-Aldrich Co.), both supplemented with 10% fetal bovine serum (FBS; Sigma-Aldrich Co.), 0.5% L-glutamine (Sigma-Aldrich Co.), 0.1% gentamicin (PAA Laboratories, Pasching, Austria), and 0.01% penicillin (PAA Laboratories), and MYO in Advanced-MEM (minimum essential medium) (Thermo Fisher Scientific, Waltham, MA, USA) supplemented with 10% FBS, 0.3% Fungizone (Thermo Fisher Scientific), and 0.15% gentamicin. Myoblast cultures were prepared from skeletal muscle tissue routinely discarded at orthopedic operations as described previously.41–43 Briefly, the skeletal muscle tissue was cleaned of visible nonmuscle tissue and then cut into small (0.5–1.0 mm) pieces. This was followed by trypsinization (0.15%; 30–45 minutes at 37°C) in Earle’s balanced salt solution, to release the satellite cells. These skeletal muscle cells were grown at 37°C in humidified 5% CO2 atmosphere, in Advanced-MEM, supplemented with 10% (volume per volume [v/v]) FBS, 0.3% (v/v) Fungizone, and 0.15% (v/v) gentamicin. To separate the myoblasts from the non-myogenic cells, primary muscle cell cultures were purified using MACS CD56 microbeads (Miltenyi Biotec, Bergisch Gladbach, Germany). To avoid overgrowth of residual nonmyogenic cells, purified muscle cells were not used beyond the fifth passage.
Experiments were carried out on cells in the exponential growth phase plated in 24-well plates, six-well plates (Corning Inc., Corning, NY, USA), or two-well Labtek chamber slides (Nunc, Waltham, MA, USA), depending on the experiment. For each experiment, myoblasts from different donors were used. The use of MYO for this study was approved by the Ethical Commission at the Ministry of Health of the Republic of Slovenia (permit No: 71/05/12).
Nanoparticle synthesis and characterization
Cobalt ferrite CoFe2O4 (Co-ferrite) NPs were prepared by the coprecipitation method44–46 and stabilized in water. After NPs were obtained, alkaline medium was removed and replaced with distilled water subsequent to magnetic decantation of NPs in order to obtain a stable dispersion (ferro fluid). NPs were coated in situ with 45% (weight per weight) water solution of PAA (sodium salt) with molecular weight of 8 kDa (Sigma-Aldrich Co.) by mixing 10 mL of ferro fluid and 10 mL of PAA water solution of equal mass concentrations at 20 mg/mL under magnetic stirring for 10 minutes at room temperature (RT).44,47 NPs were sterilized and larger agglomerates were removed by filtration (Cellulose acetate syringe filter, pore size 0.2 μm; Sartorius AG, Goettingen, Germany).
For size characterization of NPs, we used dynamic light scattering (DLS) (Malvern Zetasizer Nano ZS; Malvern Instruments, Malvern, UK) with NIBS 173° Backscatter algorithm. Zeta potential measurements were done with disposable folded capillary cells and the M3-PALS method, built in the Malvern Nanosizer Nano ZS system.
Cell viability
Propidium iodide (PI) viability assay was performed as described previously.4 Briefly, cells were grown for 24 hours in 24-well plates (seeded 2×10⁴ cells/well for CHO and B16 cell lines, and approximately 1×10⁴ cells/well for MYO cells, depending on the division rate of each donor) or for 96 hours in six-well plates (seeded 2×10⁴ cells/well for stable cell lines and approximately 3×10⁴ cells/well for MYO cells) and incubated with different concentrations of PAA-coated NPs (50, 100, 150, and 200 μg/mL) for 24 or 96 hours, respectively. After incubation, the cells were gently washed and cell nuclei were stained with 2 μg/mL Hoechst 33342 (Thermo Fisher Scientific) to obtain the total cell number and with PI (0.15 mM; Sigma-Aldrich Co.) for 5 minutes to stain dead cells.48,49 At least 20 images at 10× objective magnification were recorded for each sample using MetaMorph imaging system software (Visitron, Puchheim, Germany). Obtained fluorescent images were analyzed using ImageJ 1.47v (National Institute of Health, Bethesda, MD, USA) and stained nuclei were counted using CellCounter software.50 The number of viable cells for each sample was obtained by subtracting the number of dead cells from all the counted cells. The percentage of viable cells (% Viability) in a given sample was determined as the ratio between the number of viable cells in the sample (NS) and the number of all cells in the untreated control (N0):
% Viability =100× NS/N0 | (1) |
Fraction of dead (PI positive) cells will be referred to as cell cytotoxicity.
Fluorescence microscopy
To observe the internalized NPs with fluorescence microscopy, red fluorescent dye rhodamine B isothiocyanate (RITC; Sigma-Aldrich Co.) was electrostatically bound to NPs. NPs were mixed with RITC solution and dialyzed against distilled water for 24 hours. Control cells were incubated with a corresponding amount of the last dialysate buffer.
Cells were grown in two-well LabTek chamber slides and incubated with 100 μg/mL NPs for 1 or 24 hours. After incubation, cells were washed and observed using inverted confocal microscope Leica TCS SP5 (Leica Microsystems, Wetzlar, Germany). To colocalize internalized NPs with lysosomes, cells were incubated with 75 nM LysoTracker® Blue (Thermo Fisher Scientific) solution in the corresponding cell culture medium for 1 hour.
Transmission electron microscopy
CHO cells were grown in two-well LabTek chamber slides and incubated with 100 μg/mL NPs for 1 or 24 hours. After incubation, cells were washed and fixed with a mixture of 4% (weight per volume [w/v]) paraformaldehyde and 2% (v/v) glutaraldehyde in 0.1 M cacodylate buffer, pH 7.4, for 2 hours at RT. Post-fixation was carried out in 1% osmium tetroxide in 0.1 M cacodylate buffer for 2 hours, followed by dehydration in graded ethanol and embedding in Epon 812 resin (Electron Microscopy Sciences, Hatfield, PA, USA) as described previously.4,51,52 Ultrathin sections were counterstained with uranyl acetate and lead citrate and examined with TEM (CM100; Philips, Amsterdam, the Netherlands).
Cell size
Cell diameter was determined as described previously.53 Shortly, cells were trypsinized and several phase contrast images were taken at 20× objective magnification of the cells in suspension. Only approximately round cells were measured using ImageJ. The results are presented as means ± standard deviation of three independent experiments.
Uptake quantification
To observe internalization dynamics and quantify the uptake of NPs, NPs were labeled with fluorescent dye RITC and incubated with cells for different time periods (1, 3, 6, 12, 24, and 48 hours). Cells were washed to remove noninternalized NPs and fluorescence intensity was measured using microplate reader Tecan Infinite 200 (Tecan, Männedorf, Switzerland). Cells were than labeled with Hoechst 33342 and fluorescence intensity was measured using Tecan Infinite 200 to determine the relative cell number in each sample. Measured RITC (NP) fluorescence intensity (FLRITC) was divided by the measured Hoechst fluorescence intensity (FLHoechst) to obtain relative NP uptake per cell:
NP uptake per cell = FLRITC/FLHoechst | (2) |
The results are presented as average NP uptake per cell and standard error (N=4), normalized to the highest observed uptake, which was the uptake of MYO cells after 48 hours. MYO cells showed the highest internalization rate in all three experimental repeats.
Generation time
The mean population doubling time (MPD) and the generation time (G), describing the length of the cell cycle for a certain cell type, was calculated as:
MPD = log(end number/initial number)/log2 | (3) |
G = t/MPD | (4) |
To obtain the G for cells in the logarithmic growth phase, cells were seeded in six-well plates (Corning). Cells were trypsinized and counted 24 hours after seeding to obtain the initial cell number and again after 48 hours to obtain the end cell number. The G is expressed as mean ± standard error. In the case of MYO, cells from three donors were used.
ROS quantification
ROS levels were determined by 5-(and-6)-chloromethyl-2′,7′-dichlorodihydrofluorescein diacetate (CM-H2DCFH-DA; Molecular Probes, Thermo Fisher Scientific). Cells were incubated with increasing concentrations of NPs for 24 or 48 hours. After incubation, cells were washed and incubated with 10 μM CM-H2DCFDA at 37°C for 45 minutes. H2O2 (500 μM) was used as a positive control. Fluorescence was determined at 492 nm excitation and 527 nm emission using a microplate reader (Tecan Infinite 200). To determine the relative number of cells, cells were stained with Hoechst 33342 and fluorescence intensity was determined at 350 nm excitation and 461 nm emission using Tecan Infinite 200. Fluorescence intensity of CM-H2DCFDA was normalized to the relative number of cells determined by Hoechst 33342. The results are represented as percentage and standard error of normalized fluorescence intensity compared to the control sample.
Statistics
If not stated otherwise, results are presented as mean ± standard error. One-way analysis of variance (ANOVA) followed by Bonferroni post-hoc test was performed to test for differences among groups. Statistical analyses were carried out with GraphPad Prism (v6; GraphPad Software, Inc., La Jolla, CA, USA). Statistical significance is displayed as follows: ns – not significant (P>0.05); *P≤0.05; **P≤0.01; ***P≤0.001; ****P≤0.0001.
Results
We prepared stable, nontoxic magnetic NPs coated with PAA,4 that are suitable for biotechnological applications. In this study, we compared the interactions of our NPs with three different cell types regarding their internalization pathways, intracellular fate, uptake dynamics, and toxicity.
Nanoparticle characterization
NPs were characterized using DLS to determine the hydrodynamic diameter of the NPs and zeta potential to obtain the approximate surface charge. Both measurements were carried out on a water suspension of NPs and on NPs suspended in three different cell culture media, supplemented with 10% FBS, which were used for cell-based experiments. The hydrodynamic diameter of NPs increased from 33 nm in distilled water to 37±5 nm in all three media. Similarly, the zeta potential increased in cell culture media from approximately −50 mV in distilled water to −29±3 mV in cell culture media. The increase in the hydrodynamic radius and decrease of the absolute value of zeta potential of NPs are due to slight aggregation and adherence of ions and other medium molecules on the surface of the NPs. Saturation magnetization values were M0 =60 Am2/kg for uncoated Co-ferrite NPs and M0 =45 Am2/kg for PAA-coated Co-ferrite NPs. More detailed characterization and explanations of NP stability can be found elsewhere.4,46,54
Internalization pathways and intracellular trafficking of NPs
To determine the endocytic pathway the selected cell types use to internalize NPs, the cells were incubated with NPs for 1 hour and fixed for TEM. In all three cell types, NPs were found bound to the plasma membrane and different membrane perturbations. The perturbations had the typical morphology of two endocytic pathways; membrane ruffles characteristic of macropinocytosis (Figure 1A–C), engulfing the NPs and the surrounding fluid of the extracellular milieu, and small clathrin-coated pits (CCP) on the cell membrane (Figure 1D–F), normally employed for specific, receptor-mediated endocytosis. Moreover, NPs were found in clathrin-coated vesicles (CCV), confirming clathrin-mediated endocytosis (CME) as an internalization pathway for NPs (Figure 1G–I). NPs are most probably not internalized selectively, but as an additional cargo during the regular endocytosis. In MYO cells, we also observed numerous caveolae, flask-shaped membrane invaginations without a coat, indicating an active caveolae-mediated endocytic pathway, but no NPs were found inside the caveolae even after 48 hours of incubation with NPs (Figure 2). Additional pathways for NP internalization are thus plausible, but were not observed.
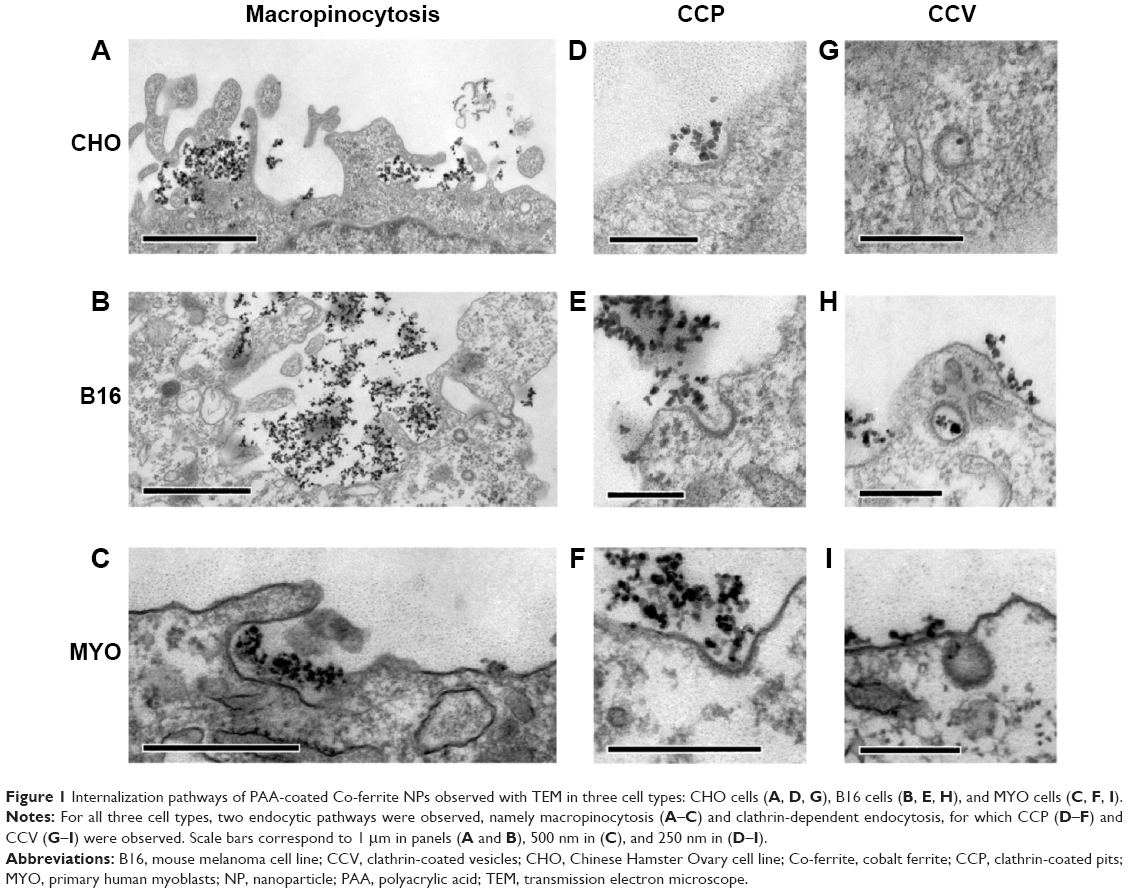 | Figure 1 Internalization pathways of PAA-coated Co-ferrite NPs observed with TEM in three cell types: CHO cells (A, D, G), B16 cells (B, E, H), and MYO cells (C, F, I). |
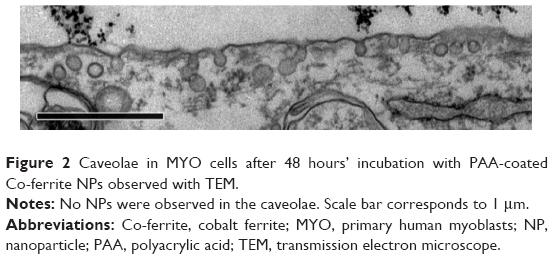 | Figure 2 Caveolae in MYO cells after 48 hours’ incubation with PAA-coated Co-ferrite NPs observed with TEM. |
Consistent with the manner of internalization, NPs were found entrapped in membrane-enclosed vesicles inside the cytosol. Immediately after endocytosis, NPs were located in early endosomes (Figure 3A–C), which matured into late endosomes (Figure 3D–F), and are characterized by intraluminal bodies. NPs were also found in amphisomes (Figure 3G–I), digestive vesicles formed by the fusion of autophagosomes and endosomes.55,56 Late endosomes and amphisomes fused with lysosomes (Figure 3J–L), where the digestion of the endocytosed cargo occurs.11 Also, some NPs internalized in B16 cells were found in the inner membranes of the two-layered vesicles that could represent autophagosomes (Figure 3H).
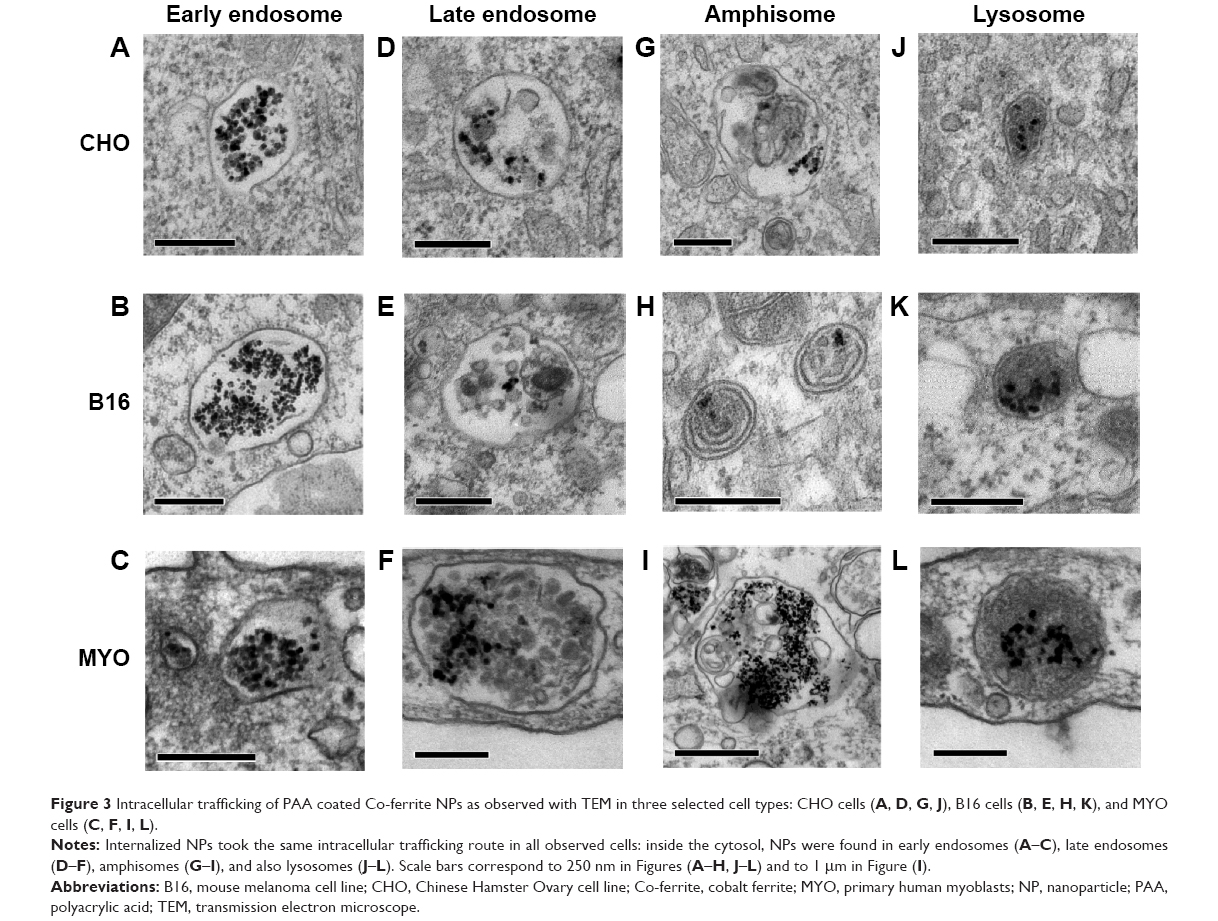 | Figure 3 Intracellular trafficking of PAA coated Co-ferrite NPs as observed with TEM in three selected cell types: CHO cells (A, D, G, J), B16 cells (B, E, H, K), and MYO cells (C, F, I, L). |
Intracellular fate of NPs
Analysis of the intracellular fate of NPs is crucial for the optimization of NPs for a given application. To determine the time dynamics and fate of NPs in different cell types, we observed the cells after 24 hours’ incubation with PAA-coated Co-ferrite NPs with TEM and fluorescence microscopy.
Fluorescence microscopy was performed on live cells after 1 and 24 hours of incubation with RITC-stained PAA NPs. LysoTracker® Blue was used to label acidic organelles. In agreement with TEM micrographs, NPs in the cytoplasm were restricted to localized spots, most likely representing vesicles containing NP aggregates (Figure 4, column B). With longer incubation time, the number of internalized NPs increased, and vesicles containing NPs increased in size and accumulated predominantly in the perinuclear region of the cell. At cell type-specific time intervals, NP fluorescence colocalized with LysoTracker® Blue (Figure 4D), confirming the presence of NPs in acidic organelles, such as late endosomes, amphisomes, and lysosomes. The majority of the NPs colocalized with acidic organelles 1 hour after incubation in CHO cells (Figure 4-1), and after 24 hours in the B16 cell line and MYO cells (Figures 4-2 and 4-3). After 24 hours, the NPs in the CHO cells were mostly no longer located in the acidic vesicles.
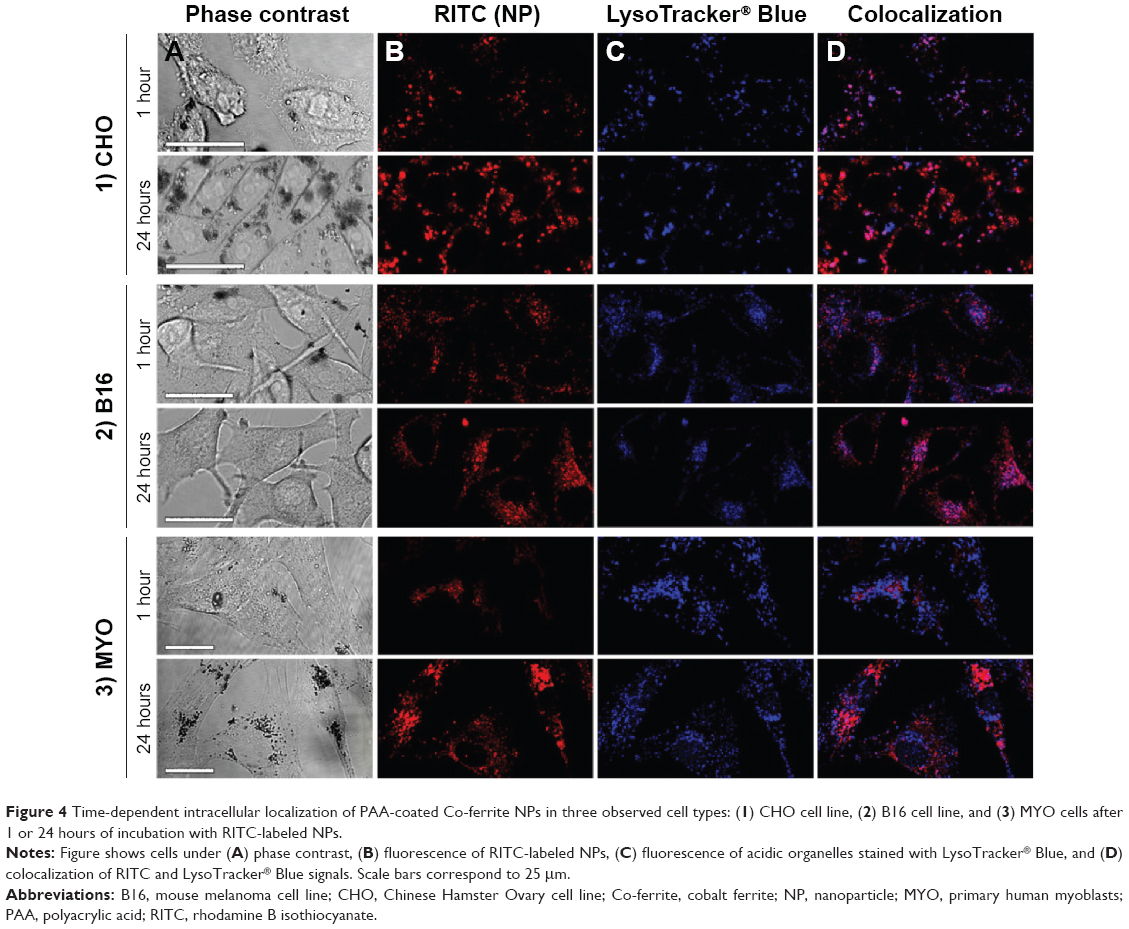 | Figure 4 Time-dependent intracellular localization of PAA-coated Co-ferrite NPs in three observed cell types: (1) CHO cell line, (2) B16 cell line, and (3) MYO cells after 1 or 24 hours of incubation with RITC-labeled NPs. |
To confirm the intracellular fate of the NPs after 24 hours’ incubation on a cellular level, all three cell lines were also analyzed with TEM. Larger quantities of NPs were found enclosed in vesicles that were mostly much larger than those observed after 1 hour of incubation. This may be due to merging of smaller vesicles from the endocytic lysosomal pathway that failed to digest their NP load, resulting in bigger storage vesicles (Figure 5). The big vesicles had an electron lucid lumen, while several smaller vesicles with NPs, most probably internalized later during the incubation, had the electron dense lumen typical of lysosomes. Consistent with the results obtained with fluorescence microscopy, the B16 cells had more small vesicles than the other two cell types and MYO cells internalized the largest quantities of NPs (Figure 4). No NPs were found in the nucleus or were associated with other intracellular organelles.
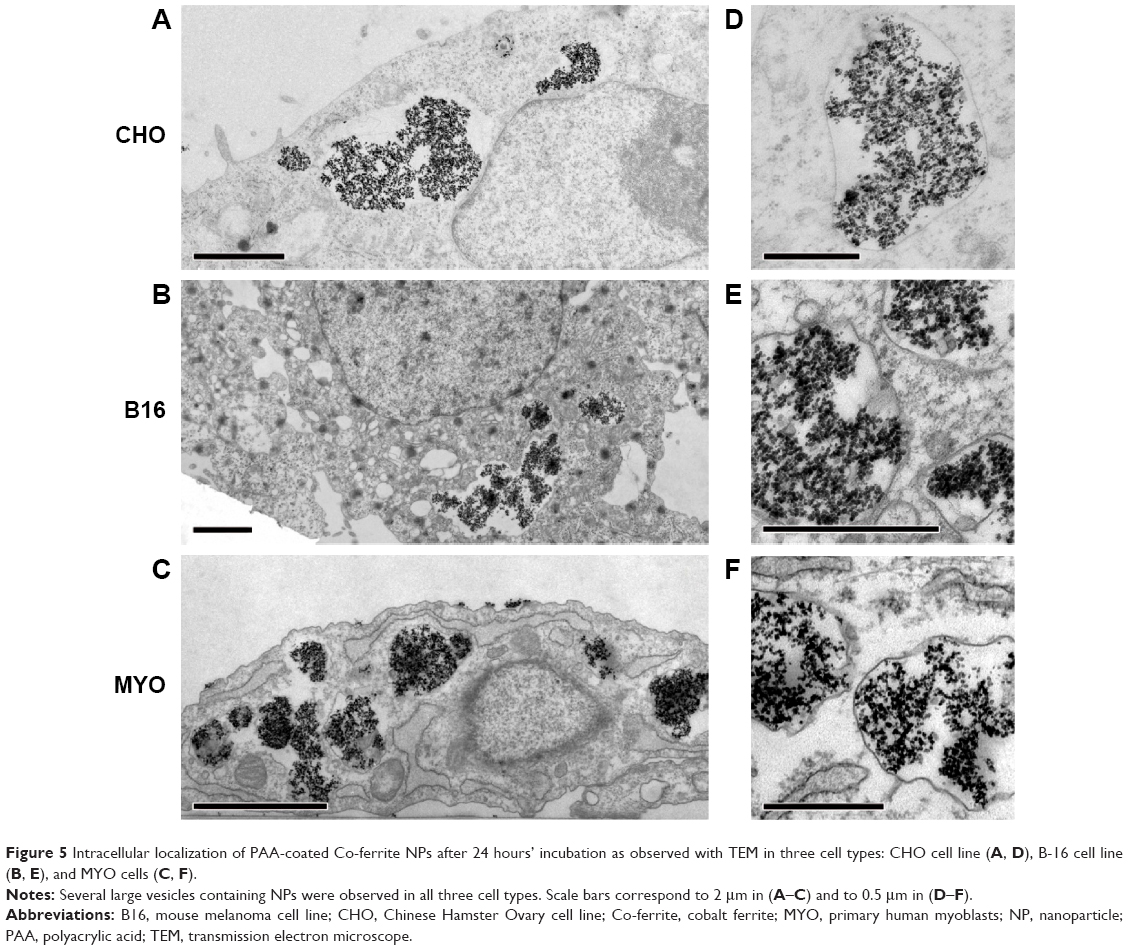 | Figure 5 Intracellular localization of PAA-coated Co-ferrite NPs after 24 hours’ incubation as observed with TEM in three cell types: CHO cell line (A, D), B-16 cell line (B, E), and MYO cells (C, F). |
Uptake quantification
To quantify the observed differences in NP uptake among the three cell types, the cells were incubated with fluorescently labeled PAA NPs for different time periods and fluorescence intensity (corresponding to NP uptake) was determined spectrofluorimetrically. All three cell types internalized NPs in a time-dependent manner, with a steady increase in intracellular NP concentration (Figure 6). CHO cells reached a plateau between 12 and 24 hours of incubation, while the intracellular concentration of NPs in B16 and MYO cells kept increasing up to 48 hours of incubation. Comparing the slopes of the uptake curves for the first 24 hours, MYO and CHO cells show higher uptake rates compared to the B16 cell line. Consistent with the quantities of intracellularly accumulated NPs after 24 hours as observed with fluorescence microscopy (Figure 4) and TEM (Figure 5), the highest NP uptake was measured in MYO cells and the lowest in B16 cells.
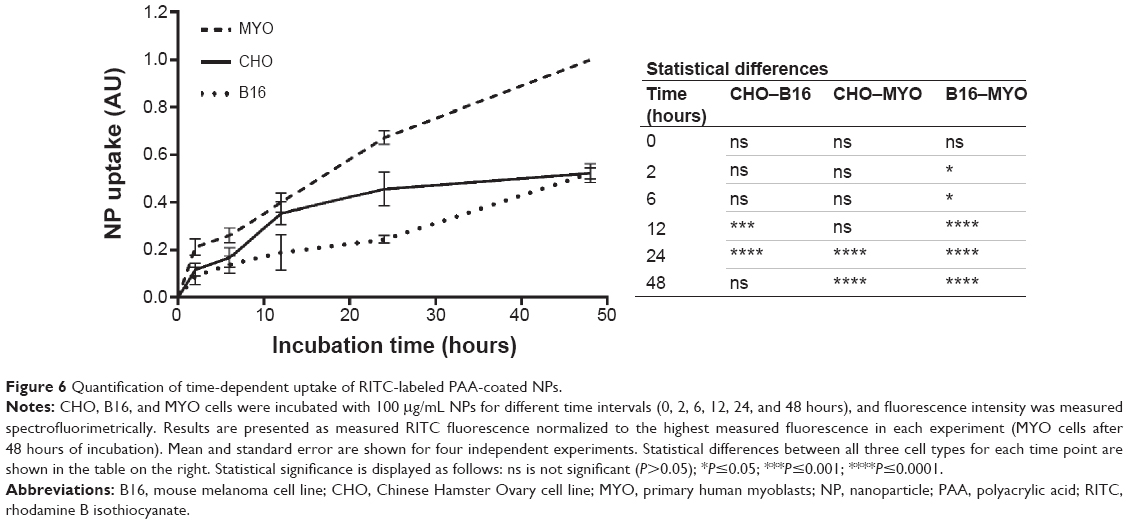 | Figure 6 Quantification of time-dependent uptake of RITC-labeled PAA-coated NPs. |
Cell viability and mechanisms of NP toxicity
To determine the effect of larger quantities of internalized PAA-coated Co-ferrite NPs on viability and proliferation, the cells were grown in the presence of increasing NP concentrations (50, 100, 150, and 200 μg/mL) for 24 hours and viability was assessed using the PI viability test. Based on these results, exposure to NPs did not reduce viability or increase cell toxicity with increasing NP concentration after 24 hours’ incubation for all three cell lines (Figure 7A).
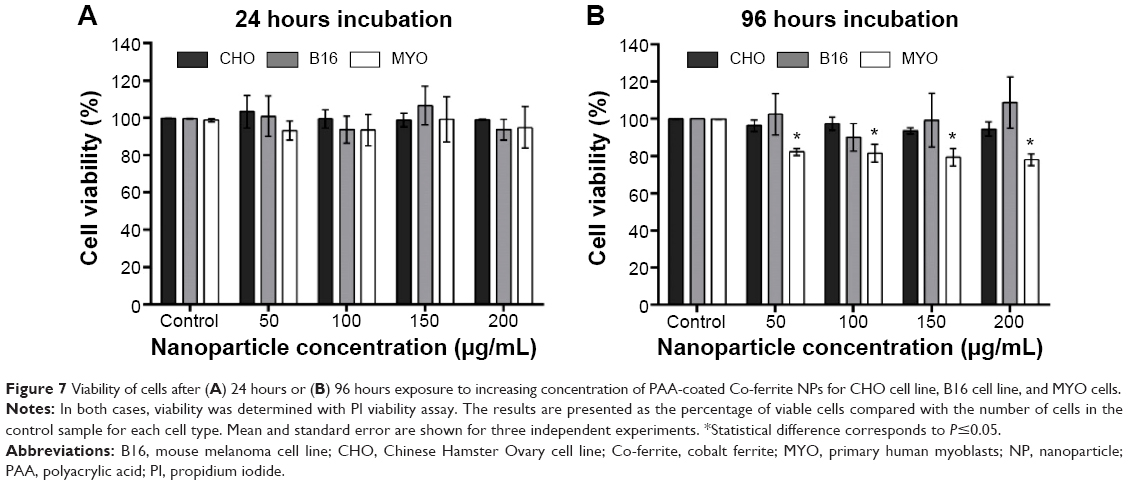 | Figure 7 Viability of cells after (A) 24 hours or (B) 96 hours exposure to increasing concentration of PAA-coated Co-ferrite NPs for CHO cell line, B16 cell line, and MYO cells. |
Due to the considerable difference in division rate between the two cell lines (CHO and B16) and primary MYO cells, being approximately 13 hours for CHO, 12 hours for B16, and 2–5 days for MYO cells (depending on the age of the donor57), we wanted to verify whether the doubling time has an effect on cytotoxicity if the incubation time is longer than one cell cycle. Cells were incubated with NPs for 96 hours to allow the majority of the MYO cells to divide. The same viability assay now enabled us to observe both the toxicity of NPs (by selective staining of dead cells with PI) and the effect of NPs on cell division rate. Based on our results, increasing the concentration of the NPs again had no effect on cell viability or proliferation rate in the CHO and B16 cell lines, since the rate of dead (PI positive) cells did not increase (results not shown) and cell viability did not decrease compared to the control. However, we observed a statistically significant decrease in viability for slowly dividing MYO cells (Figure 7B). The decrease in cell viability in MYO cells was not concentration-dependent, dropping to approximately 80% for all four used NP concentrations. Direct cell toxicity (PI-positive cells) was negligible for all NP concentrations (results not shown).
To further look into the possible mechanisms of observed NP toxicity, we observed the generation of ROS upon NP exposure. After 24 or 48 hours exposure to increasing concentrations of PAA-coated NPs, a slight increase in ROS generation was observed only in the MYO cells, but it was not statistically significant (Figure 8).
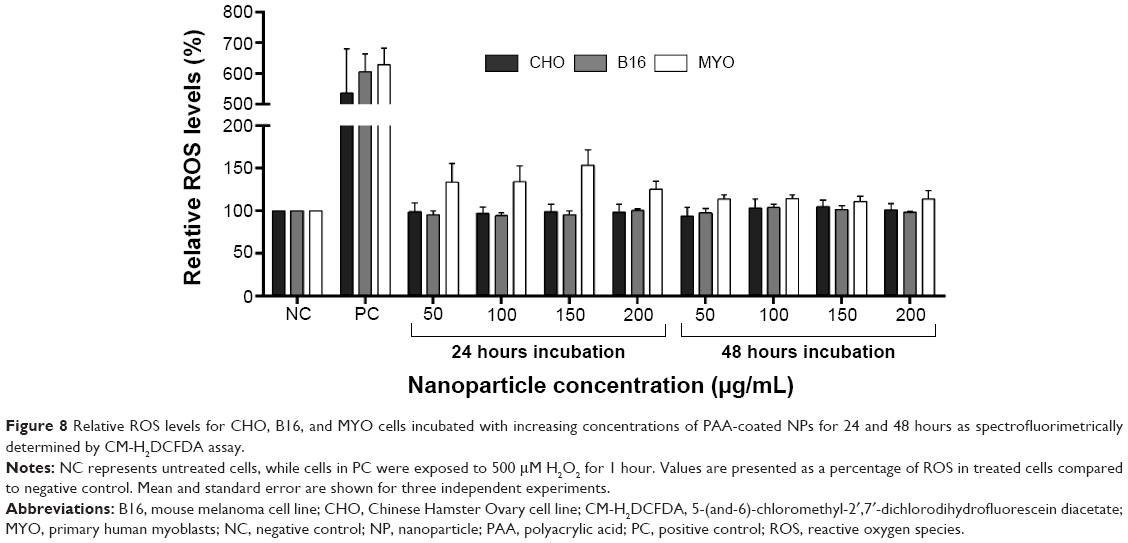 | Figure 8 Relative ROS levels for CHO, B16, and MYO cells incubated with increasing concentrations of PAA-coated NPs for 24 and 48 hours as spectrofluorimetrically determined by CM-H2DCFDA assay. |
Discussion
Magnetic NPs are a special type of NP with a ferromagnetic, electron-dense core that enables several applications. Magnetic NPs are currently used for magnetic separation, biosensors, tissue repair, drug delivery, hyperthermia treatments of tumors, and as MRI contrast agents.58 Superparamagnetic iron oxide NPs (SPIONs) are the only clinically approved type of metal oxide NPs due to their low and transient toxicity in the human body, presumably due to their nontoxic degradation products and clearance from the circulation by the endogenous iron metabolic pathways. Still, SPIONs accumulated in higher concentrations show aberrant cellular and tissue responses, including cytotoxicity.59 Similarly, Co-ferrite NPs have been researched as suitable for biomedical applications due to their excellent chemical stability, mechanical hardness, wear resistance, and ease of synthesis,60 but concerns have been expressed especially involving the presence of cobalt in the crystal structure of the Co-ferrite core.61,62 Cobalt is a microelement that we normally absorb from food and is an important component of the vitamin B12 (hydroxocobalamin); however, excessive exposure or administration can result in medical issues like pulmonary fibrosis, decreased thyroid activity, and heart problems.63–65 Recently, cobalt has been shown to interfere with the oxygen sensors in the hypoxia response pathway (through hypoxia-inducible factor) and is also believed to interact with other enzymes with sulfhydryl groups.65 However, properly prepared Co-ferrite NPs are chemically stable and the leeching of cobalt is minimal, making a prolonged retention of NPs a bigger toxicological concern.21 On the other hand, for some applications such as labeling of cells in in vivo experiments (eg, stem cells) or for cell separation, toxicity of cobalt does not present an issue. In any case, careful design, biocompatible and stable functionalization, characterization, and thorough analysis of possible cell responses to such NPs is thus essential to ensure adequate predictability and consistency of the designed application.
In our previous study, we have already shown that our PAA-coated NPs with a magnetic Co-ferrite core are nontoxic in the short-term and highly stable also in physiological conditions.4,54 The applied coating also provides relatively good stability of NPs over a broad range of pH, preventing extracellular or intracellular aggregation.54 Accordingly, NPs were shown to readily enter and accumulate in cells in high quantities.4 All these are desired properties for several biotechnological and biomedical applications. In this paper, we compared the cellular responses after cellular loading of PAA-coated NPs in three markedly different cell types with different origins and degrees of transformation: CHO fibroblast cell line as an example of a non-tumor cell line, mouse melanoma B16 cell line as a tumor cell line, and MYO as an example of a nontransformed cell type, still expressing several properties of cells in vivo and with full capacity to differentiate into functional myotubes. We compared the utilization of endocytic pathways, intracellular fate, uptake rate, cell viability, and stress-related cellular responses (ROS generation) for the three cell types.
Interestingly, all three cell types, despite their morphological and physiological differences, used the same endocytic pathways for internalization of the PAA-coated NPs, mostly macropinocytosis and in part CME66 (Figure 1).This would suggest that, in our case, the internalization pathway depends mostly on NP properties and on the properties of the protein corona formed on the NP surface in the cell culture media,67 although several other studies showed that the internalization pathway vastly depends on the cell type as well.34,68,69 Consistent with the involvement of macropinocytosis and CME, the NPs underwent the main intracellular trafficking route; from early endosomes through late endosomes to lysosomes (Figure 3), where the degradation of endocytosed cargo normally occurs.11 NPs were also observed in amphisomes (Figure 3G–I), which indicates that the presence of NPs in the endosomes does not interfere with the normal intertwining of the two intracellular digestion pathways. Autophagosomes may have formed when the cells tried to digest the lysosomes with non-degradable NPs trapped inside, or to restrict NPs that escaped from the endosomes,25 although NPs free in the cytoplasm were not observed. After 24 hours’ incubation, NP were found aggregated in larger vesicles in the perinuclear region (Figures 4 and 5), as observed also for several other NPs and cell types.70–73
Despite general similarities in NP uptake and their intracellular trafficking, there were also some differences between the three selected cell types. Morphologically, one of the main differences was the number of vesicles, their size, and number of NPs per vesicle for a given cell type. On the physiological level, differences were observed in uptake (Figure 6) and intracellular trafficking (Figure 4) dynamics. As observed with fluorescence microscopy, colocalization between fluorescently labeled NPs and LysoTracker Blue-stained acidic vesicles occurred at different time points for the three cell types. The majority of the colocalization was observed after 1 hour in CHO cells (Figure 4-1) and after 24 hours in B16 cells (Figure 4-2) and MYO cells (Figure 4-3). This shows that although the three observed cell types internalized NPs through the same endocytic pathways, the rate of intracellular trafficking is cell-type specific.
Differences were also observed in uptake rate and uptake capacity (Figure 6). All three cell lines showed time-dependent NP internalization, which varied in the uptake rate; based on the slope of the uptake curves for the first 12 hours, where internalization increased linearly for all three cell lines, MYO and CHO cells showed similar uptake rates, while a much lower uptake rate was observed for the B16 cell line. Interestingly, only CHO cells reached a plateau between 12 and 24 hours, while MYO and B16 cells showed a linear increase in intracellular NP concentration up to 48 hours. In the case of B16 cells, this might be due to the lower uptake rate, reaching the plateau only after 48 hours. MYO cells on the other hand, might have a higher loading capacity due to their considerably bigger volume (cell radii: 23.38±5.67 μm) compared to CHO (cell radii: 12.01±2.63 μm53) and B16 cells (cell radii: 15.84±2.79 μm53) and a much lower division rate. It was shown that upon cell division, the internalized NPs are randomly distributed among daughter cells, reducing the intracellular NP concentration of a single cell by half,72,74 before the internalization continues. Consequently, cell lines with a higher division rate take longer to achieve the same intracellular concentration per cell compared to slowly dividing cells, such as MYO, which can accumulate larger quantities of NPs per cell before they divide. Since based on TEM micrographs, most of the NP internalization occurs through macropinocytosis, the saturation of uptake might also occur due to the limited capacity of the cell to endocytose without membrane recycling.27,75
The high NP uptake rate and the consequent high intracellular NP concentration is most probably also the cause of cell stress (Figure 7) and the lower cell viability observed in MYO cells after 96 hours’ incubation with NPs, while there was no effect on cell viability or ROS generation for the CHO and B16 cell lines. The decline in the viability of MYO cells after 96 hours of incubation was not concentration-dependent, dropping to approximately 80% for all four used NP concentrations and the fraction of dead (PI positive) cells was negligible and did not increase compared to the control sample (results not shown). This suggests that the decline in cell viability could be attributed to cell cycle delay induced by the presence of NPs, but could also be due to detachment of damaged cells, which were thus not detected with the PI viability assay. Following Hoechst staining, we did not observe fragmented nuclei, which are typical of apoptotic cells, at any time point (results not shown).
Several types of NP-related cell stress can cause cell cycle delay, including DNA damage,76 ROS formation, damage of intracellular compartments (eg, lysosomal burst), and high intracellular concentrations of non-degradable NPs,71 which can also cause lysosomal and autophagy dysfunctions.25 We did not observe NPs free in the cytosol or cell nuclei, which makes genotoxicity or cell damage due to lysosome escape unlikely. Similarly, only a slight, not statistically significant increase in ROS formation was observed after 24 or 48 hours of exposure (Figure 8) suggesting that there were no or minor other types of cellular damage or distress, which usually result in mitochondrial damage and oxidative stress. However, the cytotoxicity of the NPs independent of ROS was also observed previously and is in agreement with our results on MYO.77,78
Based on these results, one of the most probable causes for observed diminished proliferation for MYO cells could be the interference of the high concentration of internalized NPs (Figure 5C) with cytoskeleton architecture. This was already shown for several different NPs following their high intracellular concentration.71,79,80 This may occur due to large endosomes that sterically interfere with the formation of the actin cytoskeleton and microtubule network around the nucleus or due to a reduction of focal adhesion and activation of other cytoskeleton-related signaling cascades.80,81 These effects have shown to be only transient and diminish when the intracellular NP concentration is reduced by cell division.71,80,82 Additionally, the high intracellular NP concentration might also impede transcriptional regulation and protein synthesis,71,83 since NPs are mostly accumulated in the perinuclear region.
Our study also shows the importance of evaluation of NP–cell interactions on several different cell types. Immortal and especially tumor cell lines, which are most frequently used for investigations of cytotoxic effects, can have several specific properties, such as altered metabolism or signaling pathways, which can make them less prone to certain types of NP cytotoxicity.84 In our case, only the primary cells showed a negative response (20% decrease in cell viability) to high intracellular loading of NPs. Although cells in vivo would never be exposed to such high NP concentrations as we used for our in vitro experiments, prolonged exposure and degradation of NPs may cause cell stress through other mechanisms.59
To conclude, in this study we compared the cellular responses to PAA-coated magnetic NPs for three different cell types. The presented NPs have been shown to readily enter and accumulate in cells in high quantities using the same two endocytic pathways; macropinocytosis and CME. The cell types differed in their uptake rates, the dynamics of intracellular trafficking, and the uptake capacity. MYO cells showed the highest internalization rate and also internalized the largest quantity of NPs, which was most probably the cause for the observed drop in cell viability after 96 hours, but not after 24 hours. Following NP incubation, no significant increase in ROS production was observed. The observed differences in cell responses stress the importance of evaluation of NP–cell interactions on several different cell types for better prediction of possible toxic effects on different cell and tissue types in vivo. Furthermore, high intracellular loading, as observed for our PAA-coated magnetic NPs, makes these NPs suitable for several biotechnological and biomedical applications, including cell labeling of stem or tumor cells, where high cellular loading, electron-dense core, and magnetic properties are beneficial.
Acknowledgments
The authors would like to thank Nanotesla Institute Ljubljana for their technical support in the preparation of nanoparticles, Mojca Benčina, PhD, from the National Institute of Chemistry Slovenian for her help with fluorescence microscopy, and the team from the Institute of Cell Biology, Faculty of Medicine (University of Ljubljana) for the help with transmission electron microscopy. This work was supported by Slovenian Research Agency within projects J4-4324, J2-6758, Young Researchers Program, and MRIC UL IP-0510 Infrastructure Program.
Disclosure
The authors report no conflicts of interest in this work.
References
Wang M, Thanou M. Targeting nanoparticles to cancer. Pharmacol Res. 2010;62(2):90–99. | ||
Harush-Frenkel O, Debotton N, Benita S, Altschuler Y. Targeting of nanoparticles to the clathrin-mediated endocytic pathway. Biochem Biophys Res Commun. 2007;353(1):26–32. | ||
Brannon-Peppas L, Blanchette JO. Nanoparticle and targeted systems for cancer therapy. Adv Drug Deliv Rev. 2004;56(11):1649–1659. | ||
Bregar VB, Lojk J, Suštar V, Veranič P, Pavlin M. Visualization of internalization of functionalized cobalt ferrite nanoparticles and their intracellular fate. Int J Nanomedicine. 2013;8:919–931. | ||
Sun L, Huang C, Gong T, Zhou S. A biocompatible approach to surface modification: biodegradable polymer functionalized super-paramagnetic iron oxide nanoparticles. Mater Sci Eng C. 2010;30(4):583–589. | ||
Sangeetha J, Thomas S, Arutchelvi J, Doble M, Philip J. Functionalization of iron oxide nanoparticles with biosurfactants and biocompatibility studies. J Biomed Nanotechnol. 2013;9(5):751–764. | ||
Thanh NT, Green LA. Functionalisation of nanoparticles for biomedical applications. Nano Today. 2010;5(3):213–230. | ||
Bareford LM, Swaan PW. Endocytic mechanisms for targeted drug delivery. Adv Drug Deliv Rev. 2007;59(8):748–758. | ||
Salata O. Applications of nanoparticles in biology and medicine. J Nanobiotechnology. 2004;2(1):3. | ||
Sahay G, Alakhova DY, Kabanov AV. Endocytosis of nanomedicines. J Control Release. 2010;145(3):182–195. | ||
Luzio JP, Pryor PR, Bright NA. Lysosomes: fusion and function. Nat Rev Mol Cell Biol. 2007;8(8):622–632. | ||
Maxfield FR, McGraw TE. Endocytic recycling. Nat Rev Mol Cell Biol. 2004;5(2):121–132. | ||
Pryor PR, Luzio JP. Delivery of endocytosed membrane proteins to the lysosome. Biochim Biophys Acta. 2009;1793(4):615–624. | ||
Doherty GJ, McMahon HT. Mechanisms of endocytosis. 2009;78: 857–902. | ||
Kumari S, Mg S, Mayor S. Endocytosis unplugged: multiple ways to enter the cell. Cell Res. 2010;20(3):256–275. | ||
Asharani PV, Hande MP, Valiyaveettil S. Anti-proliferative activity of silver nanoparticles. 2009;10:65. | ||
Fahmy B, Cormier SA. Copper oxide nanoparticles induce oxidative stress and cytotoxicity in airway epithelial cells. Toxicol In Vitro. 2009; 23(7):1365–1371. | ||
Manke A, Wang L, Rojanasakul Y. Mechanisms of nanoparticle-induced oxidative stress and toxicity. Biomed Res Int. 2013;2013:942916. | ||
Xu F, Piett C, Farkas S, Qazzaz M, Syed NI. Silver nanoparticles (AgNPs) cause degeneration of cytoskeleton and disrupt synaptic machinery of cultured cortical neurons. Mol Brain. 2013;6:29. | ||
Panariti A, Miserocchi G, Rivolta I. The effect of nanoparticle uptake on cellular behavior: disrupting or enabling functions? Nanotechnol Sci Appl. 2012;5:87–100. | ||
Soenen SJ, Rivera-Gil P, Montenegro JM, Parak WJ, De Smedt SC, Braeckmans K. Cellular toxicity of inorganic nanoparticles: common aspects and guidelines for improved nanotoxicity evaluation. Nano Today. 2011;6(5):446–465. | ||
Ye Y, Liu J, Chen M, Sun L, Lan M. In vitro toxicity of silica nanoparticles in myocardial cells. Environ Toxicol Pharmacol. 2010;29(2): 131–137. | ||
Oberdörster G, Oberdörster E, Oberdörster J. Nanotoxicology: an emerging discipline evolving from studies of ultrafine particles. Environ Health Perspect. 2005;113(7):823–839. | ||
Singh N, Manshian B, Jenkins GJS, et al. NanoGenotoxicology: the DNA damaging potential of engineered nanomaterials. Biomaterials. 2009;30(23–24):3891–3914. | ||
Stern ST, Adiseshaiah PP, Crist RM. Autophagy and lysosomal dysfunction as emerging mechanisms of nanomaterial toxicity. Part Fibre Toxicol. 2012;9:20. | ||
Elsaesser A, Howard CV. Toxicology of nanoparticles. Adv Drug Deliv Rev. 2012;64(2):129–137. | ||
Chithrani BD, Ghazani AA, Chan WC. Determining the size and shape dependence of gold nanoparticle uptake into mammalian cells. Nano Lett. 2006;6(4):662–668. | ||
Rejman J, Oberle V, Zuhorn IS, Hoekstra D. Size-dependent internalization of particles via the pathways of clathrin- and caveolae-mediated endocytosis. Biochem J. 2004;377(Pt 1):159–169. | ||
Huang X, Teng X, Chen D, Tang F, He J. The effect of the shape of mesoporous silica nanoparticles on cellular uptake and cell function. Biomaterials. 2010;31(3):438–448. | ||
Harush-Frenkel O, Altschuler Y, Benita S. Nanoparticle-cell interactions: drug delivery implications. Crit Rev Ther Drug Carrier Syst. 2008;25(6):485–544. | ||
Verma A, Stellacci F. Effect of surface properties on nanoparticle-cell interactions. Small. 2010;6(1):12–21. | ||
Nativo P, Prior IA, Brust M. Uptake and intracellular fate of surface-modified gold nanoparticles. ACS Nano. 2008;2(8):1639–1644. | ||
Sun X, Rossin R, Turner JL, et al. An assessment of the effects of shell cross-linked nanoparticle size, core composition, and surface PEGylation on in vivo biodistribution. Biomacromolecules. 2005;6(5): 2541–2554. | ||
Douglas KL, Piccirillo CA, Tabrizian M. Cell line-dependent internalization pathways and intracellular trafficking determine transfection efficiency of nanoparticle vectors. Eur J Pharm Biopharm. 2008;68(3):676–687. | ||
Hudoklin S, Zupančič D, Makovec D, Kreft ME, Romih R. Gold nanoparticles as physiological markers of urine internalization into urothelial cells in vivo. Int J Nanomedicine. 2013;8:3945–3953. | ||
Blechinger J, Bauer AT, Torrano AA, Gorzelanny C, Bräuchle C, Schneider SW. Uptake kinetics and nanotoxicity of silica nanoparticles are cell type dependent. Small. 2013;9(23):3970–3980, 3906. | ||
Coulter JA, Jain S, Butterworth KT, et al. Cell type-dependent uptake, localization, and cytotoxicity of 1.9 nm gold nanoparticles. Int J Nanomedicine. 2012;7:2673–2685. | ||
Ketkar-Atre A, Struys T, Soenen SJ, et al. Variability in contrast agent uptake by different but similar stem cell types. Int J Nanomedicine. 2013;8:4577–4591. | ||
Kim JA, Åberg C, Salvati A, Dawson KA. Role of cell cycle on the cellular uptake and dilution of nanoparticles in a cell population. Nat Nanotechnol. 2012;7(1):62–68. | ||
Fröhlich E, Meindl C, Roblegg E, Griesbacher A, Pieber TR. Cytotoxity of nanoparticles is influenced by size, proliferation and embryonic origin of the cells used for testing. Nanotoxicology. 2012;6(4):424–439. | ||
Askanas V, Kwan H, Alvarez RB, et al. De novo neuromuscular junction formation on human muscle fibres cultured in monolayer and innervated by foetal rat spinal cord: ultrastructural and ultrastructural – cytochemical studies. J Neurocytol. 1987;16(4):523–537. | ||
Prelovsek O, Mars T, Jevsek M, Podbregar M, Grubic Z. High dexamethasone concentration prevents stimulatory effects of TNF-alpha and LPS on IL-6 secretion from the precursors of human muscle regeneration. Am J Physiol Regul Integr Comp Physiol. 2006;291(6): R1651–R1656. | ||
Mars T, King MP, Miranda AF, Walker WF, Mis K, Grubic Z. Functional innervation of cultured human skeletal muscle proceeds by two modes with regard to agrin effects. Neuroscience. 2003;118(1):87–97. | ||
Campelj S, Makovec D, Drofenik M. Preparation and properties of water-based magnetic fluids. J Phys Condens Matter. 2008;20(20):204101. | ||
Tourinho FA, Franck R, Massart R. Aqueous ferrofluids based on manganese and cobalt ferrites. J Mater Sci. 1990;25(7):3249–3254. | ||
Bregar VB, Pavlin M, Žnidaršič A. Magnetization state in magnetic nanoparticle agglomerates. Proceedings of the Eighth International Conference on the Scientific and Clinical Applications of Magnetic Carriers. AIP Conf Proc. 2010;1311(1):59–64. | ||
Prijic S, Prosen L, Cemazar M, et al. Surface modified magnetic nanoparticles for immuno-gene therapy of murine mammary adenocarcinoma. Biomaterials. 2012;33(17):4379–4391. | ||
Jones KH, Senft JA. An improved method to determine cell viability by simultaneous staining with fluorescein diacetate-propidium iodide. J Histochem Cytochem. 1985;33(1):77–79. | ||
Edidin M. A rapid, quantitative fluorescence assay for cell damage by cytotoxic antibodies. J Immunol. 1970;104(5):1303–1306. | ||
Lojk J, Sajn L, Cibej U, Pavlin M. Automatic Cell Counter for cell viability estimation: 2014 37th International Convention on Information and Communication Technology, Electronics and Microelectronics (MIPRO); 26–30 May 2014:239–244. | ||
Kreft ME, Sterle M, Veranic P, Jezernik K. Urothelial injuries and the early wound healing response: tight junctions and urothelial cytodifferentiation. Histochem Cell Biol. 2005;123(4–5):529–539. | ||
Zupančič D, Kreft ME, Romih R. Selective binding of lectins to normal and neoplastic urothelium in rat and mouse bladder carcinogenesis models. Protoplasma. 2014;251(1):49–59. | ||
Marjanovic I, Haberl S, Miklavcic D, Kanduser M, Pavlin M. Analysis and comparison of electrical pulse parameters for gene electrotransfer of two different cell lines. J Membr Biol. 2010;236(1):97–105. | ||
Pavlin M, Bregar VB. Stability of nanoparticle suspensions in different biologically relevant media. Dig J Nanomater Bios. 2012;7(4):1389–1400. | ||
Gordon PB, Seglen PO. Prelysosomal convergence of autophagic and endocytic pathways. Biochem Biophys Res Commun. 1988;151(1):40–47. | ||
Fader CM, Colombo MI. Autophagy and multivesicular bodies: two closely related partners. Cell Death Differ. 2009;16(1):70–78. | ||
Schäfer R, Knauf U, Zweyer M, et al. Age dependence of the human skeletal muscle stem cell in forming muscle tissue. Artif Organs. 2006; 30(3):130–140. | ||
Pankhurst QA, Thanh NK, Jones SK, Dobson J. Progress in applications of magnetic nanoparticles in biomedicine. J Phys Appl Phys. 2009; 42(22):224001. | ||
Singh N, Jenkins GJ, Asadi R, Doak SH. Potential toxicity of superparamagnetic iron oxide nanoparticles (SPION). Nano Rev. 2010;1:5358. | ||
Amiri S, Shokrollahi H. The role of cobalt ferrite magnetic nanoparticles in medical science. Mater Sci Eng C. 2013;33(1):1–8. | ||
Colognato R, Bonelli A, Bonacchi D, Baldi G, Migliore L. Analysis of cobalt ferrite nanoparticles induced genotoxicity on human peripheral lymphocytes: comparison of size and organic grafting-dependent effects. Nanotoxicology. 2007;1(4):301–308. | ||
Marmorato P, Ceccone G, Gianoncelli A, et al. Cellular distribution and degradation of cobalt ferrite nanoparticles in Balb/3T3 mouse fibroblasts. Toxicol Lett. 2011;207(2):128–136. | ||
Barceloux DG, Barceloux D. Cobalt. Clin Toxicol. 1999;37(2):201–216. | ||
Lauwerys R, Lison D. Health risks associated with cobalt exposure – an overview. Sci Total Environ. 1994;150(1–3):1–6. | ||
Simonsen LO, Harbak H, Bennekou P. Cobalt metabolism and toxicology – a brief update. Sci Total Environ. 2012;432:210–215. | ||
Iversen TG, Skotland T, Sandvig K. Endocytosis and intracellular transport of nanoparticles: present knowledge and need for future studies. Nano Today. 2011;6(2):176–185. | ||
Walczyk D, Bombelli FB, Monopoli MP, Lynch I, Dawson KA. What the cell “sees” in bionanoscience. J Am Chem Soc. 2010;132(16): 5761–5768. | ||
Busch W, Bastian S, Trahorsch U, et al. Internalisation of engineered nanoparticles into mammalian cells in vitro: influence of cell type and particle properties. J Nanoparticle Res. 2010;13:293–310. | ||
Cartiera MS, Johnson KM, Rajendran V, Caplan MJ, Saltzman WM. The uptake and intracellular fate of PLGA nanoparticles in epithelial cells. Biomaterials. 2009;30(14):2790–2798. | ||
Sandin P, Fitzpatrick LW, Simpson JC, Dawson KA. High-speed imaging of Rab family small GTPases reveals rare events in nanoparticle trafficking in living cells. ACS Nano. 2012;6(2):1513–1521. | ||
Soenen SJ, Nuytten N, De Meyer SF, De Smedt SC, De Cuyper M. High intracellular iron oxide nanoparticle concentrations affect cellular cytoskeleton and focal adhesion kinase-mediated signaling. Small. 2010; 6(7):832–842. | ||
Besic Gyenge E, Darphin X, Wirth A, et al. Uptake and fate of surface modified silica nanoparticles in head and neck squamous cell carcinoma. J Nanobiotechnology. 2011;9:32. | ||
Kocbek P, Teskac K, Kreft ME, Kristl J. Toxicological aspects of long-term treatment of keratinocytes with ZnO and TiO2 nanoparticles. Small. 2010;6(17):1908–1917. | ||
Summers HD, Rees P, Holton MD, et al. Statistical analysis of nanoparticle dosing in a dynamic cellular system. Nat Nanotechnol. 2011; 6(3):170–174. | ||
Panyam J, Labhasetwar V. Dynamics of endocytosis and exocytosis of poly(D,L-lactide-co-glycolide) nanoparticles in vascular smooth muscle cells. Pharm Res. 2003;20(2):212–220. | ||
Duan J, Yu Y, Li Y, et al. Toxic effect of silica nanoparticles on endothelial cells through DNA damage response via Chk1-dependent G2/M checkpoint. PLoS One. 2013;8(4):e62087. | ||
Horev-Azaria L, Baldi G, Beno D, et al. Predictive toxicology of cobalt ferrite nanoparticles: comparative in-vitro study of different cellular models using methods of knowledge discovery from data. Part Fibre Toxicol. 2013;10:32. | ||
Farkas J, Christian P, Urrea JA, et al. Effects of silver and gold nanoparticles on rainbow trout (Oncorhynchus mykiss) hepatocytes. Aquat Toxicol. 2010;96(1):44–52. | ||
Berry CC, Wells S, Charles S, Aitchison G, Curtis AS. Cell response to dextran-derivatised iron oxide nanoparticles post internalisation. Biomaterials. 2004;25(23):5405–5413. | ||
Soenen SJ, Himmelreich U, Nuytten N, De Cuyper M. Cytotoxic effects of iron oxide nanoparticles and implications for safety in cell labelling. Biomaterials. 2011;32(1):195–205. | ||
Soenen SJ, Illyes E, Vercauteren D, et al. The role of nanoparticle concentration-dependent induction of cellular stress in the internalization of non-toxic cationic magnetoliposomes. Biomaterials. 2009;30(36):6803–6813. | ||
Hu F, Neoh KG, Cen L, Kang ET. Cellular response to magnetic nanoparticles “PEGylated” via surface-initiated atom transfer radical polymerization. Biomacromolecules. 2006;7(3):809–816. | ||
Pisanic TR 2nd, Blackwell JD, Shubayev VI, Fiñones RR, Jin S. Nanotoxicity of iron oxide nanoparticle internalization in growing neurons. Biomaterials. 2007;28(16):2572–2581. | ||
Soenen SJ, De Cuyper M. Assessing iron oxide nanoparticle toxicity in vitro: current status and future prospects. Nanomedicine (Lond). 2010;5(8):1261–1275. |
 © 2015 The Author(s). This work is published and licensed by Dove Medical Press Limited. The
full terms of this license are available at https://www.dovepress.com/terms
and incorporate the Creative Commons Attribution
- Non Commercial (unported, 3.0) License.
By accessing the work you hereby accept the Terms. Non-commercial uses of the work are permitted
without any further permission from Dove Medical Press Limited, provided the work is properly
attributed. For permission for commercial use of this work, please see paragraphs 4.2 and 5 of our Terms.
© 2015 The Author(s). This work is published and licensed by Dove Medical Press Limited. The
full terms of this license are available at https://www.dovepress.com/terms
and incorporate the Creative Commons Attribution
- Non Commercial (unported, 3.0) License.
By accessing the work you hereby accept the Terms. Non-commercial uses of the work are permitted
without any further permission from Dove Medical Press Limited, provided the work is properly
attributed. For permission for commercial use of this work, please see paragraphs 4.2 and 5 of our Terms.