Back to Journals » Journal of Inflammation Research » Volume 18
Cell Death-Related Genesets Activity Improved Clinical Concordance and Intrinsically Associated with Alterations in Ulcerative Colitis: Mucosal Healing at Molecular Depth
Authors Li Y, Xie Y ![]() , Cao K, Zhai J, Luo S, Liu X, Pan Q, Chen Y
, Cao K, Zhai J, Luo S, Liu X, Pan Q, Chen Y ![]()
Received 26 January 2025
Accepted for publication 23 June 2025
Published 19 July 2025 Volume 2025:18 Pages 9587—9608
DOI https://doi.org/10.2147/JIR.S519566
Checked for plagiarism Yes
Review by Single anonymous peer review
Peer reviewer comments 2
Editor who approved publication: Prof. Dr. Dharmappa Krishnappa
Yingjie Li,1,* Yang Xie,1,* Kejing Cao,1 Jinyang Zhai,1 Shangjian Luo,1 Xiaoman Liu,1 Qin Pan,1,2 Yingwei Chen1,2
1Department of Gastroenterology, Xinhua Hospital, School of Medicine, Shanghai Jiao Tong University, Shanghai, 200092, People’s Republic of China; 2Shanghai Institute of Pediatric Research, Shanghai Key Laboratory of Pediatric Gastroenterology and Nutrition, Xin Hua Hospital, Shanghai Jiao Tong University, School of Medicine, Shanghai, 200092, People’s Republic of China
*These authors contributed equally to this work
Correspondence: Qin Pan; Yingwei Chen, Email [email protected]; [email protected]
Purpose: Ulcerative colitis (UC) is a chronic inflammatory bowel disease with a relapsing-and-remitting cycle. Mucosal healing is a critical predictor of long-term outcomes; however, the discordance between mucosal healing at different depths and clinical activity complicates UC management.
Patients and Methods: Cell death-related genesets (CDRGs) were analyzed in UC patients, with grouping using unsupervised hierarchical clustering. Concordance between grouping methods was assessed using Cohen’s Kappa and Sankey plots. The predictive value was quantified using the area under the curve. Subgroup analysis explored the additive effects and intrinsic associations between the CDRG-based grouping and other grouping methods. Differentially expressed genes (DEGs) were identified using Wilcoxon test. Robustness was validated in 3 independent cohorts. Single-cell analysis was used to assess cell type-specific impacts. Cytokine expression in colon organoids was measured using RT-qPCR.
Results: CDRGs’ activities effectively predicted the clinical, histological, and endoscopic grouping. CDRG-based grouping emerged as an independent predictor, resolving inconsistence between histological and clinical grouping and improving concordance across clinical, histological, and endoscopic grouping. Integrating endoscopic or histological grouping with CDRG-based grouping improved the predictive value for clinical activity. CDRGs were intrinsically associated with DEGs, impacted non-immune cells, and reshaped immune cell infiltration through intercellular interactions. Epithelial cells were the main target of active CDRGs, exhibiting upregulated MIF, MDK, and LGALS9 in UC. In necroptotic colon organoids, MIF and MDK were significantly upregulated, whereas LGALS9 remained unchanged.
Conclusion: CDRG-based grouping served as an independent predictor to improve the concordance between clinical, histological, and endoscopic grouping in UC, and was of potency to precisely identify UC patients achieving long-term treatment target, namely mucosal healing. Active CDRGs intrinsically associated with genetic and immunological alterations in UC, highlighting their potential as novel biomarkers and therapeutic targets.
Keywords: ulcerative colitis, mucosal healing, cell death, prediction, biomarker, single cell
Introduction
Ulcerative colitis (UC) is a chronic, immune-mediated, non-specific inflammatory bowel disease mainly affecting the mucosal layer of colon and rectum. Approximately 5 million patients experience a relapsing-and-remitting cycle with bloody diarrhea and fecal urgency during disease activation. Long-term remission has taken the first priority in patient management, beyond disease control. The long-term outcomes of patients with UC were dominated by the depth of remission, from endoscopic to histological and transmural mucosal healing. Although the results from the ERIca Trial showed the best predictive performance of transmural healing in disease progression compared with endoscopic mucosal healing (EMH) and histological mucosal healing (HMH), high-cost equipment, endocytoscopy, and confocal laser endomicroscopy limited its clinical application.1 EMH was associated with the relative lower risks of long-term adverse outcomes, such as relapse, colectomy, and cancer.2–5 The Mayo Clinic endoscopy subscore (MES) 0, with a lower risk of relapse than MES 1, was recommended for the diagnosis of EMH.6 However, histological activity was observed in approximately 30% of patients with EMH, and increased clinical activity, promoted relapse and led to therapy escalation, whereas HMH further reduced the risk of relapse in patients with EMH.7–10 The Nancy index determined by 3 histological parameters underwent the most validation among 30 histological scoring systems and defined HMH as Nancy 0–1.11,12 However, discordance was observed between the clinic, endoscopy, and histology and remains to be addressed for better clinical assessment of mucosal healing in UC.13,14
Epithelial damage of colorectal mucosa was an important parameter in both the endoscopic and histological scoring systems. MES graded the endoscopic activity of UC from mild to severe using friability, erosions, and ulceration of the mucosa, and ulceration indicated the highest grade of the Nancy index. Multiple cell death processes contribute to epithelial damage, including ferroptosis, necroptosis, and pyroptosis. Ferroptosis was induced in both patients and experimental mouse models of UC by ER stress, mediated H2O2-induced death of epithelial cells, and restrained by the inhibition of ER stress by p65 activation and under the reactivation of STAT3 in ferrostatin-1 treatment.15,16 P2Y14R promoted necroptosis of epithelial cells by regulating the cAMP/PKA/CREB pathway and the subsequent transcriptional activation of RIPK1. The inhibition of P2Y14R protected epithelial cells from necroptosis in vivo and in vitro from necroptosis.17 GSDME, an effector of pyroptosis, was associated with mucosal inflammation and intestinal barrier damage in patients with UC. The synthetic material, 4-OI/BLipo, targeted pyroptosis by delivering an inhibitor to epithelial cells, and restored intestinal barrier function.18 The capture of cell death in the colorectal mucosa was of importance for the clinical assessment of patients with UC using endoscopy or histology. However, friability, erosions, and ulceration of the mucosa commonly reflected ongoing cell death, and neglected cell death activation at the initial stage of disease activation and cell death inactivation at the start of disease remission. The precise identification of the cell death status might assist in clinical management and improve the concordance between different depths of mucosal healing in UC.
In this study, we explored the transcriptional landscape of cell death in the colorectal mucosa and identified active cell death-related genesets (CDRGs) that defined clinical activity in UC. CDRG-based grouping emerged as an independent predictor, accurately distinguishing between different clinical and histological groups, and improved concordance across clinical, endoscopic, and histological groupings. Beyond clinical grouping, we uncovered the intrinsic association between CDRGs and altered gene-expression patterns (GEPs), revealing cell-type heterogeneity through single-cell analysis. Non-immune cells with the intrinsic association reshaped immune infiltration by intercellular interactions, with epithelial cells identified as the main target of active CDRGs and key sources of cytokine release during cell death. Experimental validation in colon organoids confirmed the upregulation of macrophage migration inhibitory factor (MIF) and midkine (MDK) under induced necroptosis. These findings advanced our understanding of mucosal healing at the transcriptional level and proposed CDRG-based grouping as a potential parameter for developing novel clinical indices. Furthermore, the identification of 3 representative CDRGs suggests that simultaneous targeting of ferroptosis, necroptosis, and pyroptosis could pave the way for novel therapeutic strategies in ulcerative colitis.
Material and Methods
Data Processing
RNA-sequencing (RNA-seq) data of patients with UC were extracted from the Gene Expression Omnibus (GEO) repository using the accession numbers GSE193677, GSE108746, GSE128682, and GSE243625. Among the UC patients in the 4 datasets, 380 clinical inactive and 309 clinical active samples were included in this study. The count data of RNA-seq was transformed into transcripts per million (TPM) using genome annotation from GRCh38 release-107 (https://ftp.ensembl.org/pub/release-107/gtf/homo_sapiens/). Microarray data of patients with UC were prepared from GEO repository using the accession numbers GSE59071, GSE66407, GSE107499, and GSE206171, with 177 clinical inactive and 292 clinical active samples included. Single-cell RNA sequencing (scRNA-seq) data of patients with UC were obtained from the GEO repository using accession number GSE231993, including 4 clinical inactive and 3 clinical active samples (Table 1).
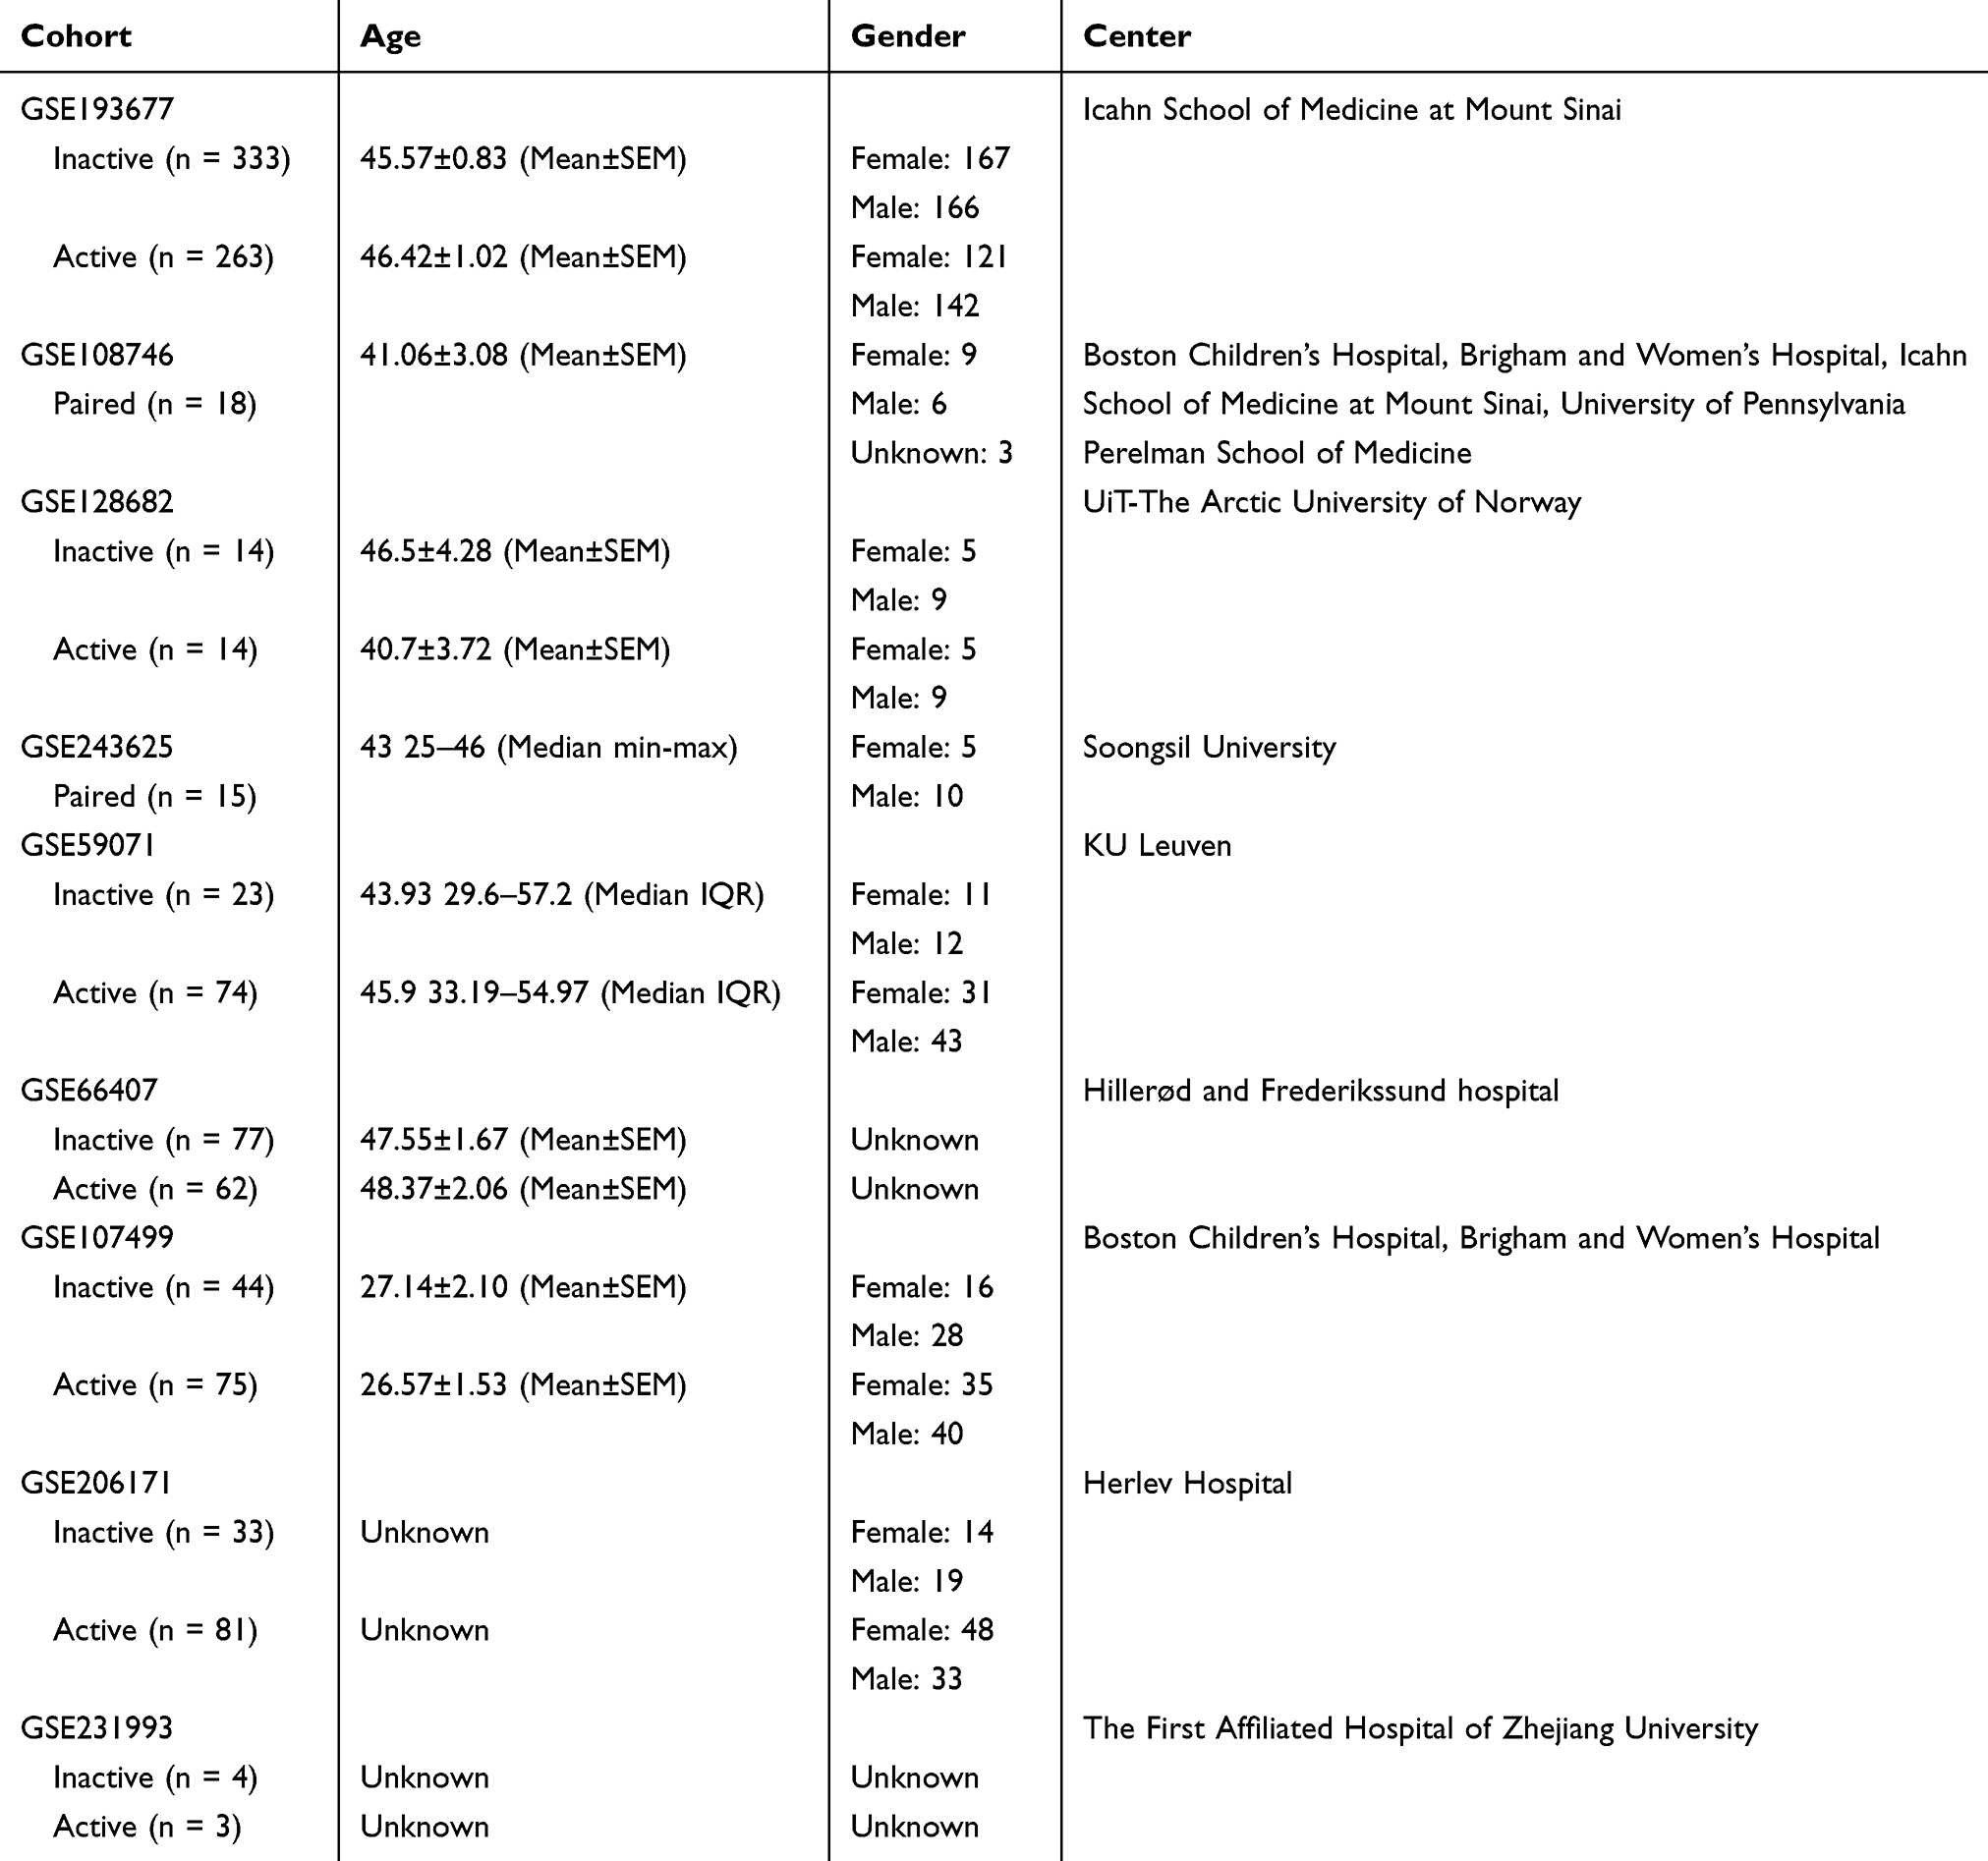 |
Table 1 The Overview of Cohorts Used in This Study |
Cell Death-Related Genesets Curating
The widely investigated processes of cell death were considered in this study, comprising apoptosis, necroptosis, reactive oxygen species (ROS) related cell death, pyroptosis, and ferroptosis. The genesets were captured from the Kyoto Encyclopedia of Genes and Genomes (KEGG, https://www.kegg.jp/kegg/pathway),19 Gene Ontology (GO, https://geneontology.org),20 and Reactome (https://reactome.org),21 with the accession number GO:2001234 for apoptosis; hsa04217 for necroptosis; GO:0036473, GO:0034614, and GO:0072593 for ROS-related cell death; and GO:0070269, hsa04621, R-HSA-5620971 for pyroptosis. Genesets from the different databases were combined. The genesets of ferroptosis were captured from the intersection of FerrDb V2 (http://www.zhounan.org/ferrdb/current/)22 and GeneCards (https://www.genecards.org/Search/Keyword?queryString=Ferroptosis).23 All the genesets were further split into the “driver” genesets that inducing cell death and the “suppressor” genesets that inhibiting cell death, according to the roles of genes annotated in the pathway maps of original databases, with an exception of ROS related cell death. As the ROS production was active under physiological status and might not lead to cell death, the genes involved in the cell death in response to ROS were recorded and thus were not called as “driver”. Both of antioxidants and metabolisms of ROS inhibited ROS related cell death were not called as “suppressor” either. The conflicting gene annotations were reviewed and annotated according to the most rigorous original research.
Single-Sample Gene Set Enrichment Analysis
Single-sample gene set enrichment (ssGSEA) analysis was performed to independently assess the activity of genesets in each sample using the GSVA v1.48.3 R package.24,25
Identification of Differentially Expressed Genes
Differences in gene expression were investigated using the Wilcoxon test, with P value adjusted by the false discovery rate (FDR) method and the fold change of mean expression levels.26 Differentially expressed genes (DEGs) were identified by FDR < 0.05, and the absolute log2 fold change no less than 0.5.
Weighted Gene Co-Expression Network Analysis
Weighted gene co-expression network analysis (WGCNA) was performed to detect co-expression of DEGs, namely modules, according to the tutorial of the WGCNA R package.27 The expression levels of DEGs were subjected to log2 transformation based on the sum of TPM and 0.001. Based on the transformed expressions, the distance matrix was created using “dist” function and subjected to the unsupervised hierarchical clustering using “hclust” function. Outliers of samples with a height of >182 were removed. The gene co-expression modules (GCMs) were detected using “blockwiseModules” function with the soft power of 9 that determined by “pickSoftThreshold.” Simultaneously, a topological value matrix of GCMs was created to represent their co-expression. The intrinsic confidence of GCMs was evaluated by the correlations between gene significance (the absolute correlation between DEGs and clinical grouping) and module membership (the absolute correlation between DEGs and the topological value of GCMs), and GCMs with P value < 0.05 were subjected to further analysis.
Single-Cell RNA Sequencing Analysis
Quality Control
Count data were used to create the Seurat object using Seurat v4.3.0.1 R package. The percents of mitochondrial genes were evaluated using “PercentageFeatureSet” function. The lower limit of the gene number, namely “nFeatures” and the upper limit of the mitochondrial gene percentage were determined by 3-fold median absolute deviation (MAD).28 The mitochondrial, ribosomal, and hemoglobin genes were excluded from further analyses. Samples with less than 1,000 cells were excluded from the analysis.
Multiplets Removal
After quality control, the count data was normalized using “NormalizeData” function, followed by the detection of 2,000 most variable genes using “FindVariableFeatures” function. The cell cycle of cells was determined using “CellCycleScoring” function based on the cell-cycle genesets in Seurat and was regressed out by “ScaleData” function. The principal components (PCs) of 2,000 genes were created using “RunPCA” function, and the number of PCs that used in the next was determined by “ElbowPlot” function. After “FindNeighbors” function and “FindClusters” function with resolution in 2, the cell clusters were created, annotated with CellMarker 2.0 (http://bio-bigdata.hrbmu.edu.cn/CellMarker/index), and combined into classical cell types.29 Multiplets were identified using DoubletFinder v2.0.4 R package.30 The “pK” parameter was determined using “paramSweep”, “summarizeSweep”, “find.pK” functions sequentially. The expected rate of multiplets was referred to the illustration of 10X genomics (https://kb.10xgenomics.com/hc/en-us/articles/360054599512-What-is-the-cell-multiplet-rate-when-using-the-3-CellPlex-Kit-for-Cell-Multiplexing). The “modelHomotypic” function was used to ignore the multiplets derived from the same cell types. Finally, the multiplets were identified using “doubletFinder” function and were excluded.
Integration
The Seurat object of each sample was combined using “merge” function and subjected to the process mentioned in Multiplets removal. The batch effects among samples were corrected using “RunHarmony” function of harmony v1.2.0 R package, and the reduction of harmony instead of PCs was used in the next cell clustering.31
Geneset Activity Evaluation
The activity of input genesets was evaluated using “AUCell_run” function of AUCell v1.24.0 R package.32
Cell-Cell Communication Analysis
The CellChat v1.6.1 R package was used to investigate the intercellular interactions.33 The CellChat object was created using cells grouped according to cell type. After the human database of CellChat assigned, the intercellular interactions were identified using “identifyOverExpressedGenes” and “identifyOverExpressedInteractions” functions, while the probability of interactions was estimated using “computeCommunProb” function.
Cell Fraction Deconvolution Analysis
The CIBERSORTx algorithm was used to perform deconvolution according to the tutorial (https://cibersortx.stanford.edu/).34 The cell-gene expression matrix was outputted from scRNA-seq and subjected to the creation of a signature matrix in CIBERSORTx. The expression matrix of RNA-seq was subjected to impute cell fractions with “S mode” of batch correction and the created signature matrix.
Colon Organoids Culture
Colonic organoids were extracted from 12-week male C57BL/6 mice. After sacrifice using carbon dioxide asphyxiation, colon tissue was extracted, cut, and rinsed with 4°C DPBS for 3 times. The mucous layer was swabbed using DPBS-wetting swabs for 9 times and rinsed with 4°C DPBS after every 3 swabs. The colon tissue was then transferred into super clean bench, rinsed with 4°C DPBS for another 20 times, and cut into pieces. The pieces of colon tissue were incubated with 0.05% collagenase type IV (WBC-LS004210, Worthington Biochemical, NJ, USA), 15 U/mL DNase I (WBC-LS006353, Worthington Biochemical), and 1mM calcium chloride diluted in DMEM/F12 (11320033, Thermo Fisher Scientific, MA, USA) medium at 37°C for 15 minutes. The mixture was mixed with 4°C DPBS to terminate collagenase digestion, ground, and sieved using a 70μm strainer. Crypts were harvested by centrifuging at 300G for 5 minutes, resuspended in Matrigel (356231, Corning, NY, USA), and seeded in 24-well plates (3524, Corning) at 37°C for 15 minutes. The organoids were cultured and differentiated using Mouse Colonic Organoid Kit (K2204-MC, BioGenous, Jiangsu, China). Differentiated organoids were incubated with 2μM Erastin (12h; HY-15763, MCE, Shanghai, China), 20ng/mL TNF-α/100nM SM164/20μM Z-VAD-FMK (TSZ, 12h; HY-P7090, HY-15989, HY-16658B, MCE), 1μg/mL LPS (12h; L2880, Merck, Darmstadt, Germany)/5mM ATP (2h; HY-B2176, MCE), respectively. Animal experiments were conducted in accordance with the Guide for the Care and Use of Laboratory Animals (1996) with the approval of the ethical committee of Xinhua Hospital.
LDH Activity Assay
The medium of organoids was centrifuged at 200G for 5 minutes to collect the supernatant. The working solution was prepared with 2μL INT buffer, 3μL enzyme buffer, 20μL substrate buffer, and 55μL reaction buffer per sample using the LDH Activity Assay Kit (G1610, Servicebio, Wuhan, China). 80μL supernatant of each sample was mixed with 80μL working solution and incubated at 37°C for 30 minutes. The mixture was then subjected to OD analysis at 490 nm and 650 nm using a microplate spectrophotometer (Epoch, Agilent, Santa Clara, CA, USA).
RT-qPCR
The organoids were analysed using RNAiso Plus (9109, Takara Bio, Shiga, Japan) to extract total RNA and subjected to reverse transcription for complementary DNA using the PrimeScript™ RT Reagent Kit (RR036, Takara Bio). Quantitative PCR was performed using Hieff UNICON® qPCR SYBR® Green Master Mix (Low Rox) (11199ES, Yeasen Biotechnology, Shanghai, China) on QuantStudio 3 (Thermo Fisher Scientific) with three replicates. Relative expression levels were normalized to the actin beta (Actb) housekeeping gene using the 2-ΔΔct method. Primers used in the experiments are listed in Table S1.
Statistical Analysis
The numerical variables in this study were presented as median and upper/lower quartiles and limits in the violin plot. The consistence between 2 groups was analyzed using Cohen’s Kappa and the binomial test for the hypothesis that accuracy rate was higher than non-information rate, with P value adjusted by FDR in multiple comparisons. The difference between 2 groups was analyzed using Wilcoxon test on the activity of genesets, the TPM data of RNA-seq, the count data of scRNA-seq, and the cell fractions from deconvolution. Correlation analyses were performed using Spearman correlation. SPSS version 23.0 (SPSS Inc., Chicago, IL, USA) was used for statistical analyses. The two-sided significance threshold was set at P < 0.05.
Results
Active Cell Death-Related Genesets Characterized Inflammatory Colon Mucosa and Was an Independent Predictor of Clinical Grouping in Ulcerative Colitis
Low Cohen’s Kappa values revealed discordance between the clinical (Simple Clinical Colitis Activity Index, SCCAI, n = 596), endoscopic (MES, n = 593), and histological (Nancy index, n = 255) groupings in UC (histological-clinical: Cohen’s Kappa = 0.379, P < 0.001, AUC = 0.70; endoscopic-clinical: Cohen’s Kappa = 0.377, P < 0.001, AUC = 0.70; endoscopic-histological: Cohen’s Kappa = 0.179, P = 1.000, AUC = 0.62; Table S2A–C and Figure S1). To explore role of CDRGs in UC grouping, ssGSEA was used to estimate their activity. Among the 15 CDRGs, 13 were active in clinical active samples, especially pyroptosis_driver, necroptosis_driver, and ferroptosis_driver, whereas ferroptosis_suppressor was inactive (13 active CDRGs: FDR < 0.001; ferroptosis_suppressor: FDR < 0.01; Figure 1A). About 12 CDRGs were highly correlated (Spearman correlation: r ≥ 0.3, P < 0.001) and accurately predicted (AUC ≥ 0.7) clinical and histological groupings but not endoscopic grouping. In contrast, pyroptosis_suppressor, necroptosis_suppressor, and ferroptosis_suppressor showed lower correlations and predictive values for clinical grouping (Figure 1B and S2A–D). Thus, active ferroptosis_driver, necroptosis_driver, and pyroptosis_driver with inactive suppressors, indicate the processes of ferroptosis, necroptosis, and pyroptosis underlying UC activation.
 |
Figure 1 Active cell death related genesets characterized and independently predicted the clinical grouping. (A) Median, upper/lower quartiles, and upper/lower limits of the CDRGs’ activities created using ssGSEA were showed in violin plot (B) Correlations between CDRGs, clinical grouping, endoscopic grouping, and histological grouping. (C) Unsupervised hierarchical clustering based on CDRGs with the heatmap of activity normalized by Z-score. (D) Concordance between the CDRG-based clustering, clinical grouping, endoscopic grouping, and histological grouping. (E) Distribution of samples grouped by clinic and CDRG-based clustering in PCA based on CDRGs. (F) Predictive values of CDRG-based clustering to clinical grouping, endoscopic grouping, and histological grouping were showed in receiver operator characteristic curve with AUC calculated. (G) Odds ratio of age, gender, biopsy position, endoscopic grouping, histological grouping and CDRG-based clustering in multivariable logistic regression analysis were showed in forest plot. ns, P > 0.05; *, P < 0.05; **, P < 0.01; ***, P < 0.001. |
Unsupervised hierarchical clustering grouped the samples into CDRG-active (72.85% clinical active and 80.00% endoscopic active) and CDRG-inactive clusters (72.80% clinical inactive and 45.31% endoscopic inactive). Histologically, 78.82% of active and 75.29% of inactive samples were clustered into CDRG-active and -inactive clusters, respectively (Figure 1C and D). The robustness of the CDRG-based grouping was further confirmed by principal component analysis (PCA) and sample-sample correlation analysis based on 15 CDRGs. The samples converged into 2 distinctive groups according to the CDRG-based grouping, but were confused based on clinical, endoscopic, or histological grouping (Figure 1E and Figure S2E–G). CDRG-based grouping accurately predicted histological (AUC = 0.77, Cohen’s Kappa = 0.439, binomial test P < 0.001) and clinical (AUC = 0.72, Cohen’s Kappa = 0.506, P < 0.001) grouping, but not endoscopic grouping (AUC = 0.63, Cohen’s Kappa = 0.220, P = 0.992; Table S2D–F and Figure 1F). Multivariable logistic regression analysis confirmed CDRG-based grouping as an independent predictor of clinical grouping from age, gender, position, endoscopic and histological grouping in 255 samples with available Nancy index (OR = 2.92, 95% CI = 1.50–5.80, P = 0.002, Figure 1G) and in 593 samples excluding histological grouping (OR = 5.82, 95% CI = 3.85–8.90, P < 0.001, Figure S2H). These results highlighted active CDRGs as a key marker and CDRG-based grouping as a robust predictor of clinical activity in UC.
Active Cell Death-Related Genesets Explained the Inconsistence Between Clinic and Histology, and Improved the Concordance Between Clinic, Histology and Endoscopy on UC Grouping
Denoting samples with consistent activity or inactivity of histological, endoscopic, and CDRG-based grouping to clinical grouping as the histological, endoscopic, and CDRG-consistent samples, respectively, 162 CDRG-inconsistent samples overlapped with the histological-inconsistent samples (51/82, Cohen’s Kappa: 0.46, P = 0.002), but 191 endoscopic-inconsistent samples were different from CDRG-inconsistent (52/161, Cohen’s Kappa: 0.00, binomial test: P = 1.000) and histological-inconsistent samples (21/82, Cohen’s Kappa: −0.10, binomial test: P = 1.000; Table S3A–C; Figure 2A and B). The predictive value of CDRG inconsistence for histological inconsistence (AUC = 0.73) was better than that of endoscopic inconsistence (AUC = 0.50; DeLong test: FDR < 0.001) and endoscopic inconsistence for histological inconsistence (AUC = 0.45; DeLong test: FDR < 0.001) (Figure 2C). Subgroup analysis revealed that in CDRG-consistent samples, histological grouping showed improved predictive value (AUC = 0.82 vs 0.70, FDR = 0.002) and precision (Cohen’s Kappa = 0.64 vs 0.38) on clinical grouping compared to all samples. In contrast, histological grouping exhibited no predictive value (AUC = 0.46 vs 0.70, FDR < 0.001) and poor precision (Cohen’s Kappa = 0.08 vs 0.38) in CDRG-inconsistent samples (Tables 2, 3, S2A and Figure 2D). However, endoscopic grouping showed no significant changes in the predictive value or precision across the subgroups of CDRG inconsistence (Table S2B, C, S3D–G; Figure 2E and F). These results suggested that by the standard of clinical grouping, CDRG inconsistence resolved histological inconsistence, which expired in the CDRG-consistent samples, while endoscopic inconsistency remains unaddressed.
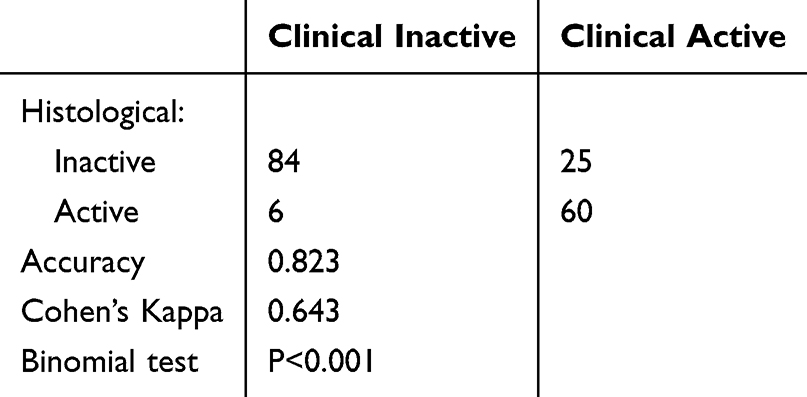 |
Table 2 The Concordance Between the Clinical and Histological Grouping in CDRG-Consistent Samples |
 |
Table 3 The Concordance Between the Clinical and Histological Grouping in CDRG-Inconsistent Samples |
 |
Figure 2 Active cell death related genesets improved the concordance between clinical, histological, endoscopic grouping and explained the histological-inconsistence to clinical grouping. (A) Distribution on inconsistent samples of histological, endoscopic, and CDRG-based clustering to clinical grouping. (B) Concordance between the inconsistence of CDRG-based clustering, endoscopic grouping, and histological grouping to clinical grouping. (C) Predictive value of CDRG-inconsistence to endoscopic inconsistence and histological inconsistence, and of endoscopic inconsistence to histological inconsistence. (D–F) Predictive value of histological grouping (D), endoscopic grouping (E) to clinical grouping, and of endoscopic grouping to histological grouping (F) in different subgroups of CDRG-consistence. (G) Concordance between histological grouping, Nancy index, iNancy index and groupings based on iNancy index. (H and I) Predictive value of iNancy index (H) and grouping based on iNancy (I) to clinical grouping, compared with Nancy index and histological grouping. (J) Concordance between endoscopic grouping, MES, iMES and groupings based on iMES. (K and L) Predictive value of iMES (H) and grouping based on iMES (I) to clinical grouping, compared with MES and endoscopic grouping. ns, P > 0.05; *, P < 0.05; **, P < 0.01; ***, P < 0.001. |
To investigate the effects of the combination on CDRG-based grouping with the Nancy index and MES, samples with inactive or active CDRGs were scored as 0 or 1, respectively. The improved Nancy index (iNancy) and improved MES (iMES) were calculated by summing CDRG-based grouping up with the scores of the Nancy index and MES, respectively. Samples scored as Nancy 0 were divided into iNancy 0 (67.74% clinical inactive) and iNancy 1 (55.26% clinical active), whereas MES 1 samples were divided into iMES 1 (60.54% clinical inactive) and iMES 2 (71.43% clinical active; Figure 2G and J). The iNancy (AUC = 0.77 vs 0.73, P = 0.010) and iMES (AUC = 0.79 vs 0.74, P < 0.001) showed improved predictive values for clinical grouping (Figure 2H and K). Samples with iNancy 0–1 or iMES 0–1 were grouped into the inactive group, and the other samples were grouped into the corresponding active group. The iNancy grouping better predicted clinical grouping (AUC = 0.70 vs 0.71; P = 0.043; Figure 2I), while the iMES grouping showed higher precision in the prediction on clinical grouping without significance (AUC = 0.70 vs 0.72; P = 0.196; Figure 2L) and on iNancy grouping with significance (AUC = 0.73 vs 0.62; P = 0.003; Figure S3A and B). These results highlighted CDRG-based grouping as a potent independent predictor, improving the concordance between clinical, histological, and endoscopic grouping in UC management.
Active Cell Death-Related Genesets Associated with the Altered Gene-Expression Patterns in UC Activation Beyond Clinical Grouping
Interactions between cell death and altered GEPs in UC remain poorly understood. Among the 2,938 differentially expressed genes (DEGs) identified between the clinical groups, 94.88% upregulated DEGs and 96.79% downregulated DEGs remain homogeneous in CDRG-consistent samples. In contrast, only 2.38% of DEGs remain homogeneous in CDRG-inconsistent samples, with 72.50% of DEGs showing inverse expression patterns compared with CDRG-consistent samples, such as SERPINB3, SERPINB4, S100A7, etc (Figure 3A and B). DEG-based grouping divided the samples into 2 clusters: a DEG-active cluster (88.37% clinical active and 97.67% CDRG-active samples) with higher activity in the ferroptosis_driver, necroptosis_driver, and pyroptosis_driver, and a DEG-inactive cluster (70.75% clinical inactive and 80.27% CDRG-inactive samples). The CDRG-based grouping showed greater consistency than clinical grouping in the DEG-based grouping (Figure 3C; Table S4A, D). The DEG-based grouping precisely identified the histological grouping but not the endoscopic grouping (Table S4B, S4C). PCA based on DEGs revealed distinct clustering by CDRG-based grouping but not by clinical grouping (Figure 3D). The predictive value of CDRG-DEG prediction (AUC = 0.890) was significantly higher than that of CDRG-clinical prediction (AUC = 0.723, FDR < 0.001) or DEG-clinical prediction (AUC = 0.712, FDR < 0.001; Figure 3E). The DEG-inconsistent samples were homogeneous to the CDRG-inconsistent samples (AUC: 0.798, accuracy: 0.842, Cohen’s Kappa: 0.588, P < 0.001; Figure 3F, G and Table S4E). These results demonstrated that the difference characterized by altered GEPs has a higher consistence with the CDRGs than clinical grouping, in the evidences of clustering, PCA, and prediction, even though the altered GEPs were identified from different clinical groups in UC. The inconsistent samples to clinical grouping homogeneously identified by DEG-based clustering and CDRG-based clustering reflected an intrinsic association between CDRGs and altered GEPs beyond clinical grouping.
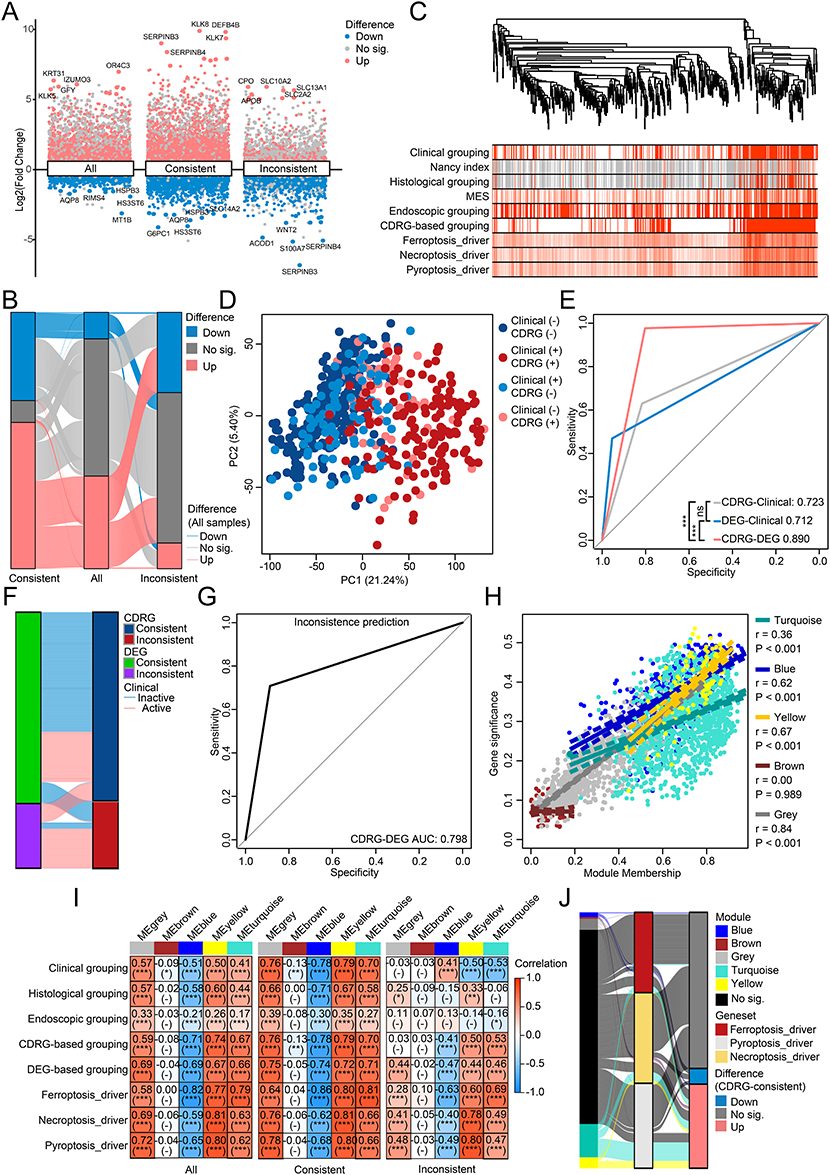 |
Figure 3 Intrinsic association between cell death related genesets and altered gene-expression patterns in UC. (A) DEGs derived from samples of different clinical grouping in different subgroups of CDRG-consistence. (B) Concordance between the DEGs derived from samples of different clinical grouping in different subgroups of CDRG-consistence. (C) Unsupervised hierarchical clustering based on DEGs derived from all samples, with the levels of clinic, Nancy index, histology, MES, endoscopy, CDRG-based clustering, and 3 representative CDRGs annotated. (D) Distribution of samples grouped by clinic and CDRG-based clustering in PCA based on DEGs derived from all samples. (E) Predictive value of CDRG-based clustering and DEG-based clustering to clinic, and of CDRG-based clustering to DEG-based clustering. (F) Concordance between the inconsistence of DEG-based clustering and CDRG-based clustering to clinical grouping. (G) Predictive value of CDRG-inconsistence to DEG-inconsistence. (H) Correlations between module membership and gene significance of genes in different GCMs. (I) Correlations between the topological values of GCMs and clinic, histology, endoscopy, CDRG-based clustering, DEG-based clustering, 3 representative CDRGs in samples in different subgroups of CDRG-consistence. (J) Concordance of genes between the GCMs, 3 representative CDRGs, and DEGs derived from CDRG-consistent samples. ns, P > 0.05; *, P < 0.05; **, P < 0.01; ***, P < 0.001. |
The interpretation of altered GEPs by WGCNA deepened the understanding of the intrinsic association between CDRGs and altered GEPs in UC. DEGs were clustered into 5 GCMs, 4 of which were confirmed confident (blue: r = 0.62, P < 0.001; grey: r = 0.84, P < 0.001; turquoise: r = 0.36, P < 0.001; yellow: r = 0.67, P < 0.001), except for the inconfident brown GCM (r = −0.00, P = 0.989; Figure 3H and S4). Significant correlations were observed between the 4 confident GCMs and CDRG-based, DEG-based grouping, 3 representative CDRGs without change across subgroups of CDRG inconsistence, whereas these correlations with the clinical and endoscopic grouping were inverse or insignificant in CDRG-inconsistent samples compared with CDRG-consistent samples (Figure 3I). Most genes associated with 3 representative CDRGs were not DEGs in CDRG-consistent samples (61.01%, 169/277) or members of any GCM (75.81%, 210/277), and rest genes were distributed across GCMs (5 in blue, 2 in brown, 12 in grey, 36 in turquoise, and 12 in yellow; Figure 3J). Thus, these findings revealed an intrinsic association between the CDRGs and altered GEPs, independent of clinical grouping, supported by inverse or insignificant correlations between clinical groups and GCMs in CDRG-inconsistent samples. This highlighted role of CDRGs in explaining altered GEPs beyond the clinical grouping in UC.
Active Cell Death-Related Genesets Intrinsically Associated with the Altered Gene-Expression Patterns Beyond Clinical Grouping in Multiple Validation Cohorts
The intrinsic association between CDRGs and altered GEPs was validated across multiple cohorts, GSE108746 (n = 35), GSE128682 (n = 28), GSE243625 (n = 30), with 93 patients with UC (46 clinical active and 47 clinical inactive samples). The 3 representative CDRGs were significantly activated in clinical active samples (Figure 4A). CDRG-based grouping accurately identified CDRG-active cluster (100% of clinical active samples) and CDRG-inactive cluster (85.45% of clinical inactive samples; Figure 4B). Using 2812 DEGs (excluding inconfident brown GCM), the samples were clustered into a DEG-active cluster with active CDRGs (100% clinical active samples) and a DEG-inactive cluster with inactive CDRGs (90.38% clinical inactive samples; Figure 4C). As expected, both CDRG-based and DEG-based PCA confirmed distinct clustering by CDRG-based grouping, but not by clinical grouping in the GSE108746 and GSE243625 cohorts (Figure 4D–E). Combining the results of the CDRG-based and DEG-based grouping, the predictive value of CDRG-DEG prediction (AUC = 0.97) was higher than that of CDRG-clinical prediction (AUC = 0.91) and DEG-clinical prediction (AUC = 0.95; Figure 4F). WGCNA on the validation cohorts confirmed the robustness of GCMs, with most genes re-identified in the same GCMs (Figure 4G). GCMs correlated strongly with clinical grouping and 3 representative CDRGs, except for partial grey GCM to Ferroptosis_driver in GSE128682 (r = −0.30, P = 0.10) and partial turquoise GCM to groups in GSE243625 (r = 0.29, P = 0.10; Figure 4H). These results were well reproduced in 4 supplementary cohorts with large sample size and demonstrated reproducible differences in CDRGs and altered GEPs between clinical groups, as well as a robust intrinsic association between them (Figure S5).
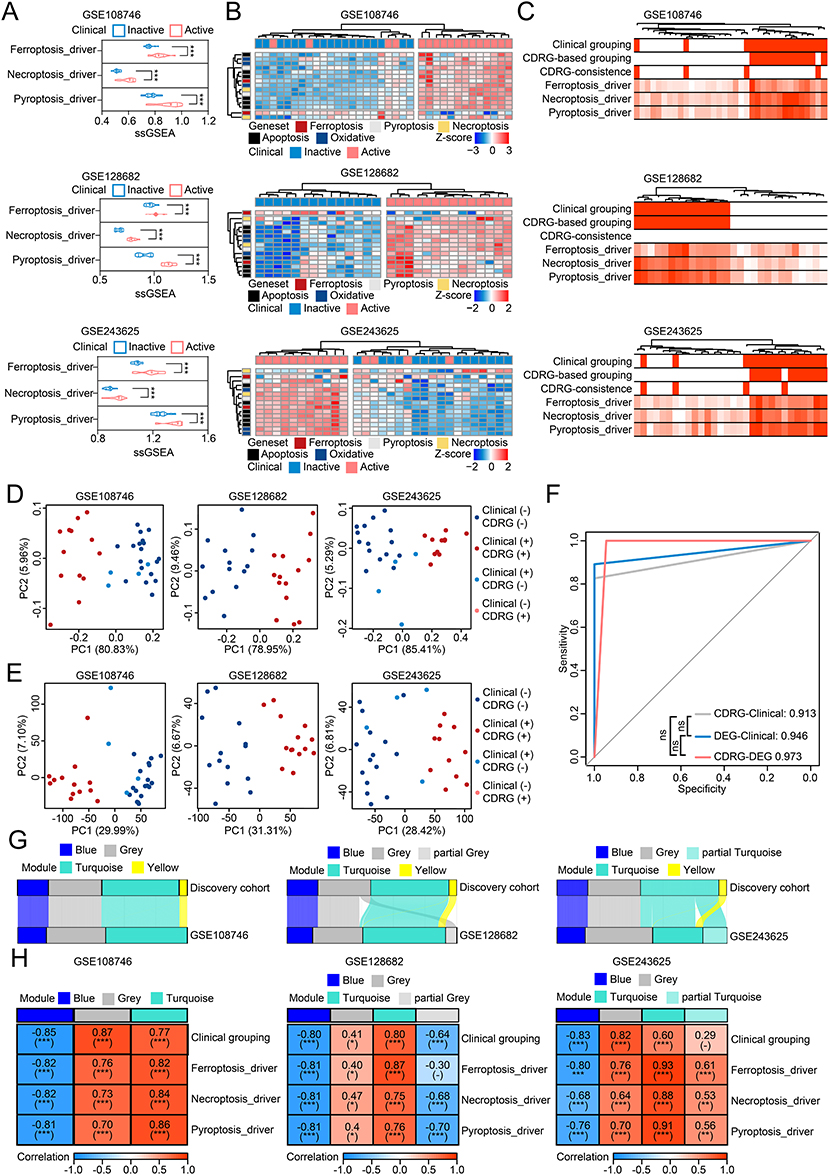 |
Figure 4 Intrinsic association between cell death related genesets and altered gene-expression patterns was reproduced in multiple validation cohorts of UC. (A) Median, upper/lower quartiles, and upper/lower limits of the CDRGs’ activities created using ssGSEA in 3 validation cohorts. (B) Unsupervised hierarchical clustering based on CDRGs in 3 validation cohorts. (C) Unsupervised hierarchical clustering based on DEGs of 4 confident GCMs in 3 validation cohorts, with annotation of clinic, CDRG-based clustering, CDRG-inconsistence to clinic, and 3 representative CDRGs. (D) Distribution of samples grouped by clinic and CDRG-based clustering in PCA based on CDRGs in 3 validation cohorts. (E) Distribution of samples grouped by clinic and CDRG-based clustering in PCA based on DEGs with genes of brown GCM excluded. (F) Predictive value of CDRG-based clustering and DEG-based clustering to clinic, and of CDRG-based clustering to DEG-based clustering in samples of 3 validation cohorts. (G) Concordance between 4 confident GCMs of discovery cohort and GCMs detected in 3 validation cohorts. (H) Correlations between the GCMs detected in 3 validation cohorts and clinic and 3 representative CDRGs. ns, P > 0.05; *, P < 0.05; **, P < 0.01; ***, P < 0.001. |
Single-Cell RNA Sequencing Revealed Cell-Type Specific Heterogeneity on the Intrinsic Association Between Cell Death-Related Genesets and Altered Gene-Expression Patterns in UC
Single-cell RNA sequencing of 24,340 cells from 3 clinical active samples and 4 inactive samples identified 11 cell types, including B cells, NK & T cells, plasma cells, myeloid cells, mast cells and eosinophils, epithelial cells, endothelial cells, fibroblasts, pericytes, glia cells, and cycling cells (Figure 5A). Clinical active samples showed a more than 1.5-fold increase in B cells (7.60% vs 17.64%), plasma cells (14.51% vs 28.33%), and cycling cells (2.37% vs 6.02%), and a more than 0.5-fold decrease in epithelial cells (26.17% vs 4.68%) and glia cells (1.90% vs 0.29%). The absolute decrease in epithelial cells (21.49%) was the most altered cell type in UC activation (Figure 5B). The 3 representative CDRGs were active in endothelial cells, pericytes, fibroblasts, and partially active in epithelial cells (ferroptosis_driver and pyroptosis_driver) and myeloid cells (pyroptosis_driver), but inactive in plasma cells (ferroptosis_driver and necroptosis_driver; FDR < 0.05; Figure 5C–E). To investigate the intrinsic association between CDRGs and altered GEPs at single-cell resolution, GCMs were split into upregulated and downregulated genes (except yellow GCM with entirely upregulated genes). Significant differences were observed in 5 split GCMs across multiple cell types, except for mast cells and eosinophils, between the clinical groups, especially in epithelial cells, endothelial cells, pericytes, and fibroblasts (Figure 5F–I). Cell type-specific correlation analysis revealed strong associations between 3 representative CDRGs and 5 split GCMs in epithelial cells (absolute r > 0.3: 9/15), endothelial cells (absolute r > 0.3: 13/15), pericytes (absolute r > 0.3: 11/15), fibroblasts (absolute r > 0.3: 12/15), myeloid cells (absolute r > 0.3: 15/15), plasma cells (absolute r > 0.3: 12/15), and cycling cells (absolute r > 0.3: 9/15), but not in the other 4 cell types (absolute r > 0.3: 1/60) (Figure 5J). These results provided a novel insight into the cell type-specific intrinsic association between CDRGs and altered GEPs in UC patients.
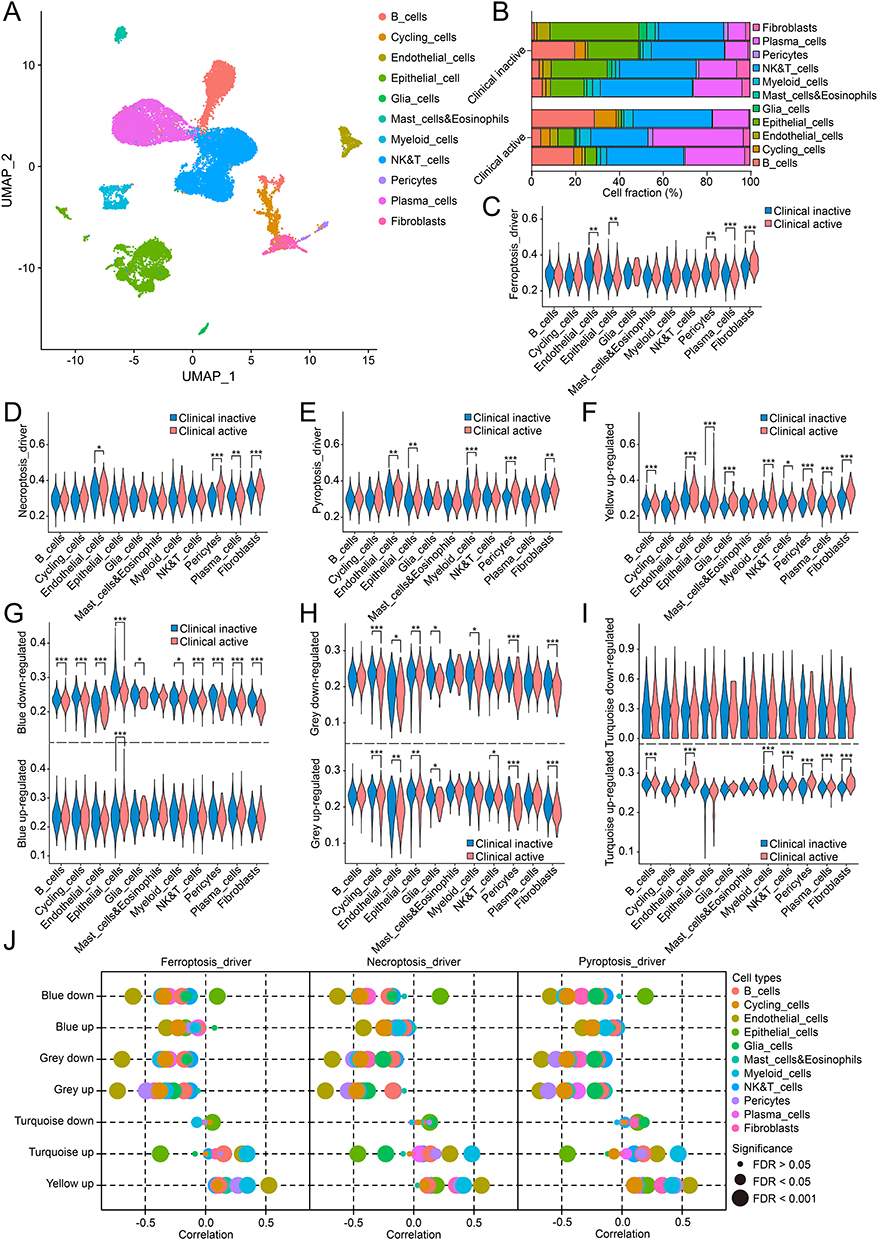 |
Figure 5 Single-cell analysis revealed intrinsic association observed in specific cell types in UC. (A) 11 distinct cell types identified in single-cell analysis. (B) Fractions of 11 cell types in clinical inactive and active samples. (C–E) Cell-type specific activities of Ferroptosis_driver (C), Necroptosis_driver (D), Pyroptosis_driver (E) between clinical grouping. (F–I) Cell-type specific activities of yellow (F), blue (G), grey (H) and turquoise (I) GCMs between clinical grouping. (J) Cell-type specific correlations between 3 representative CDRGs and GCMs. ns, P > 0.05; *, P < 0.05; **, P < 0.01; ***, P < 0.001. |
Intrinsic Association Impacted Multiple Cell Types and Altered Infiltration of Immune Cells by Reshaped Cell-Cell Communications
The deconvolution algorithm CIBERSORTx estimated cell fractions using cell type-specific signatures from scRNA-seq data. In non-immune cells, epithelial cells decreased by 13.90% in clinical active samples compared to inactive samples, whereas the other cells increased (Wilcoxon test: FDR < 0.05), except for glia cells (FDR = 0.52). The alterations were enlarged in CDRG-consistent samples, with a 26.18% loss of epithelial cells in clinical active samples. Conversely, CDRG-inconsistent samples showed a 13.66% increase in epithelial cells and a 2.23% decrease in cycling cells, suggesting that epithelial cells were the main target of active CDRGs, accompanied by altered cell proliferation (Figure 6A). The dead epithelial cells were estimated based on the difference to the average fraction of epithelial cells in clinical inactive samples. As expected, significant correlations were observed between non-immune cells with intrinsic association (except glia cells) and transcriptional features (CDRG-based grouping, DEG-based grouping, 3 representative CDRGs, and 4 confident GCMs) without changes across subgroups of CDRG inconsistence. In contrast, correlations with clinical, endoscopic, and histological grouping were inverse or insignificant in CDRG-inconsistent samples (Figure 6B). Among immune cells, B cells increased, while NK & T cells and mast cells and eosinophils decreased in CDRG-consistent clinical active samples (FDR < 0.05). Conversely, CDRG-inconsistent samples showed decreased plasma cells and increased NK & T cells and mast cells and eosinophils (FDR < 0.05; Figure 6C). Altered immune cell fractions (excluding myeloid cells) correlated with transcriptional features without change across subgroups of CDRG inconsistence, whereas correlations with clinical and histological features changed (Figure 6D). These results highlighted the impact of the intrinsic association between CDRGs and altered GEPs on multiple cell types beyond clinical grouping.
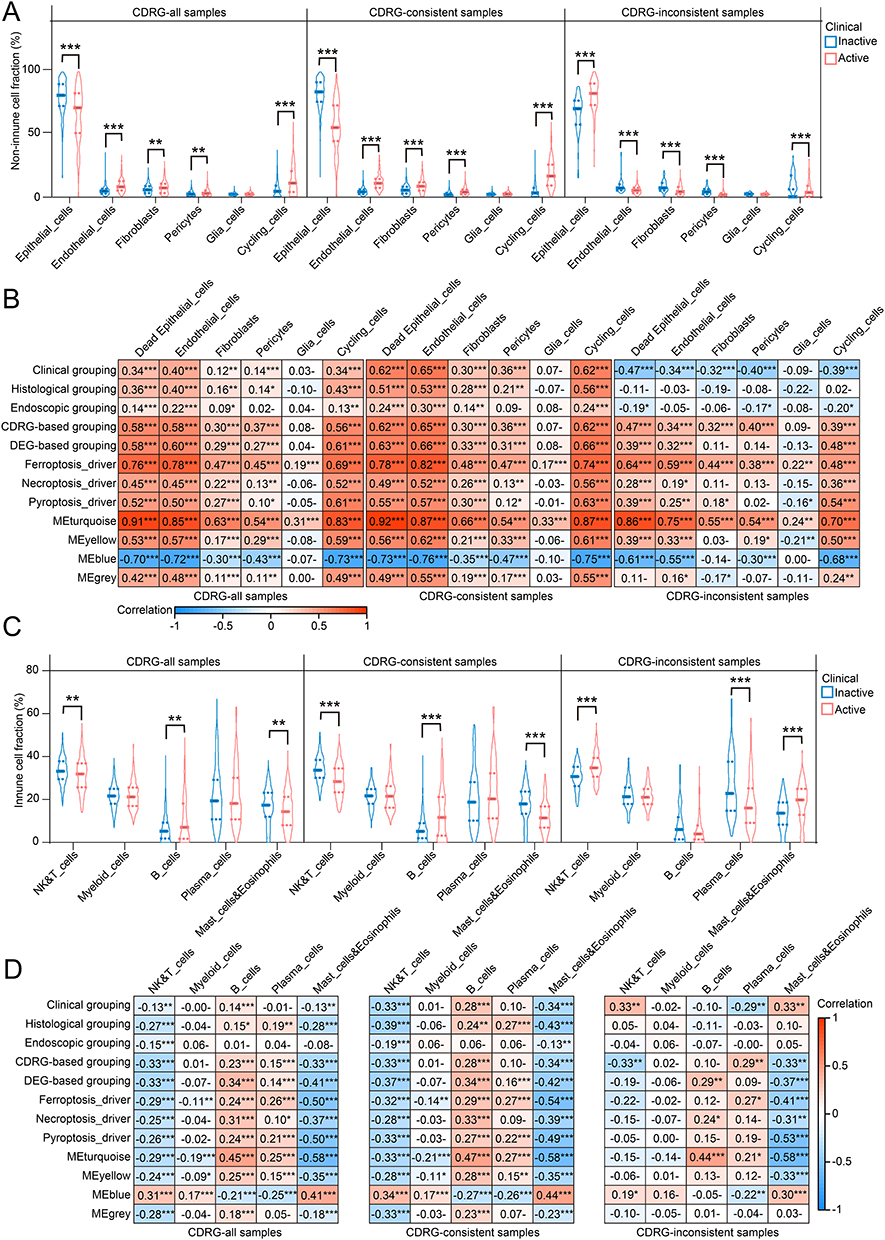 |
Figure 6 Altered cell fractions of 11 cell types in UC. (A) Median, upper/lower quartiles, upper/lower limits of cell fractions estimated on 6 non-immune cell types between clinical grouping. (B) Correlations between cell fractions of 6 non-immune cell types and clinic, histology, endoscopy, CDRG-based clustering, DEG-based clustering, 3 representative CDRGs, and 4 confident GCMs. (C) Median, upper/lower quartiles, upper/lower limits of cell fractions estimated on 5 immune cell types between clinical grouping. (D) Correlations between cell fractions of 5 immune cell types and clinic, histology, endoscopy, CDRG-based clustering, DEG-based clustering, 3 representative CDRGs, and 4 confident GCMs. ns, P > 0.05; *, P < 0.05; **, P < 0.01; ***, P < 0.001. |
Non-immune cells commonly exhibited higher correlations with transcriptional features than immune cells, suggesting that intrinsic association mainly targeted non-immune cells, and reshaped immune infiltration through intercellular interactions. Cell-cell communication analysis supported this hypothesis, revealing that non-immune cells were the major source of interactions, primarily through secreted signaling and cell-cell contact (Figure 7A and C), whereas fibroblasts dominated ECM-receptor interactions (Figure 7B). Critical interactions involved MIF, MDK, and LGALS9 in secreted signaling, collagens and laminins in ECM-receptor, and major histocompatibility complexes in cell-cell contact. These interactions were enhanced in clinical active samples, except for secreted signalings sourced from fibroblasts or targeted myeloid cells and plasma cells, ECM-receptors sourced from endothelial cells, fibroblasts, and glia cells to mast cells and eosinophils, and cell-cell contacts from endothelial cells and fibroblasts to NK & T cells (Figure 7D and E). These results partially explained the enrichment of B cells and loss of NK & T cells and mast cells and eosinophils in clinical active samples.
 |
Figure 7 Cell-cell communication analysis found abundant interactions from non-immune cells to immune cells in UC. (A–C) Top 30% probable interactions clustered by secreted signaling (A), ECM-receptor (B), cell-cell contact (C) between 11 cell types. (D) Interactions from non-immune cells to immune cells between clinical grouping. (E) Total probability of interactions from epithelial cells (upper left), endothelial cells (upper center), fibroblasts (upper right), pericytes (lower left), glia cells (lower center) and cycling cells (lower right) in secreted signaling, ECM-receptor, cell-cell contact between paired immunes cells of different clinical grouping. |
Dead Epithelial Cells Released Cytokines Underlying UC Activation
Compared with CDRG-consistent samples, clinical active samples with inactive CDRGs showed increased epithelial cells, as the up-regulated markers EPCAM, KRT8, and VIL1 (Wilcoxon test P < 0.001; Figure 8A–C). This suggested that epithelial cells were the main target of active CDRGs, consistent with the findings from scRNA-seq and RNA-seq deconvolution. Massive cytokines were being to release during the process of cell death, such as the mediators of secreted signaling, MIF, MDK, LGALS9. The expression of MDK increased in both scRNA-seq and RNA-seq of clinical active samples. However, complexities were observed in that MIF and LGALS9 were upregulated in scRNA-seq of clinical active epithelial cells but downregulated in RNA-seq of CDRG-consistent clinical active samples (Figure 8D–G). High correlations were observed between epithelial markers, MDK, LGALS9 and transcriptional features across subgroups of CDRG inconsistence, and were independent of clinical, histological, or endoscopic grouping (Figure 8H). The cytokines MIF, MDK, and LGALS9 were positively correlated with 3 representative CDRGs and 5 split GCMs in epithelial cells (Figure S6). The results of RNA-seq represented the total expressions from multiple cell types, where the cell-type specific expression levels and the proportions of cell types contributed to the complexities. To confirm the role of epithelial cells, colon organoids consisted of epithelial cells were established and investigated. In rodent colon organoids, induction of ferroptosis, necroptosis, and pyroptosis for 12 hours caused bud shrinkage and destruction, and increased cell death (Figure 8I). Quantification of dead cells by LDH activity showed increased cell death after incubation for 12h compared with DMSO treatment (Tukey’s multiple comparisons P < 0.001) (Figure 8J). The MIF and MDK were up-regulated in TSZ treatment and were not altered in other treatments compared with DMSO treatment (MIF: TSZ vs DMSO, 1.00±0.03 vs 2.85±0.52, P < 0.01; MDK: TSZ vs DMSO, 1.00±0.14 vs 14.81±2.79, P < 0.001; Figure 8K–L), while LGALS9 was not responsive to any induction of ferroptosis, necroptosis, pyroptosis (Figure 8M). These results highlighted the specific role of necroptosis in the upregulation of MIF and MDK, whereas LGALS9 expression remains unchanged.
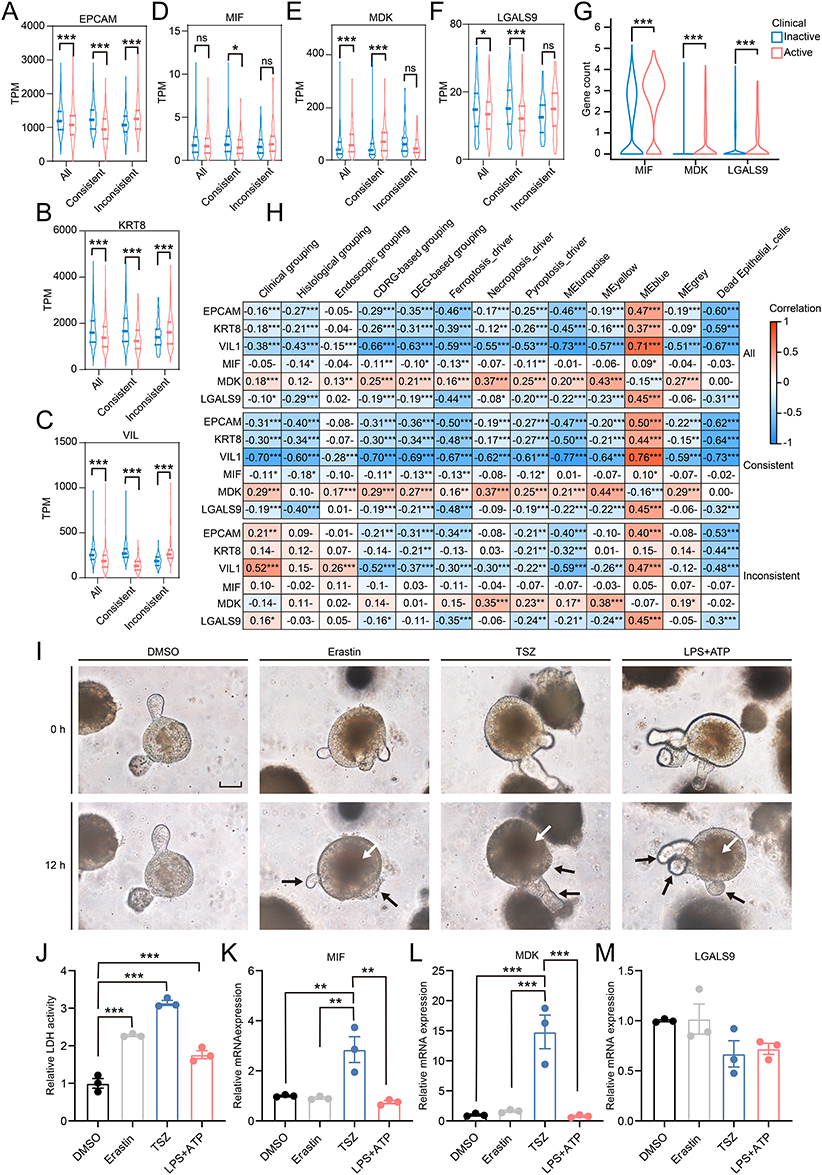 |
Figure 8 Epithelial cells were the main target responsive to active CDRGs and released cytokines to promote inflammation in UC. (A–F) Median, upper/lower quartiles, upper/lower limits of transcriptional levels of EPCAM (A), KRT8 (B), VIL1 (C), MIF (D), MDK (E), LGALS9 (F) in samples of different clinical grouping in different subgroups of CDRG-consistence. (G) Gene counts from epithelial cells in single-cell RNA sequencing of MIF, MDK, LGALS9 were showed in violin plot. (H) Correlations between EPCAM, KRT8, VIL1, MIF, MDK, LGALS9 and clinic, histology, endoscopy, CDRG-based clustering, DEG-based clustering, 3 representative CDRGs, 4 confident GCMs, fraction of dead epithelial cells. (I) Colon organoids were pictured in bright field at the start (0h) and the end (12h) of the incubation with DMSO, Erastin, TSZ, LPS+ATP, with shrank buds of organoids pointed by black arrow and increased dead cells pointed by white arrow (Scale bar: 50μm). (J) Activity of LDH in the supernatant of culture medium from colon organoids incubated with DMSO, Erastin, TSZ, LPS+ATP for 12h. (K–M) Relative transcriptional levels of MIF (K), MDK (L), LGALS9 (M) in colon organoids incubated with DMSO, Erastin, TSZ, LPS+ATP for 12h. Data were normalized by Actb housekeeping gene and presented by mean±SEM. ns, P > 0.05; *, P < 0.05; **, P < 0.01; ***, P < 0.001. |
Discussion
Discordance across the clinical, histological, and endoscopic depths of mucosal healing was an issue of concern in the clinical managements of patients with UC. In this study, grouping based on the transcriptional activity of CDRGs served as an independent predictor of clinical grouping from age, sex, biopsy position, histological grouping, and endoscopic grouping and was robust in the validation of multiple independent cohorts with variable sample size. CDRG-based grouping resolved the inconsistence between clinical grouping and histological grouping, and its integration with the Nancy index and MES significantly improved concordance across clinical, endoscopic, and histological grouping in UC. These findings highlighted the unique value of CDRG-based grouping as an independent predictor from different depths of mucosal healing in clinical practice. This provided a novel insight into the transcriptional depth of mucosal healing on the UC grouping.
The integration of CDRG-based grouping with the MES and Nancy indexes significantly improved their predictive value. Further refinement of these integrations, such as establishing optimal cutoff values for patients scored as iNancy 1 and iMES 1, could better stratify heterogeneous samples in clinical groups. Notably, the robustness of the CDRGs was validated in both 5 cohorts with large sample size and in 3 independent cohorts, even with a small sample size of approximately 30. This demonstrates the low threshold and feasibility for clinical application, as approximately 30 biopsy samples from 5 to 6 patients were sufficient to yield reproducible results. Thus, our findings had broad application prospects for clinical transformation.
Further analysis using RNA-seq and scRNA-seq revealed an intrinsic association between CDRGs and altered GEPs with cell-type specificity beyond clinical grouping in multiple cohorts. The altered GEPs were consistent with CDRG-based grouping rather than with clinical grouping. The intrinsic association had a wide impact on non-immune cells and subsequently reshaped immune infiltration by altered intercellular interactions. Epithelial cells were the main target of active CDRGs and were thought to release MIF, MDK, and LGALS9 during cell death. While the transcriptional regulation of MIF was complex in the discovery cohort in this study and rodent models in other studies,35–37 elevated serum levels of MIF and MDK in patients with UC correlated with disease severity and inflammatory biomarkers.37–39 MIF had been proven to be fundamental in establishing chronic colitis in rodents and had been found to contribute to resistance to glucocorticoid therapy and a higher frequency of polymorphisms in UC.37,40–43 The increased serum MDK level was potentially sourced from colon mucosa with overexpressed MDK mRNA, as peripheral blood mononuclear cells showed no significant transcriptional differences between patients with UC and healthy controls.44,45 Additionally, impaired LGALS9 expression participated in UC activation in both patients and rodent models,46,47 whereas supplementation with LGALS9 showed protective effects against colitis by regulating T cell differentiation and epithelial restitution.47–51
In colon organoids, ferroptosis, necroptosis, and pyroptosis were successfully induced by Erastin, TSZ, and LPS+ATP, respectively. However, significant upregulation of MIF and MDK was observed exclusively under TSZ treatment, which is consistent with the role of TNF-α in inducing their expressions.45,52,53 Serum level of MIF and MDK was positively correlated with serum level of TNF-α in inflammatory and colorectal disease.54,55 The altered expressions of MIF, MDK, and LGALS9 in epithelial cells of organoids partially explain the complexities between scRNA-seq and RNA-seq. The cell-type specific expression levels and the proportions of cell types contributed to the results of RNA-seq simultaneously. With the losses of epithelial cells in colon tissues, the MDK strongly upregulated in organoids persistently remain upregulated, the MIF moderately upregulated in organoids was insignificantly altered, and the LGALS9 unaltered in organoids was downregulated in RNA-seq ultimately. Although MIF and MDK were not upregulated under the Erastin and LPS+ATP treatments, the induced epithelial cell death was supposed to result in excessive cytokine release and exacerbated inflammation. Thus, simultaneous inhibition of ferroptosis, necroptosis, and pyroptosis was a novel therapeutic strategy for mitigating proinflammatory cytokine release in UC. And the local drug delivery by non-absorbable biomaterials with natural bioactive compounds might reduce the possible adverse effects.
This study had some limitations. First, CDRG-based grouping relied on protein-coding genes profiled by RNA-seq and ssGSEA of 15 CDRGs, which imposed technological and cost-effective constraints. The gene arrays targeting genes of 15 CDRGs might be a useful tool for clinical transformation. The identification of hub genes and development of models with CDRGs using machine learning might improve the efficiency and performance on UC grouping. The determination of cell death in the colon mucosa using clinical biomarkers, endoscopic visualization, and histological staining was a desirable and practical method that bridged the gap between transcriptional CDRGs and clinical applications. Second, novel forms of cell death have been investigated recently, such as cuproptosis, disulfidptosis, and necrosis by sodium overload.56–58 However, little evidence suggested that these novel forms of cell death underlying the development of UC. Thus, these novel forms of cell death would be analyzed after more substantial evidence found in UC. Third, clinical trials should be performed to compare the risks between CDRG-based groups and the long-term outcomes of patients with UC. A better grouping index of mucosal healing predicted a lower risk of relapse, therapy escalation, and surgery, etc. The potential of CDRG-based grouping on the frequency of endoscopy surveillance and guidance for initial therapy should be further investigated.
Conclusion
Our study revealed that CDRGs independently predicted clinical activity, improved the discordance between different levels of mucosal healing in clinical practice, and were intrinsically associated with altered GCP and immune infiltration in UC, with epithelial cells identified as central regulators of cytokine release and immune remodeling in single-cell analysis and colon organoids. The precise identification of mucosal healing might contribute to predict the long-term outcomes and therapy responses of UC patients.
Data Sharing Statement
The datasets analyzed in the current study are available in the GEO repository (https://www.ncbi.nlm.nih.gov/gds), with accession numbers GSE193677, GSE108746, GSE128682, GSE243625, GSE59071, GSE66407, GSE107499, GSE206171 and GSE231993.
Ethics Approval and Consent to Participate
The animal study protocol was approved by the Ethics Committee of Xinhua Hospital (Approval No. XHEC-NSFC-2023-297). According to the item 1 and 2 of Article 32 of the Measures for Ethical Review of Life Science and Medical Research Involving Human Subjects dated February 18, 2023, China, this study used the legally obtained public data and was exempt from approval.
Acknowledgments
The authors thank the researchers for sharing data in GEO database.
Author Contributions
All the authors read and approved the final manuscript. All authors made a significant contribution to the work reported, whether that is in the conception, study design, execution, acquisition of data, analysis and interpretation, or in all these areas; took part in drafting, revising or critically reviewing the article; gave final approval of the version to be published; have agreed on the journal to which the article has been submitted; and agree to be accountable for all aspects of the work.
Funding
This research was funded by the National Natural Science Foundation of China, grant numbers 82170588 and 81974061.
Disclosure
The authors report no conflicts of interest in this work.
References
1. Rath T, Atreya R, Bodenschatz J, et al. Intestinal Barrier Healing Is Superior to Endoscopic and Histologic Remission for Predicting Major Adverse Outcomes in Inflammatory Bowel Disease: the Prospective ERIca Trial. Gastroenterology. 2023;164(2):241–255. doi:10.1053/j.gastro.2022.10.014
2. Barreiro-de Acosta M, Vallejo N, de la Iglesia D, et al. Evaluation of the Risk of Relapse in Ulcerative Colitis According to the Degree of Mucosal Healing (Mayo 0 vs 1): a Longitudinal Cohort Study. J Crohns Colitis. 2016;10(1):13–19. doi:10.1093/ecco-jcc/jjv158
3. Froslie KF, Jahnsen J, Moum BA, Vatn MH. Group I. Mucosal healing in inflammatory bowel disease: results from a Norwegian population-based cohort. Gastroenterology. 2007;133(2):412–422. doi:10.1053/j.gastro.2007.05.051
4. Colombel JF, Rutgeerts P, Reinisch W, et al. Early mucosal healing with infliximab is associated with improved long-term clinical outcomes in ulcerative colitis. Gastroenterology. 2011;141(4):1194–1201. doi:10.1053/j.gastro.2011.06.054
5. Actis GC, Pellicano R, David E, Sapino A. Azathioprine, mucosal healing in ulcerative colitis, and the chemoprevention of colitic cancer: a clinical-practice-based forecast. Inflamm Allergy Drug Targets. 2010;9(1):6–9. doi:10.2174/187152810791292863
6. Viscido A, Valvano M, Stefanelli G, et al. Systematic review and meta-analysis: the advantage of endoscopic Mayo score 0 over 1 in patients with ulcerative colitis. BMC Gastroenterol. 2022;22(1):92. doi:10.1186/s12876-022-02157-5
7. Park S, Abdi T, Gentry M, Laine L. Histological Disease Activity as a Predictor of Clinical Relapse Among Patients With Ulcerative Colitis: systematic Review and Meta-Analysis. Am J Gastroenterol. 2016;111(12):1692–1701. doi:10.1038/ajg.2016.418
8. Kevans D, Kirsch R, Dargavel C, Kabakchiev B, Riddell R, Silverberg MS. Histological Markers of Clinical Relapse in Endoscopically Quiescent Ulcerative Colitis. Inflamm Bowel Dis. 2020;26(11):1722–1729. doi:10.1093/ibd/izz308
9. Cushing KC, Tan W, Alpers DH, Deshpande V, Ananthakrishnan AN. Complete histologic normalisation is associated with reduced risk of relapse among patients with ulcerative colitis in complete endoscopic remission. Aliment Pharmacol Ther. 2020;51(3):347–355. doi:10.1111/apt.15568
10. Steinsbo O, Carlsen A, Aasprong OG, et al. Histologic healing and factors associated with complete remission following conventional treatment in ulcerative colitis. Therap Adv Gastroenterol. 2022;15:17562848221140659. doi:10.1177/17562848221140659
11. Marchal-Bressenot A, Salleron J, Boulagnon-Rombi C, et al. Development and validation of the Nancy histological index for UC. Gut. 2017;66(1):43–49. doi:10.1136/gutjnl-2015-310187
12. Mosli MH, Parker CE, Nelson SA, et al. Histologic scoring indices for evaluation of disease activity in ulcerative colitis. Cochrane Database Syst Rev. 2017;5(5):CD011256. doi:10.1002/14651858.CD011256.pub2
13. Lemmens B, Arijs I, Van Assche G, et al. Correlation between the endoscopic and histologic score in assessing the activity of ulcerative colitis. Inflamm Bowel Dis. 2013;19(6):1194–1201. doi:10.1097/MIB.0b013e318280e75f
14. Riley SA, Mani V, Goodman MJ, Dutt S, Herd ME. Microscopic activity in ulcerative colitis: what does it mean? Gut. 1991;32(2):174–178. doi:10.1136/gut.32.2.174
15. Xu M, Tao J, Yang Y, et al. Ferroptosis involves in intestinal epithelial cell death in ulcerative colitis. Cell Death Dis. 2020;11(2):86. doi:10.1038/s41419-020-2299-1
16. Huang F, Zhang S, Li X, Huang Y, He S, Luo L. STAT3-mediated ferroptosis is involved in ulcerative colitis. Free Radic Biol Med. 2022;188:375–385. doi:10.1016/j.freeradbiomed.2022.06.242
17. Liu C, Wang H, Han L, et al. Targeting P2Y(14)R protects against necroptosis of intestinal epithelial cells through PKA/CREB/RIPK1 axis in ulcerative colitis. Nat Commun. 2024;15(1):2083. doi:10.1038/s41467-024-46365-x
18. Li W, Chen D, Zhu Y, et al. Alleviating Pyroptosis of Intestinal Epithelial Cells to Restore Mucosal Integrity in Ulcerative Colitis by Targeting Delivery of 4-Octyl-Itaconate. ACS Nano. 2024;18(26):16658–16673. doi:10.1021/acsnano.4c01520
19. Kanehisa M, Furumichi M, Sato Y, Matsuura Y, Ishiguro-Watanabe M. KEGG: biological systems database as a model of the real world. Nucleic Acids Res. 2024;53:672.
20. Gene Ontology C, Aleksander SA, Balhoff J, et al. The Gene Ontology knowledgebase in 2023. Genetics. 2023;224(1):1.
21. Orlic-Milacic M, Rothfels K, Matthews L, et al. Pathway-based, reaction-specific annotation of disease variants for elucidation of molecular phenotypes. Database. 2024;2024. doi:10.1093/database/baae031
22. Zhou N, Yuan X, Du Q, et al. FerrDb V2: update of the manually curated database of ferroptosis regulators and ferroptosis-disease associations. Nucleic Acids Res. 2023;51(D1):D571–D82. doi:10.1093/nar/gkac935
23. Stelzer G, Rosen N, Plaschkes I, et al. The GeneCards Suite: from Gene Data Mining to Disease Genome Sequence Analyses. Curr Protoc Bioinformatics. 2016;54(1):301–313. doi:10.1002/cpbi.5
24. Barbie DA, Tamayo P, Boehm JS, et al. Systematic RNA interference reveals that oncogenic KRAS-driven cancers require TBK1. Nature. 2009;462(7269):108–112. doi:10.1038/nature08460
25. Hanzelmann S, Castelo R, Guinney J. GSVA: gene set variation analysis for microarray and RNA-seq data. BMC Bioinf. 2013;14(1):7. doi:10.1186/1471-2105-14-7
26. Li Y, Ge X, Peng F, Li W, Li JJ. Exaggerated false positives by popular differential expression methods when analyzing human population samples. Genome Biol. 2022;23(1):79. doi:10.1186/s13059-022-02648-4
27. Langfelder P, Horvath S. WGCNA: an R package for weighted correlation network analysis. BMC Bioinf. 2008;9(1):559. doi:10.1186/1471-2105-9-559
28. Remmerie A, Martens L, Thone T, et al. Osteopontin Expression Identifies a Subset of Recruited Macrophages Distinct from Kupffer Cells in the Fatty Liver. Immunity. 2020;53(3):641–57e14. doi:10.1016/j.immuni.2020.08.004
29. Hu C, Li T, Xu Y, et al. CellMarker 2.0: an updated database of manually curated cell markers in human/mouse and web tools based on scRNA-seq data. Nucleic Acids Res. 2023;51(D1):D870–D6. doi:10.1093/nar/gkac947
30. McGinnis CS, Murrow LM, Gartner ZJ. DoubletFinder: doublet Detection in Single-Cell RNA Sequencing Data Using Artificial Nearest Neighbors. Cell Syst. 2019;8(4):329–37e4. doi:10.1016/j.cels.2019.03.003
31. Korsunsky I, Millard N, Fan J, et al. Fast, sensitive and accurate integration of single-cell data with Harmony. Nat Methods. 2019;16(12):1289–1296. doi:10.1038/s41592-019-0619-0
32. Aibar S, Gonzalez-Blas CB, Moerman T, et al. SCENIC: single-cell regulatory network inference and clustering. Nat Methods. 2017;14(11):1083–1086. doi:10.1038/nmeth.4463
33. Jin S, Guerrero-Juarez CF, Zhang L, et al. Inference and analysis of cell-cell communication using CellChat. Nat Commun. 2021;12(1):1088. doi:10.1038/s41467-021-21246-9
34. Newman AM, Steen CB, Liu CL, et al. Determining cell type abundance and expression from bulk tissues with digital cytometry. Nat Biotechnol. 2019;37(7):773–782. doi:10.1038/s41587-019-0114-2
35. Takedatsu H, Mitsuyama K, Mochizuki S, et al. A new therapeutic approach using a schizophyllan-based drug delivery system for inflammatory bowel disease. Mol Ther. 2012;20(6):1234–1241. doi:10.1038/mt.2012.24
36. Shah YM, Ito S, Morimura K, et al. Hypoxia-inducible factor augments experimental colitis through an MIF-dependent inflammatory signaling cascade. Gastroenterology. 2008;134(7):2036–48,48e1–3. doi:10.1053/j.gastro.2008.03.009
37. de Jong YP, Abadia-Molina AC, Satoskar AR, et al. Development of chronic colitis is dependent on the cytokine MIF. Nat Immunol. 2001;2(11):1061–1066. doi:10.1038/ni720
38. Murakami H, Akbar SM, Matsui H, Onji M. Macrophage migration inhibitory factor in the sera and at the colonic mucosa in patients with ulcerative colitis: clinical implications and pathogenic significance. Eur J Clin Invest. 2001;31(4):337–343. doi:10.1046/j.1365-2362.2001.00796.x
39. Krzystek-Korpacka M, Neubauer K, Matusiewicz M. Clinical relevance of circulating midkine in ulcerative colitis. Clin Chem Lab Med. 2009;47(9):1085–1090. doi:10.1515/CCLM.2009.248
40. Ishiguro Y, Ohkawara T, Sakuraba H, et al. Macrophage migration inhibitory factor has a proinflammatory activity via the p38 pathway in glucocorticoid-resistant ulcerative colitis. Clin Immunol. 2006;120(3):335–341. doi:10.1016/j.clim.2006.05.010
41. Senhaji N, Serrano A, Badre W, et al. Association of inflammatory cytokine gene polymorphisms with inflammatory bowel disease in a Moroccan cohort. Genes Immun. 2016;17(1):60–65. doi:10.1038/gene.2015.52
42. Nohara H, Okayama N, Inoue N, et al. Association of the −173 G/C polymorphism of the macrophage migration inhibitory factor gene with ulcerative colitis. J Gastroenterol. 2004;39(3):242–246. doi:10.1007/s00535-003-1284-7
43. Du X, Li R, Song S, Ma L, Xue H. The Role of MIF-173G/C Gene Polymorphism in the Susceptibility of Autoimmune Diseases. Mediators Inflamm. 2020;2020:7825072. doi:10.1155/2020/7825072
44. Krzystek-Korpacka M, Gorska S, Diakowska D, et al. Midkine is up-regulated in both cancerous and inflamed bowel, reflecting lymph node metastasis in colorectal cancer and clinical activity of ulcerative colitis. Cytokine. 2017;89:68–75. doi:10.1016/j.cyto.2016.09.020
45. Yuki T, Ishihara S, Rumi MA, et al. Increased expression of midkine in the rat colon during healing of experimental colitis. Am J Physiol Gastrointest Liver Physiol. 2006;291(4):G735–43. doi:10.1152/ajpgi.00388.2005
46. Papa Gobbi R, De Francesco N, Bondar C, et al. A galectin-specific signature in the gut delineates Crohn’s disease and ulcerative colitis from other human inflammatory intestinal disorders. Biofactors. 2016;42(1):93–105. doi:10.1002/biof.1252
47. Shi F, Guo X, Jiang X, et al. Dysregulated Tim-3 expression and its correlation with imbalanced CD4 helper T cell function in ulcerative colitis. Clin Immunol. 2012;145(3):230–240. doi:10.1016/j.clim.2012.09.001
48. Xiong H, Xue G, Zhang Y, et al. Effect of exogenous galectin-9, a natural TIM-3 ligand, on the severity of TNBS- and DSS-induced colitis in mice. Int Immunopharmacol. 2023;115:109645. doi:10.1016/j.intimp.2022.109645
49. Robinson BS, Saeedi B, Arthur CM, et al. Galectin-9 Is a Novel Regulator of Epithelial Restitution. Am J Pathol. 2020;190(8):1657–1666. doi:10.1016/j.ajpath.2020.04.010
50. Sudhakar JN, Lu HH, Chiang HY, et al. Lumenal Galectin-9-Lamp2 interaction regulates lysosome and autophagy to prevent pathogenesis in the intestine and pancreas. Nat Commun. 2020;11(1):4286. doi:10.1038/s41467-020-18102-7
51. Wu C, Thalhamer T, Franca RF, et al. Galectin-9-CD44 interaction enhances stability and function of adaptive regulatory T cells. Immunity. 2014;41(2):270–282. doi:10.1016/j.immuni.2014.06.011
52. Cao L, Wang X, Liu X, et al. Tumor Necrosis Factor alpha-Dependent Lung Inflammation Promotes the Progression of Lung Adenocarcinoma Originating From Alveolar Type II Cells by Upregulating MIF-CD74. Lab Invest. 2023;103(3):100034. doi:10.1016/j.labinv.2022.100034
53. Shahid S, Pantakani M, Binder L, Fischer A, Pantakani K, Asif AR. Small Molecule BRD4 Inhibitors Apabetalone and JQ1 Rescues Endothelial Cells Dysfunction, Protects Monolayer Integrity and Reduces Midkine Expression. Molecules. 2022;27(21):7453. doi:10.3390/molecules27217453
54. Gando S, Nishihira J, Kobayashi S, Morimoto Y, Nanzaki S, Kemmotsu O. Macrophage migration inhibitory factor is a critical mediator of systemic inflammatory response syndrome. Intensive Care Med. 2001;27(7):1187–1193. doi:10.1007/s001340000818
55. Krzystek-Korpacka M, Diakowska D, Neubauer K, Gamian A. Circulating midkine in malignant and non-malignant colorectal diseases. Cytokine. 2013;64(1):158–164. doi:10.1016/j.cyto.2013.07.008
56. Tsvetkov P, Coy S, Petrova B, et al. Copper induces cell death by targeting lipoylated TCA cycle proteins. Science. 2022;375(6586):1254–1261. doi:10.1126/science.abf0529
57. Liu X, Nie L, Zhang Y, et al. Actin cytoskeleton vulnerability to disulfide stress mediates disulfidptosis. Nat Cell Biol. 2023;25(3):404–414. doi:10.1038/s41556-023-01091-2
58. Fu W, Wang J, Li T, et al. Persistent activation of TRPM4 triggers necrotic cell death characterized by sodium overload. Nat Chem Biol. 2025. doi:10.1038/s41589-025-01841-3
 © 2025 The Author(s). This work is published and licensed by Dove Medical Press Limited. The
full terms of this license are available at https://www.dovepress.com/terms
and incorporate the Creative Commons Attribution
- Non Commercial (unported, 4.0) License.
By accessing the work you hereby accept the Terms. Non-commercial uses of the work are permitted
without any further permission from Dove Medical Press Limited, provided the work is properly
attributed. For permission for commercial use of this work, please see paragraphs 4.2 and 5 of our Terms.
© 2025 The Author(s). This work is published and licensed by Dove Medical Press Limited. The
full terms of this license are available at https://www.dovepress.com/terms
and incorporate the Creative Commons Attribution
- Non Commercial (unported, 4.0) License.
By accessing the work you hereby accept the Terms. Non-commercial uses of the work are permitted
without any further permission from Dove Medical Press Limited, provided the work is properly
attributed. For permission for commercial use of this work, please see paragraphs 4.2 and 5 of our Terms.