Back to Journals » Drug Design, Development and Therapy » Volume 11
Cell and small animal models for phenotypic drug discovery
Authors Szabo M ![]() , Svensson Akusjärvi S
, Svensson Akusjärvi S ![]() , Saxena A, Liu J
, Saxena A, Liu J ![]() , Chandrasekar G, Kitambi SS
, Chandrasekar G, Kitambi SS
Received 5 December 2016
Accepted for publication 20 April 2017
Published 28 June 2017 Volume 2017:11 Pages 1957—1967
DOI https://doi.org/10.2147/DDDT.S129447
Checked for plagiarism Yes
Review by Single anonymous peer review
Peer reviewer comments 3
Editor who approved publication: Professor Frank Boeckler
Mihaly Szabo,1 Sara Svensson Akusjärvi,1 Ankur Saxena,1 Jianping Liu,2 Gayathri Chandrasekar,1 Satish S Kitambi1
1Department of Microbiology Tumor, and Cell Biology, 2Department of Biochemistry and Biophysics, Karolinska Institutet, Solna, Sweden
Abstract: The phenotype-based drug discovery (PDD) approach is re-emerging as an alternative platform for drug discovery. This review provides an overview of the various model systems and technical advances in imaging and image analyses that strengthen the PDD platform. In PDD screens, compounds of therapeutic value are identified based on the phenotypic perturbations produced irrespective of target(s) or mechanism of action. In this article, examples of phenotypic changes that can be detected and quantified with relative ease in a cell-based setup are discussed. In addition, a higher order of PDD screening setup using small animal models is also explored. As PDD screens integrate physiology and multiple signaling mechanisms during the screening process, the identified hits have higher biomedical applicability. Taken together, this review highlights the advantages gained by adopting a PDD approach in drug discovery. Such a PDD platform can complement target-based systems that are currently in practice to accelerate drug discovery.
Keywords: phenotype, screening, PDD, discovery, zebrafish, drug
Phenotype-based drug discovery
Phenotype-based drug discovery (PDD) is not a new approach in drug discovery; however, it has seen a recent re-emergence as an alternative platform of drug discovery. PDD was the preclinical strategy used to identify the first generations of drugs.1,2 Nonetheless, the recent advancement of molecular biology techniques and the completion of the human genome sequence allowed drug screening to be performed directly on target genes/proteins, thereby sidelining PDD from the mainstream drug discovery program.1 As the name implies, PDD evaluates observable phenotypic changes in a cell, a tissue or an entire organism. The phenotypical changes can then be used to identify small molecules and other modulators for a disease or disorder. Generally, the PDD approach takes the desired phenotype or a characteristic phenotype associated with a disease or disorder and uses an in vitro or in vivo model to conduct a screen (Figure 1). The overall goal is to identify a lead compound that rescues or ameliorates the disease phenotype without necessarily knowing the target or mechanism (Figure 1). Such screens have been successfully performed for identifying leads selectively killing cancer cells3 or alleviating various disorders.4–7 This approach allows new targets and signaling pathways to be identified3 and, most importantly, decreases false-positive hits. PDD screens also allow the possibility to identify cell type-specific features. A recent study using the PDD approach identified acquired a vulnerability of cancer cells to macropinocytosis.3 The entire PDD approach in this study was designed with the concept that oncogenic transformation results in the cell acquiring new characteristic features that may not necessarily be associated with its pathophysiology. When these characteristics are identified, they can be exploited in order to design a therapeutic approach that selectively targets that cell.3 As the entire cell/tissue or organism’s physiology is taken into account, various parameters, such as tissue cross talk, absorption, distribution, metabolism, elimination (ADME) parameters and micro- and macroenvironmental influences synergistically participate in the lead identification. Such an approach ensures that the identified hit is physiologically relevant, with a high potential for clinical translation. An example of this is seen with the identification of fexinidazole and SCYX-7158 for use against African trypanosomiassis.8,9 The PDD approach operates by assuming the presented problem (disease or disorder) as a whole and focuses on alleviating the condition without initially considering the target or mechanism of action. Therefore, new or multiple targets or mechanisms can be identified through this approach, making it highly desirable not only for new drug discovery but also for drug repurposing programs.4,5 Furthermore, the advancement in the screening models has ensured PDD as a serious approach in drug discovery. PDD programs involve endpoints of using simple cytotoxicity-based screens,3 coculture3 and organoids,10 to animal model11-based disease modeling, making it a very flexible and robust setup. Advances in imaging, analysis software and target deconvolution techniques offer a strong reason for selecting this approach in drug discovery programs. Disease-relevant assays can now be modeled using TALENs,6 CRISPR/Cas9,12 iPSC13 and organoid14 in vitro and in vivo, thus making this approach very effective. The availability of various cell-based models, organoids and small animal models with the advances made in imaging and computational technology makes the re-emergence of PDD a powerful approach in identifying leads with greater medical significance.
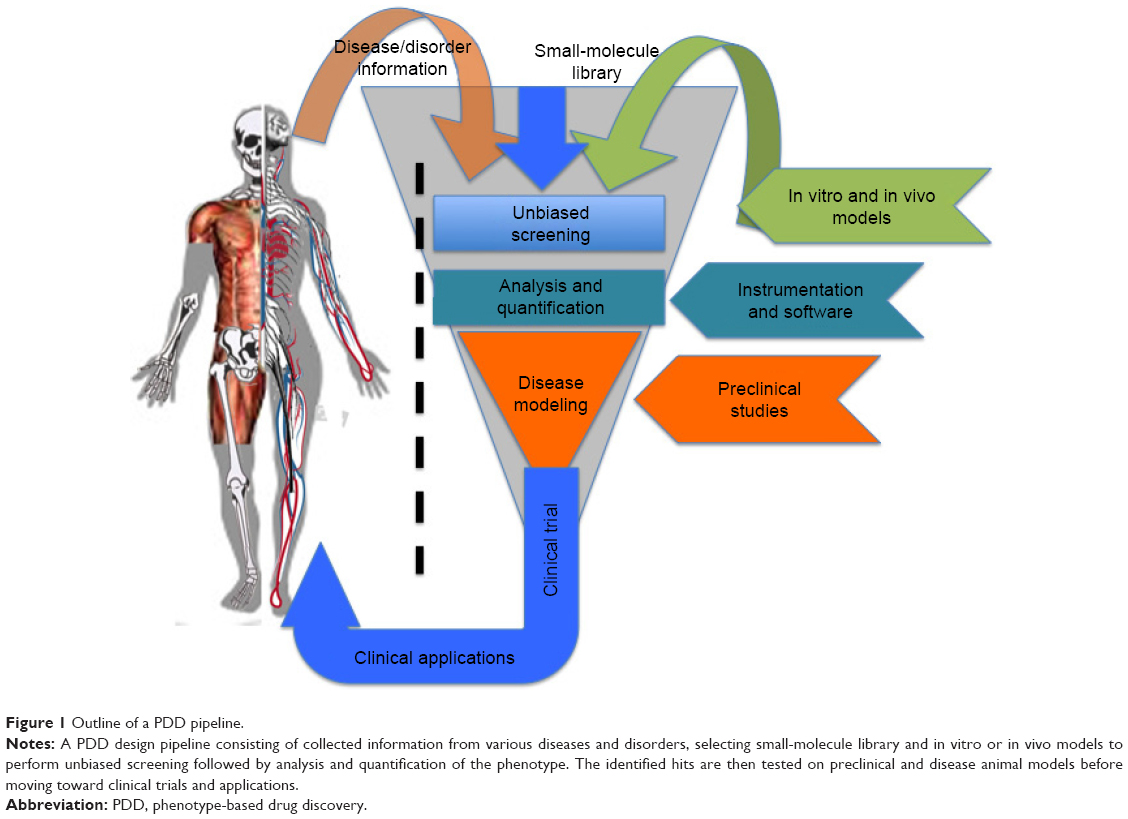 | Figure 1 Outline of a PDD pipeline. |
Limitations to PDD
One of the main drawbacks of PDD is that the relevant target(s) identification is relatively slow. This poses a serious limitation when a disease-rescuing or disease-modifying effect with a small molecule is observed. The success of a PDD screen depends on the relevance of the disease model employed in addition to the target deconvolution strategy. The robustness of the model dictates the scalability of the screening setup with weak or poorly defined phenotypes producing considerable numbers of false hits. The evaluation of the structure–activity relationship is often complicated by the physiological process such as metabolism and elimination in a cell- or animal-based PDD setup. However, various advances in genomics/proteomics, target identification and screen deconvolution strategies have been of assistance in revisiting PDD as a promising alternative for drug discovery.
Technical advances for PDD screening
Recent technical advances in microscopy, imaging, image analysis software, automation and array of in vitro and in vivo models have allowed the re-emergence of PDD as an effective platform for drug discovery. Fortunately, there are numerous methods such as flow cytometry,15,16 laser scanning fluorescence,17 microfluidics18 and electrophysiology methodologies19 readily available for conducting high-throughput PDD screening. A simple cell painting approach20 allows extensive morphological profiling, with over 1,500 morphological features to be extracted and analyzed, making it a very effective tool for developing a multiplexed PDD setup. Other software programs such as cellXpress,21 BIOCAT,22 ThunderSTORM23 and CellAnimation2 are examples of software that can be used for data visualization and analysis to discover or quantify cell-specific phenotypes. Various analysis software programs also provide a flexibility to set up a tailor-made analysis script (Supplementary material) for quantifying one specific feature of cell behavior, such as migration. The analysis of cell migration is not always straightforward and can generate noise. Programming scripts can be written to detect simple single-cell migration from point A to point B (Supplementary material and Figure 2A–D) or cytoplasmic extensions during migration (Figure 2E–H) or morphological changes during cell extension (Figure 2I–L). All these observations can easily be quantified in terms of distance moved or morphological changes produced in the entire cell or its nucleus during motion (Figure 2M). Such image-based quantification can also be conducted in a three-dimensional (3D) culture setup aiding in identification and statistical quantification of unique morphological changes associated with the phenotype or upon compound administration.1,24
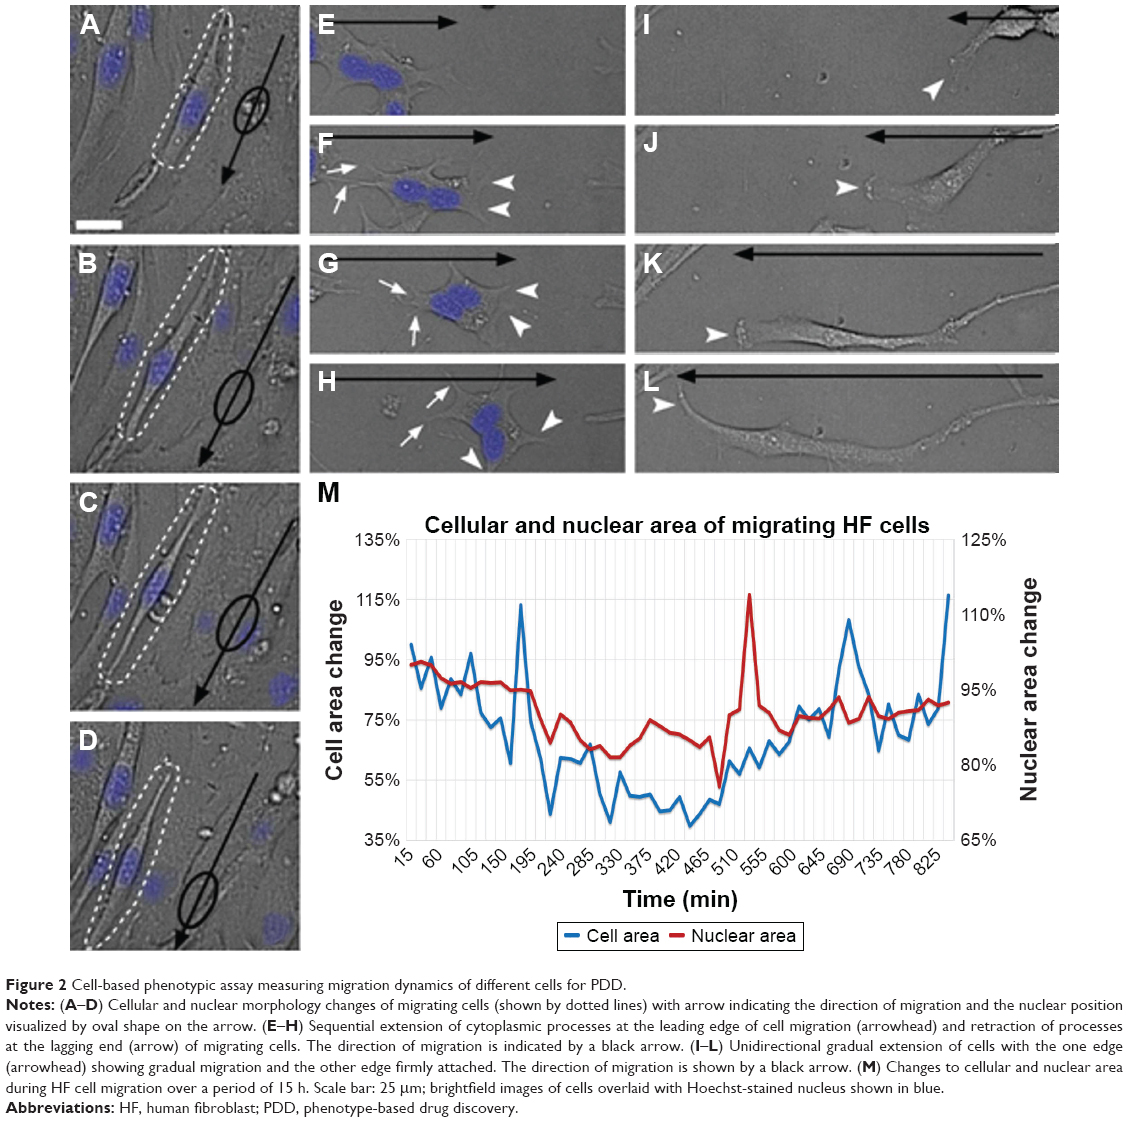 | Figure 2 Cell-based phenotypic assay measuring migration dynamics of different cells for PDD. |
The rise of organoids and small animal models for PDD setup has given way to technological advancement in the field of imaging and image analysis. An example of this is the development of light sheet microscopy25,26 and optical emission computed tomography (optical-ECT)27 that allow rapid 3D imaging of live or fixed tissue. A combination of such imaging systems with protocols for tissue clearance has been useful in deep tissue imaging in live and fixed animal models.25,26,28 Such an approach also ensures 3D visualization for rapid reconstruction and analysis of tissues, thereby providing detailed information into the pathophysiology and disease progression.27–29 In PDD studies using animal xenograft models, optical-ECT and light sheet microscopy have allowed deep tissue imaging of tumor progression along with the analysis of microvasculature and necrosis studies.29,30 Image analysis software for such in vivo throughput setup has also undergone rapid advances, allowing the quantification of endpoints ranging from ex vivo analysis,31 single-cell behavior in vivo32,33 to behavior of an entire organism.34,35 Much of the available analysis software is open source and is designed to create tailor-made scripts that accommodate new and innovative PDD endpoint assay development and analysis. Therefore, much of this open-source software36 can be modified to suit our PDD assay needs. One interesting use of this software could be the quantification of intricate features such as cell area and nuclear area (Figure 3) that can be quantified by recording external (Figure 3A–H) or internal (Figure 3I–P) morphological changes at one time point (Figure 3Q) or over a period of time (Figure 3R–S). These advances in hardware and software tools offer considerable support for PDD screening.
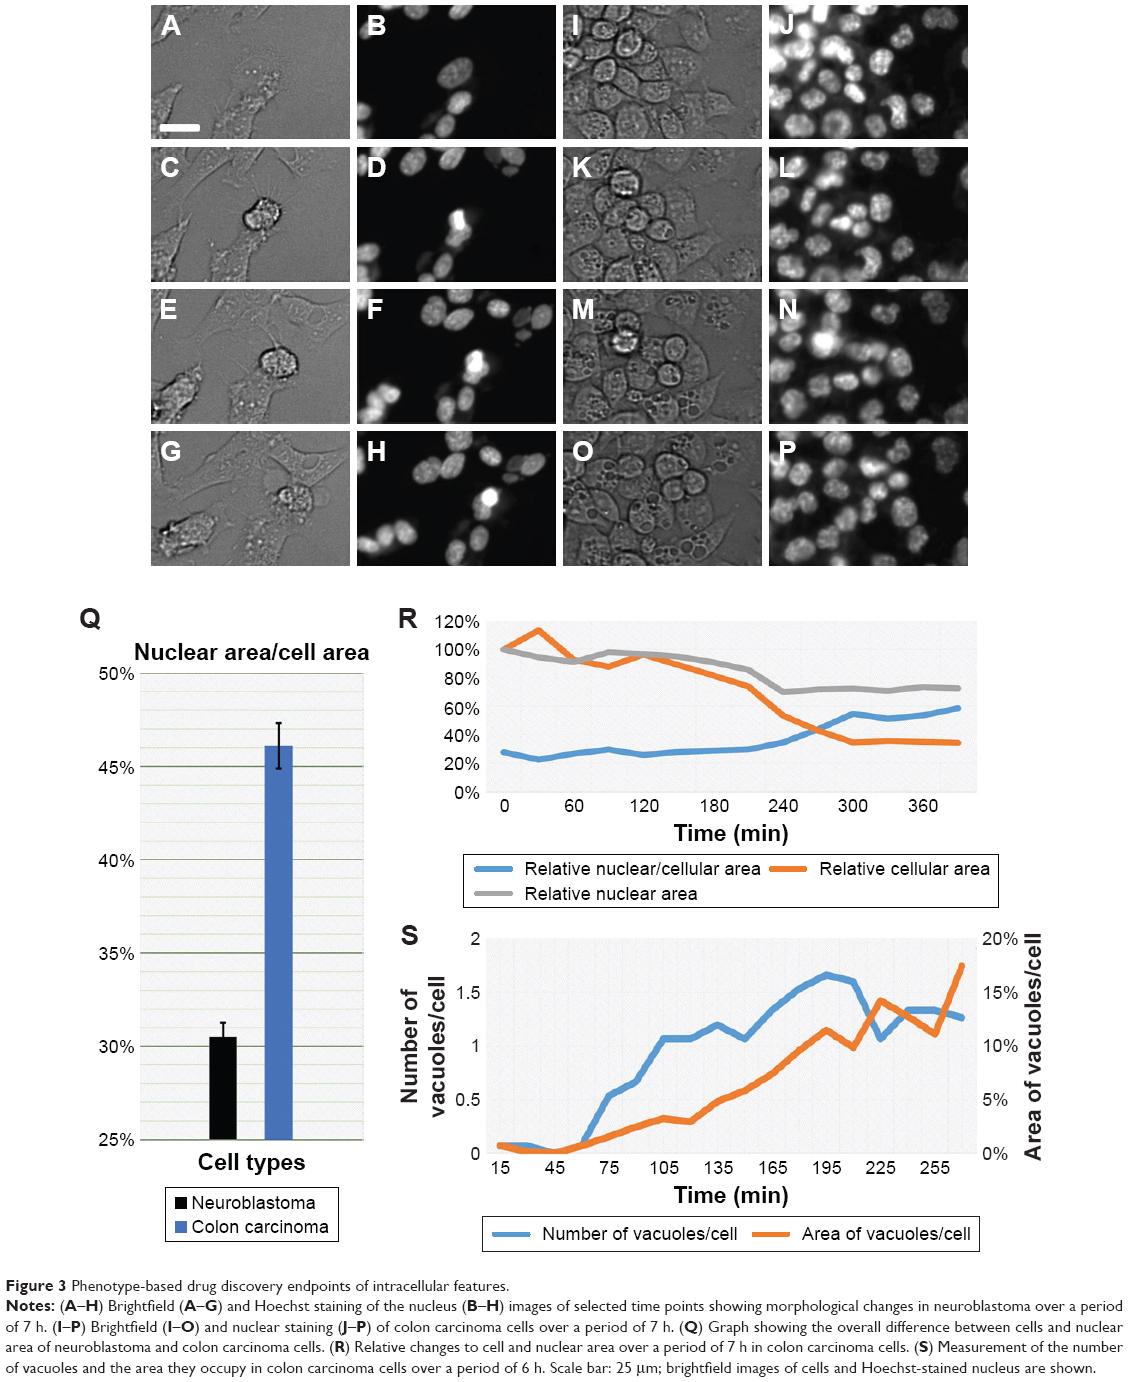 | Figure 3 Phenotype-based drug discovery endpoints of intracellular features. |
Cell-based models for PDD
Cell-based screening has been a frequently adopted approach for PDD screens as it allows for the rapid testing of a large number of compounds. Early PDD programs were straightforward cell-based screens, for example, cell cytotoxicity or colorimetric screen, for the selective killing or inhibition of proliferation of cancer cells.37–39 The development of different culturing conditions for various cell types allows PDD screening to be performed on cell line panels, making it feasible to identify small molecules with selectivity toward one cell type to another and develop early assay algorithms such as COMPARE based on the recorded activity.40,41 The recent boost to cell-based PDD setup came from the development of instrumentation and analysis algorithms. These developments made it possible to look at simple cell morphology (Figure 4A) or intricate details such as metaphase plate (Figure 4B) and cells in anaphase (Figure 4C) to study various aspects of cell division. It also enables the performance of time-lapse analysis of cell migration (Figure 4D), stimulus-driven intricate cellular responses such as ruffling (Figure 4E), macropinocytosis (Figure 4F), exocytosis (Figure 4G), cell retraction (Figure 4H), necrosis (Figure 4I), cytoplasmic extension (Figure 4J), blebbing (Figure 4K) or accumulation of lipid droplets (Figure 4L). Such a morphology-based screening approach resulted in identifying glioblastoma cell-specific intricate features such as micropinocytosis.3 Glioblastoma multiforme tumor-derived cell-based PDD assay identified the cells’ vulnerability to macropinocytosis, thereby paving the way toward the development of a new class of therapeutic compounds, Vacquinols.3
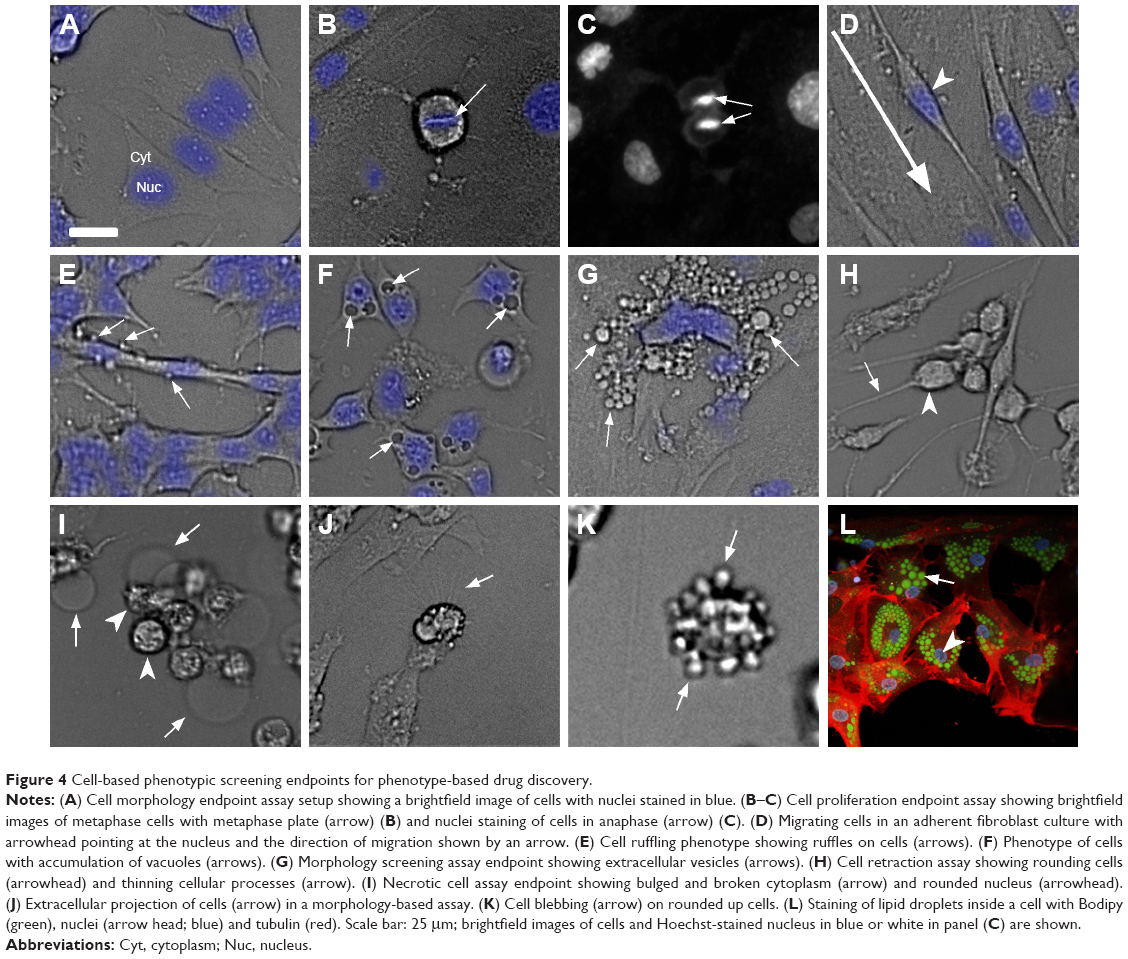 | Figure 4 Cell-based phenotypic screening endpoints for phenotype-based drug discovery. |
In addition to the cell-based approach, the development of organoid models that represent a rudimentary organ has further boosted the PDD screening approach. Organoid models for the cerebral cortex, intestine, optic cup, pituitary gland, kidney, liver, pancreas, neural tube, stomach, prostrate, breast, heart and lung allow for organ-specific disease modeling for PDD.42–50 Organoid models introduce sophistication in the PDD screening setup, whereby multiple parameters such as developmental signaling processes, physiological and functional activity and tissue-specific unique target can be identified.
Small animal models for PDD
In vivo evaluation is a key component in the entire pipeline for drug discovery, implying that small animal model-based evaluation offers a very convenient setup to perform PDD. Testing in an in vivo system contributes to the evaluation of multiple signaling mechanisms and tissue cross talk that is not available with cell-based system. This is still the only available platform for safety and efficacy studies with a higher chance of biomedical applicability to human use. A small molecule identified in an in vivo system has a higher chance of having bioactivity and clinical relevance. Using an in vivo PDD platform offers the evaluation of compounds in a physiological context, that is, examining its effect on the entire animal model in addition to its effect on target cell/organ/tissue becomes feasible. Valuable information such as dose-specific efficacy and compound toxicity can be obtained with precision and accuracy through this approach, aiding in selecting a good lead compound. Additionally, this method offers the possibility of standardizing the time window of application, that is, evaluation of multitude of endpoints that cannot be assessed otherwise. A variety of animal models are available for PDD, as simple as Saccharomyces cerevisiae51 or Dictyostelium discoideum,52 invertebrates such as Artemia salina,53 Drosophila melanogaster (fly)54 and Caenorhabditis elegans (worms),55 lower vertebrates such as Danio rerio (zebrafish) and Oryzias latipes (medaka fish),11,56 Xenopus leavis,57 Gallus gallus,58 to mammalian models such as Tupaia belangeri,59 Mus musculus and Rattus norvegicus that have varying degrees of similarity to human beings and bring their own advantages to drug development. The order in which all these models are mentioned represents the order of increase in complexity and decrease in throughput. The availability of the whole-genome sequence,60 along with a variety of omics studies and genetic engineering tools such as CRISPR/Cas-961 on these models, provides a variety of tools that can be used to refine and enrich PDD development. Such tools not only allow for modeling various disease-associated genes and gene mutation(s) but also define various endpoints in a PDD assay. Establishing endpoints such as host pathogen interaction/infection, central nervous system (CNS) disorders such as epilepsy, onset of behavior disorder and aging can contribute to the development of powerful assays for PDD-based drug discovery. The availability of a variety of small animal models provides significant advantages in choosing the most appropriate model to study a specific biological process, disease pathology, developmental defects or disorders for conducting PDD. Although the throughput decreases when an in vivo system is applied in PDD, a clear advantage in clinical relevance is achieved.
Small invertebrates
Small invertebrates such as flies and worms, with their ease of handling and lower order of complexity, have become ideal for high-throughput PDD screens. Given its small size (~1 mm), with 65% of human disease-associated genes having C. elegans orthologs, various genetics and PDD screening platforms have been developed for modeling cancer, diabetes, CNS disorders and microbial infection62–65 and identified various leads66–68 with relevance to human diseases. Fly models demonstrate a slightly higher degree of complexity than worms.54 They are also small in size (~2 mm), have over 70% human disease-associated gene orthologs with highly conserved cellular and physiological processes allowing the modeling of various disorders of CNS, cardiac and metabolic conditions, including cancer.54,69,70 Various PDD screens using this model have identified leads for disorders of CNS, metabolism and cancer.54,69,70 The availability of genetic and biochemical tools allows cell-, tissue- or organ-specific PDD to be developed with these models with relative ease. Both the models have a variety of wild-type and genetically engineered strains available, allowing for the potential development of mutant panel-based PDD.
Chicken model
Chickens serve as a very good juvenile and perinatal animal model for PDD. Their low cost, self-contained and rapid development, relatively large size and availability of large number of techniques are all features offered by this model. Although this model may not be the first choice for conducting high-throughput screens, the use of this model in medium- to low-throughput screens has been performed in order to understand the function of various amino acids and metabolites.58,71,72 Various behavior PDD endpoints, especially in the area of stress-related disorders such as insomnia and other sleeping disorders, depression and hyperactive behavior, have previously been carried out.71,72 A practical advantage can be gained in the PDD setup because chickens require a small quantity of drugs. A well-understood behavior regimen in this model has allowed its use in PDD programs to identify sedatives, hypnotics and excitatory molecules.73
Xenopus model
Xenopus models have been widely used in embryology, teratology and toxicology field.74 A number of phenotype-based assays such as Frog Embryo Teratogenesis Assay Xenopus (FETAX) assay74 have been carried out in order to assess the effect of small molecules on early development. This model is the only tetrapod vertebrate without in utero or in ovo development allowing PDD to be carried out on them. Various medium- to low-throughput PDD screens have been carried out using this model in order to identify small molecules affecting melanocyte development and migration,75 angiogenesis and lymph angiogenesis.76 Indeed, this model, with its relatively small size oocyte, and well-evolved genetic and biochemical tools could prove valuable in setting up a good platform to perform PDD screens and investigate the target and underlying mechanistic action.
Rodent models
Rodents are mammalian models that have greatly established themselves as the mainstream model for preclinical evaluation. The relative ease with which they can be handled, along with molecular and genetic tools that are available, allows for a thorough investigation of lead molecules. The same features also make them an ideal candidate for conducting PDD screens. The development of “humanized” mice models has offered more confidence into drug toxicity and safety assessment studies before clinical translation.77,78 Rodent models have been highly sought-after for PDD using behavior assessment. Various PDD assays such as the elevated plus maze,79 light/dark box80 and four-plate test81 have proven to be highly beneficial in the discovery and assessment of many lead molecules for anxiety and other mood disorders.81 Humanized mouse xenograft models such as XactMice82 have overcome the limitation posed by cell culture or mouse xenograft models and allowed the modeling and examining of the cross talk between the human immune system and the tumor microenvironment, paving the way to test various human cancer immunotherapies. Although rodent models offer enormous advantages over other models in lead identification and evaluation, performing high-throughput PDD is costly and cumbersome.
Teleost models
Teleost models, such as zebrafish and medaka, have attracted a great deal of attention in recent years in drug screening. Among them zebrafish is carving a unique niche as the vertebrate model for PDD, as phenotype scoring can be performed with great ease because of rapid external development and optical transparency of the embryos. PDD screens performed on zebrafish have led to the identification of a number of lead compounds of therapeutic potential, for example, identification of a novel compound having a retinal vasculature specific effect,11 or larval susceptibility to infection with vibrio vulnificus,83 or notochord lesions.84 In addition, various behavior screens have identified antipsychotic-like compounds or compounds suppressing long QT syndrome.85,86 Zebrafish has also been used as a successful xenograft PDD model to evaluate various anticancer compounds,3 in neurogenesis87 and CNS defects, leading toward identification of leads with high biomedical relevance. In addition to being a vertebrate model, zebrafish (and medaka) offer the development of various endpoint PDD assays. Its rapid external development allows the ease of standardizing the time window of compound exposure and phenotype scoring. Various precision PDD screens looking at developmental defects (Figure 5A), cancer cells’ xenograft survival (Figure 5B) or the development of brain ventricles (Figure 5C), lipid consumption and edema formation (Figure 5D and E), vasculature and cancer cell proliferation and migration (Figure 5F) can be developed with relative ease to be used in a low- to medium-throughput PDD setup. One important reason for zebrafish being favored as an animal model to carry out PDD is that it has >75% of human disease-associated orthologs with various tissue and organ similarity to that of humans. There is a very high correlation between the pharmacological effects seen in humans with this model including in areas of infectious disease, cancer, CNS, cardiovascular and various metabolic conditions.88,89 The availability of a large collection of various disease gene mutant strains; advanced molecular, biochemical and genetic tools in addition to its small size (1–5 mm); rapid external and early transparent development; and the possibility to obtain large quantities of embryos makes this model an ideal PDD screening platform. Several PDD screens based on morphology,90–92 disease phenotype rescue,85,93–95 infection,96 antitoxin resistance and behavior86,97 demonstrate the versatility of this model to be used in therapeutic programs to discover small molecules with the potential to be translated to clinics.
 | Figure 5 Phenotype-based drug discovery endpoints for zebrafish-based screening. |
Conclusion and future direction
PDD offers an unbiased evaluation setup in the process of drug discovery. It lacks prior knowledge of the target, allowing opportunities for the identification of new target(s) and pathways of therapeutic importance. In addition to providing an approximate solution to a problem that cannot be solved precisely, PDD screening also allows engagements of multiple targets and physiological mechanism that synergistically participate, resulting in the phenotype. This results in a higher possibility for biomedical translation and clinical applicability. The recent advances in imaging system(s), automated screening and endpoint quantification programs allow us to identify and document precise patterns of morphological perturbations. Moreover, identification of similarities and differences in these patterns allows us to characterize compounds and diseases/phenotypes. These technical advances reinforce PDD as a powerful setup for drug discovery. Various in vitro and in vivo models offer the possibility to model disease phenotypes and conduct therapeutic screens in large numbers to alleviate that condition and accelerate drug discovery. The emergence of a coculture system, organoids and organotypic culture system offers a robust setup to carry out PDD screening. Taken together, PDD screens greatly contribute to allowing us to create tailor-made assays to identify drugs for our unmet medical needs.
Acknowledgments
The authors thank CLICK imaging facility supported by Wallenberg Foundation. SSK would like to thank Lillian Sagens och Curt Ericssons Forskningsstiftelse and Vetenskapsrådet for funding.
Disclosure
The authors report no conflicts of interest in this work.
References
Swinney DC, Anthony J. How were new medicines discovered? Nat Rev Drug Discov. 2011;10(7):507–519. | ||
Georgescu W, Wikswo JP, Quaranta V. CellAnimation: an open source MATLAB framework for microscopy assays. Bioinformatics. 2012;28(1):138–139. | ||
Hammarström LGJ, Harmel RK, Granath M, et al. The Oncolytic Efficacy and in Vivo Pharmacokinetics of [2-(4-Chlorophenyl)quinolin-4-yl](piperidine-2-yl)methanol (Vacquinol-1) Are Governed by Distinct Stereochemical Features. J Med Chem. 2016;59(18):8577–8592. Epub 2016 Sep 8. | ||
Xu M, Liu K, Swaroop M, et al. delta-Tocopherol reduces lipid accumulation in Niemann-Pick type C1 and Wolman cholesterol storage disorders. J Biol Chem. 2012;287(47):39349–39360. | ||
Xu M, Lee EM, Wen Z, et al. Identification of small-molecule inhibitors of Zika virus infection and induced neural cell death via a drug repurposing screen. Nat Med. 2016;22(10):1101–1107. | ||
Chen W, Liu J, Zhang L, et al. Generation of the SCN1A epilepsy mutation in hiPS cells using the TALEN technique. Sci Rep. 2014;4:5404. | ||
Chen CZ, Southall N, Galkin A, et al. A homogenous luminescence assay reveals novel inhibitors for giardia lamblia carbamate kinase. Curr Chem Genomics. 2012;6:93–102. | ||
Torreele E, Bourdin Trunz B, Tweats D, et al. Fexinidazole – a new oral nitroimidazole drug candidate entering clinical development for the treatment of sleeping sickness. PLoS Negl Trop Dis. 2010;4(12):e923. | ||
Jacobs RT, Nare B, Wring SA, et al. SCYX-7158, an orally-active benzoxaborole for the treatment of stage 2 human African trypanosomiasis. PLoS Negl Trop Dis. 2011;5(6):e1151. | ||
Zhao J, Zeng Z, Sun J, et al. A novel model of P-glycoprotein inhibitor screening using human small intestinal organoids. Basic Clin Pharmacol Toxicol. 2017;120(3):250–255. | ||
Kitambi SS, McCulloch KJ, Peterson RT, Malicki JJ. Small molecule screen for compounds that affect vascular development in the zebrafish retina. Mech Dev. 2009;126(5–6):464–477. | ||
Deans RM, Morgens DW, Okesli A, et al. Parallel shRNA and CRISPR-Cas9 screens enable antiviral drug target identification. Nat Chem Biol. 2016;12(5):361–366. | ||
Choi SM, Kim Y, Shim JS, et al. Efficient drug screening and gene correction for treating liver disease using patient-specific stem cells. Hepatology. 2013;57(6):2458–2468. | ||
Skardal A, Shupe T, Atala A. Organoid-on-a-chip and body-on-a-chip systems for drug screening and disease modeling. Drug Discov Today. 2016;21(9):1399–1411. | ||
Szollosi J, Vereb G, Nagy P. The flow of events: how the sequence of molecular interactions is seen by the latest, user-friendly high throughput flow cytometric FRET. Cytometry A. 2016;89(10):881–885. | ||
Dhoble AS, Bekal S, Dolatowski W, Yanz C, Lambert KN, Bhalerao KD. A novel high-throughput multi-parameter flow cytometry based method for monitoring and rapid characterization of microbiome dynamics in anaerobic systems. Bioresour Technol. 2016;220:566–571. | ||
Wylie PG, Onley DJ, Hammerstein AF, Bowen WP. Advances in laser scanning imaging cytometry for high-content screening. Assay Drug Dev Technol. 2015;13(2):66–78. | ||
Upadhyaya S, Selvaganapathy PR. Microfluidic devices for cell based high throughput screening. Lab Chip. 2010;10(3):341–348. | ||
Kirsch GE, Fedorov NB, Kuryshev YA, Liu Z, Armstrong LC, Orr MS. Electrophysiology-based assays to detect subtype-selective modulation of human nicotinic acetylcholine receptors. Assay Drug Dev Technol. 2016;14(6):333–344. | ||
Bray MA, Singh S, Han H, et al. Cell Painting, a high-content image-based assay for morphological profiling using multiplexed fluorescent dyes. Nat Protoc. 2016;11(9):1757–1774. | ||
Laksameethanasan D, Tan R, Toh G, Loo LH. cellXpress: a fast and user-friendly software platform for profiling cellular phenotypes. BMC Bioinformatics. 2013;14(Suppl 16):S4. | ||
Zhou J, Lamichhane S, Sterne G, Ye B, Peng H. BIOCAT: a pattern recognition platform for customizable biological image classification and annotation. BMC Bioinformatics. 2013;14:291. | ||
Ovesny M, Krizek P, Borkovec J, Svindrych Z, Hagen GM. ThunderSTORM: a comprehensive ImageJ plug-in for PALM and STORM data analysis and super-resolution imaging. Bioinformatics. 2014;30(16):2389–2390. | ||
Kriston-Vizi J, Flotow H. Getting the whole picture: High content screening using three-dimensional cellular model systems and whole animal assays. Cytometry A. 2017;91(2):152–159. | ||
Becker K, Jahrling N, Saghafi S, Weiler R, Dodt HU. Chemical clearing and dehydration of GFP expressing mouse brains. PLoS One. 2012;7(3):e33916. | ||
Becker K, Jahrling N, Saghafi S, Dodt HU. Ultramicroscopy: light-sheet-based microscopy for imaging centimeter-sized objects with micrometer resolution. Cold Spring Harb Protoc. 2013;2013(8):704–713. | ||
Oldham M, Sakhalkar H, Oliver T, et al. Three-dimensional imaging of xenograft tumors using optical computed and emission tomography. Med Phys. 2006;33(9):3193–3202. | ||
Kolesova H, Capek M, Radochova B, Janacek J, Sedmera D. Comparison of different tissue clearing methods and 3D imaging techniques for visualization of GFP-expressing mouse embryos and embryonic hearts. Histochem Cell Biol. 2016;146(2):141–152. | ||
Bibby MC. Orthotopic models of cancer for preclinical drug evaluation: advantages and disadvantages. Eur J Cancer. 2004;40(6):852–857. | ||
Sakhalkar HS, Dewhirst M, Oliver T, Cao Y, Oldham M. Functional imaging in bulk tissue specimens using optical emission tomography: fluorescence preservation during optical clearing. Phys Med Biol. 2007;52(8):2035. | ||
Kitambi SS, Nilsson ES, Sekyrova P, et al. Small molecule screening platform for assessment of cardiovascular toxicity on adult zebrafish heart. BMC Physiol. 2012;12:3. | ||
Wait E, Winter M, Bjornsson C, et al. Visualization and correction of automated segmentation, tracking and lineaging from 5-D stem cell image sequences. BMC Bioinformatics. 2014;15:328. | ||
Chiang M, Hallman S, Cinquin A, et al. Analysis of in vivo single cell behavior by high throughput, human-in-the-loop segmentation of three-dimensional images. BMC Bioinformatics. 2015;16:397. | ||
Nema S, Hasan W, Bhargava A, Bhargava Y. A novel method for automated tracking and quantification of adult zebrafish behaviour during anxiety. J Neurosci Methods. 2016;271:65–75. | ||
Conklin EE, Lee KL, Schlabach SA, Woods IG. VideoHacking: automated tracking and quantification of locomotor behavior with open source software and off-the-shelf video equipment. J Undergrad Neurosci Educ. 2015;13(3):A120–A125. | ||
Schneider CA, Rasband WS, Eliceiri KW. NIH Image to ImageJ: 25 years of image analysis. Nat Methods. 2012;9(7):671–675. | ||
Skehan P, Storeng R, Scudiero D, et al. New colorimetric cytotoxicity assay for anticancer-drug screening. J Natl Cancer Inst. 1990;82(13):1107–1112. | ||
Gilman A, Philips FS. The biological actions and therapeutic applications of the B-chloroethyl amines and sulfides. Science. 1946;103(2675):409–436. | ||
Farber S, Diamond LK. Temporary remissions in acute leukemia in children produced by folic acid antagonist, 4-aminopteroyl-glutamic acid. N Engl J Med. 1948;238(23):787–793. | ||
Paull KD, Shoemaker RH, Hodes L, et al. Display and analysis of patterns of differential activity of drugs against human tumor cell lines: development of mean graph and COMPARE algorithm. J Natl Cancer Inst. 1989;81(14):1088–1092. | ||
Monks A, Scudiero D, Skehan P, et al. Feasibility of a high-flux anticancer drug screen using a diverse panel of cultured human tumor cell lines. J Natl Cancer Inst. 1991;83(11):757–766. | ||
van de Wetering M, Francies HE, Francis JM, et al. Prospective derivation of a living organoid biobank of colorectal cancer patients. Cell. 2015;161(4):933–945. | ||
Takebe T, Sekine K, Enomura M, et al. Vascularized and functional human liver from an iPSC-derived organ bud transplant. Nature. 2013;499(7459):481–484. | ||
Takasato M, Er PX, Becroft M, et al. Directing human embryonic stem cell differentiation towards a renal lineage generates a self-organizing kidney. Nat Cell Biol. 2014;16(1):118–126. | ||
Suga H, Kadoshima T, Minaguchi M, et al. Self-formation of functional adenohypophysis in three-dimensional culture. Nature. 2011;480(7375):57–62. | ||
Spence JR, Mayhew CN, Rankin SA, et al. Directed differentiation of human pluripotent stem cells into intestinal tissue in vitro. Nature. 2011;470(7332):105–109. | ||
Sato T, Vries RG, Snippert HJ, et al. Single Lgr5 stem cells build crypt-villus structures in vitro without a mesenchymal niche. Nature. 2009;459(7244):262–265. | ||
McCracken KW, Cata EM, Crawford CM, et al. Modelling human development and disease in pluripotent stem-cell-derived gastric organoids. Nature. 2014;516(7531):400–404. | ||
Eiraku M, Watanabe K, Matsuo-Takasaki M, et al. Self-organized formation of polarized cortical tissues from ESCs and its active manipulation by extrinsic signals. Cell Stem Cell. 2008;3(5):519–532. | ||
Boj SF, Hwang CI, Baker LA, et al. Organoid models of human and mouse ductal pancreatic cancer. Cell. 2015;160(1–2):324–338. | ||
Costanzo MC, Crawford ME, Hirschman JE, et al. YPD, PombePD and WormPD: model organism volumes of the BioKnowledge library, an integrated resource for protein information. Nucleic Acids Res. 2001;29(1):75–79. | ||
Williams JG. Dictyostelium finds new roles to model. Genetics. 2010;185(3):717–726. | ||
Harwig J, Scott PM. Brine shrimp (Artemia salina L.) larvae as a screening system for fungal toxins. Appl Microbiol. 1971;21(6):1011–1016. | ||
Pandey UB, Nichols CD. Human disease models in Drosophila melanogaster and the role of the fly in therapeutic drug discovery. Pharmacol Rev. 2011;63(2):411–436. | ||
Kong C, Yehye WA, Abd Rahman N, Tan MW, Nathan S. Discovery of potential anti-infectives against Staphylococcus aureus using a Caenorhabditis elegans infection model. BMC Complement Altern Med. 2014;14:4. | ||
Kitambi SS, Malicki JJ. Spatiotemporal features of neurogenesis in the retina of medaka, Oryzias latipes. Dev Dyn. 2008;237(12):3870–3881. | ||
Schmitt SM, Gull M, Brandli AW. Engineering Xenopus embryos for phenotypic drug discovery screening. Adv Drug Deliv Rev. 2014;69–70:225–246. | ||
Feltenstein MW, Lambdin LC, Ganzera M, et al. Anxiolytic properties of Piper methysticum extract samples and fractions in the chick social-separation-stress procedure. Phytother Res. 2003;17(3):210–216. | ||
Tsukiyama-Kohara K, Kohara M. Tupaia belangeri as an experimental animal model for viral infection. Exp Anim. 2014;63(4):367–374. | ||
Ekblom R, Wolf JB. A field guide to whole-genome sequencing, assembly and annotation. Evol Appl. 2014;7(9):1026–1042. | ||
Dow LE. Modeling Disease In Vivo With CRISPR/Cas9. Trends Mol Med. 2015;21(10):609–621. | ||
Anastassopoulou CG, Fuchs BB, Mylonakis E. Caenorhabditis elegans-based model systems for antifungal drug discovery. Curr Pharm Des. 2011;17(13):1225–1233. | ||
Harrington AJ, Hamamichi S, Caldwell GA, Caldwell KA. C. elegans as a model organism to investigate molecular pathways involved with Parkinson’s disease. Dev Dyn. 2010;239(5):1282–1295. | ||
Kwok TC, Ricker N, Fraser R, et al. A small-molecule screen in C. elegans yields a new calcium channel antagonist. Nature. 2006;441(7089):91–95. | ||
O’Reilly LP, Luke CJ, Perlmutter DH, Silverman GA, Pak SC. C. elegans in high-throughput drug discovery. Adv Drug Deliv Rev. 2014;69–70:247–253. | ||
Durai S, Vigneshwari L, Balamurugan K. Caenorhabditis elegans-based in vivo screening of bioactives from marine sponge-associated bacteria against Vibrio alginolyticus. J Appl Microbiol. 2013;115(6):1329–1342. | ||
Gosai SJ, Kwak JH, Luke CJ, et al. Automated high-content live animal drug screening using C. elegans expressing the aggregation prone serpin alpha1-antitrypsin Z. PLoS One. 2010;5(11):e15460. | ||
Liu J, Hafting J, Critchley AT, Banskota AH, Prithiviraj B. Components of the cultivated red seaweed Chondrus crispus enhance the immune response of Caenorhabditis elegans to Pseudomonas aeruginosa through the pmk-1, daf-2/daf-16, and skn-1 pathways. Appl Environ Microbiol. 2013;79(23):7343–7350. | ||
Apidianakis Y, Rahme LG. Drosophila melanogaster as a model for human intestinal infection and pathology. Dis Model Mech. 2011;4(1):21–30. | ||
Chung IY, Sim N, Cho YH. Antibacterial efficacy of temperate phage-mediated inhibition of bacterial group motilities. Antimicrob Agents Chemother. 2012;56(11):5612–5617. | ||
Feltenstein MW, Warnick JE, Guth AN, Sufka KJ. The chick separation stress paradigm: a validation study. Pharmacol Biochem Behav. 2004;77(2):221–226. | ||
Furuse M, Yamane H, Tomonaga S, Tsuneyoshi Y, Denbow DM. Neuropeptidergic regulation of food intake in the neonatal chick: a review. J Poult Sci. 2007;44(4):349–356. | ||
Asechi M, Kurauchi I, Tomonaga S, et al. Relationships between the sedative and hypnotic effects of intracerebroventricular administration of L-serine and its metabolites, pyruvate and the derivative amino acids contents in the neonatal chicks under acute stressful conditions. Amino Acids. 2008;34(1):55–60. | ||
Pratt KG, Khakhalin AS. Modeling human neurodevelopmental disorders in the Xenopus tadpole: from mechanisms to therapeutic targets. Dis Model Mech. 2013;6(5):1057–1065. | ||
Tomlinson ML, Rejzek M, Fidock M, Field RA, Wheeler GN. Chemical genomics identifies compounds affecting Xenopus laevis pigment cell development. Mol Biosyst. 2009;5(4):376–384. | ||
Kalin RE, Banziger-Tobler NE, Detmar M, Brandli AW. An in vivo chemical library screen in Xenopus tadpoles reveals novel pathways involved in angiogenesis and lymphangiogenesis. Blood. 2009;114(5):1110–1122. | ||
Morton JJ, Bird G, Refaeli Y, Jimeno A. Humanized mouse xenograft models: narrowing the tumor-microenvironment gap. Cancer Res. 2016. | ||
Good MF, Hawkes MT, Yanow SK. Humanized mouse models to study cell-mediated immune responses to liver-stage malaria vaccines. Trends Parasitol. 2015;31(11):583–594. | ||
Lister RG. The use of a plus-maze to measure anxiety in the mouse. Psychopharmacology (Berl). 1987;92(2):180–185. | ||
Bourin M, Hascoet M. The mouse light/dark box test. Eur J Pharmacol. 2003;463(1–3):55–65. | ||
Hascoet M BM. The four-plate test in mice. In: TD G, editor. Mood and Anxiety Related Phenotypes in Mice. Characterization Using Behavioral Tests. Vol. 2. New York, NY: Humana Press; 2011:123–141. | ||
Morton JJ, Bird G, Keysar SB, et al. XactMice: humanizing mouse bone marrow enables microenvironment reconstitution in a patient-derived xenograft model of head and neck cancer. Oncogene. 2016;35(3):290–300. | ||
Jheng YH, Lee LH, Ting CH, Pan CY, Hui CF, Chen JY. Zebrafish fed on recombinant Artemia expressing epinecidin-1 exhibit increased survival and altered expression of immunomodulatory genes upon Vibrio vulnificus infection. Fish Shellfish Immunol. 2015;42(1):1–15. | ||
Chandrasekar G, Arner A, Kitambi SS, Dahlman-Wright K, Lendahl MA. Developmental toxicity of the environmental pollutant 4-nonylphenol in zebrafish. Neurotoxicol Teratol. 2011;33(6):752–764. | ||
Peal DS, Mills RW, Lynch SN, et al. Novel chemical suppressors of long QT syndrome identified by an in vivo functional screen. Circulation. 2011;123(1):23–30. | ||
Kokel D, Peterson RT. Using the zebrafish photomotor response for psychotropic drug screening. Methods Cell Biol. 2011;105:517–524. | ||
Theofilopoulos S, Wang Y, Kitambi SS, et al. Brain endogenous liver X receptor ligands selectively promote midbrain neurogenesis. Nat Chem Biol. 2013;9(2):126–133. | ||
Hao J, Williams CH, Webb ME, Hong CC. Large scale zebrafish-based in vivo small molecule screen. J Vis Exp. 2010;(46):pii, 2243. | ||
Williams CH, Hong CC. Multi-step usage of in vivo models during rational drug design and discovery. Int J Mol Sci. 2011;12(4):2262–2274. | ||
Colanesi S, Taylor KL, Temperley ND, et al. Small molecule screening identifies targetable zebrafish pigmentation pathways. Pigment Cell Melanoma Res. 2012;25(2):131–143. | ||
Hao J, Ao A, Zhou L, et al. Selective small molecule targeting beta-catenin function discovered by in vivo chemical genetic screen. Cell Rep. 2013;4(5):898–904. | ||
Mullins MC, Hammerschmidt M, Kane DA, et al. Genes establishing dorsoventral pattern formation in the zebrafish embryo: the ventral specifying genes. Development. 1996;123:81–93. | ||
Liu Y, Asnani A, Zou L, et al. Visnagin protects against doxorubicin-induced cardiomyopathy through modulation of mitochondrial malate dehydrogenase. Sci Transl Med. 2014;6(266):266ra170. | ||
Peterson RT, Shaw SY, Peterson TA, et al. Chemical suppression of a genetic mutation in a zebrafish model of aortic coarctation. Nat Biotechnol. 2004;22(5):595–599. | ||
Williams CH, Hong CC. High content screening for modulators of cardiovascular or global developmental pathways in zebrafish. Methods Mol Biol. 2015;1263:167–174. | ||
Takaki K, Cosma CL, Troll MA, Ramakrishnan L. An in vivo platform for rapid high-throughput antitubercular drug discovery. Cell Rep. 2012;2(1):175–184. | ||
Nath AK, Roberts LD, Liu Y, et al. Chemical and metabolomic screens identify novel biomarkers and antidotes for cyanide exposure. Faseb J. 2013;27(5):1928–1938. |
 © 2017 The Author(s). This work is published and licensed by Dove Medical Press Limited. The
full terms of this license are available at https://www.dovepress.com/terms
and incorporate the Creative Commons Attribution
- Non Commercial (unported, 3.0) License.
By accessing the work you hereby accept the Terms. Non-commercial uses of the work are permitted
without any further permission from Dove Medical Press Limited, provided the work is properly
attributed. For permission for commercial use of this work, please see paragraphs 4.2 and 5 of our Terms.
© 2017 The Author(s). This work is published and licensed by Dove Medical Press Limited. The
full terms of this license are available at https://www.dovepress.com/terms
and incorporate the Creative Commons Attribution
- Non Commercial (unported, 3.0) License.
By accessing the work you hereby accept the Terms. Non-commercial uses of the work are permitted
without any further permission from Dove Medical Press Limited, provided the work is properly
attributed. For permission for commercial use of this work, please see paragraphs 4.2 and 5 of our Terms.