Back to Journals » OncoTargets and Therapy » Volume 11
CDCA5 regulates proliferation in hepatocellular carcinoma and has potential as a negative prognostic marker
Authors Shen Z, Yu X, Zheng Y, Lai X ![]() , Li J, Hong Y, Zhang H, Chen C, Su Z, Guo R
, Li J, Hong Y, Zhang H, Chen C, Su Z, Guo R
Received 21 October 2017
Accepted for publication 28 December 2017
Published 20 February 2018 Volume 2018:11 Pages 891—901
DOI https://doi.org/10.2147/OTT.S154754
Checked for plagiarism Yes
Review by Single anonymous peer review
Peer reviewer comments 2
Editor who approved publication: Prof. Dr. Geoffrey Pietersz
Zhiqing Shen,* Xueping Yu,* Yijuan Zheng, Xueping Lai, Julan Li, Yuxiang Hong, Huatang Zhang, Chunlin Chen, Zhijun Su, Ruyi Guo
Department of Infectious Diseases, First Hospital of Quanzhou Affiliated to Fujian Medical University, Quanzhou, China
*These authors contributed equally to this work
Background: CDCA5 plays an important role in the development of various human cancers, but the associated mechanisms have not been investigated in hepatocellular carcinoma (HCC).
Materials and methods: We evaluated expression levels and functions of CDCA5 in HCC and showed that CDCA5 is upregulated in HCC tissues compared with paired or unpaired normal liver tissues.
Results: Increased CDCA5 expression in HCCs was significantly associated with shorter survival of patients. Knockdown of CDCA5 using lentivirus-mediated shRNA significantly inhibited cell proliferation and suppressed cell survival, as well as induced cell cycle arrest at the G2/M phase and cell apoptosis of HCC cells. The tumor suppression effects of CDCA5 knockdown were mediated by decreased expression of cyclin-dependent kinase 1 (CDK1) and CyclinB1, which were increased in HCC tissues comparing with adjacent normal liver tissues. Moreover, upregulation of CDCA5 was positively associated with increased CDK1 and CyclinB1 expression in HCC tissues.
Conclusion: The present data warrant consideration of CDCA5 as a prognostic biomarker and therapeutic target for HCC.
Keywords: HCC, CDCA5, proliferation, apoptosis, cell cycle
Introduction
Hepatocellular carcinoma (HCC) accounts for 90% of primary liver cancers and is one of the most common cancers and the second leading cause of cancer-related death worldwide.1,2 Because symptom presentation is generally late, most patients with HCC are diagnosed at advanced stages when surgical treatments are unsuitable.3,4 Moreover, whereas surgical resection and liver transplantation are considered potentially curative for patients with HCC,5 prognoses remain discouraging, with little improvement in recurrence rates and 5-year overall survival (OS; only 34%–50%). Hence, novel diagnostic biomarkers for early detection of HCC and associated therapeutic strategies are urgently required, warranting further molecular investigations of the molecular pathogenesis of HCC.
Differential expression analyses using cDNA microarrays of entire genomes offer powerful tools for studies of the molecular basis of carcinogenesis,6 and online cancer microarray databases with genome-wide expression analyses from multiple cohorts are central to the discovery of novel early diagnostic biomarkers and therapeutic targets.7,8 In particular, expression analyses of CDCA5 (also known as Sororin) among various tumor samples of the Cancer Genome Atlas (TCGA) cohort are available through the Gene Expression Profiling Interactive Analysis (GEPIA) website and indicated significantly increased CDAC5 mRNA expression in various tumor tissues. Recent studies corroborate oncogenic activities of CDCA5 in various types of tumors.9–12
CDCA5 was initially identified as a substrate of the anaphase-promoting complex and as a master regulator of sister chromatid cohesion and separation during the cell cycle. Moreover, CDCA5 is reportedly required for stable cohesion of chromatids during S and G2/M cell cycle phases and is then degraded via anaphase-promoting complex-dependent ubiquitination during the G0/G1 phase.13–17 CDCA5 knockdown experiments confirm associations of CDCA5 with cell cycle progression at the G2/M phase checkpoint and show significant suppression of tumor growth in the absence of CDCA5.11,12,18 Clinical studies also show significantly increased CDCA5 expression in various tumor tissues and demonstrate correlations with poor prognosis.9–12 Hence, CDCA5 likely plays specific roles in tumor progression and is a potential biological marker of prognosis that may be targeted using molecular therapies. However, the clinical significance and biological function of CDCA5 in HCC remain poorly understood. Herein, we addressed the roles and underlying mechanisms of CDCA5 in HCC by comparing CDCA5 mRNA and protein expression levels in HCC tissues and noncancerous liver tissues and then correlated CDCA5 expression with survival of patients with HCC. Finally, we defined the underlying mechanisms in CDCA5 knockdown studies and assays of proliferation, apoptosis, and cell cycle-related genes in HCC cells.
Materials and methods
Bioinformatics analyses
CDCA5 mRNA expression in diverse tumor samples (including HCC) was analyzed using the GEPIA website,19–21 which contains RNA sequencing and expression data for 9,736 tumors and 8,587 normal tissues from the TCGA and Genotype-Tissue Expression (GTEx) projects (http://gepia.cancer-pku.cn/detail.php). We calculated median expression levels of CDCA5 in all tumor samples and paired normal tissues and present these in bar plots. Subsequently, we calculated differences in OS and disease-free survival (DFS) between patients with HCC with higher and lower than median CDCA5 expression. Correlations between CDCA5 and cyclin-dependent kinase 1 (CDK1)/CyclinB1 (CCNB1) were generated based on expression profiles in the TCGA cohort through the GEPIA website using the person method.
Using Oncomine gene expression array datasets (https://www.oncomine.org), CDCA5 mRNA expression levels in HCC samples were analyzed from two published datasets (GEO accession numbers GSE3500 and GSE6764)22–24 and were used to generate scatter plots. Details of standardized normalization techniques and statistical calculations are provided on the Oncomine website.
Immunohistochemistry images were downloaded from the publicly available Human Protein Atlas (HPA; http://www.proteinatlas.org) version 8.0, which is a database of tissue microarray (TMA) images that were labeled with antibodies against 11,250 human proteins.25 These TMAs comprise sections from 46 normal human tissues and 20 types of human cancers. The analyses in present study were performed using HPA images of liver sections that were labeled with CDCA5 (HPA023691) antibodies.
Tissue cDNA array analyses
Tissue cDNA arrays from 28 cases of paired HCC tissues and adjacent normal tissues were purchased from Shanghai Outdo Biotech Company (Shanghai, China). Quantitative polymerase chain reaction (Q-PCR) analyses were then performed using an ABI 7500 Fast Real-Time PCR System (Applied Biosystems, Thermo Fisher Scientific, Waltham, MA, USA) with commercially synthesized primers for targets of interest (Table 1). Glyceraldehyde-3-phosphate dehydrogenase (GAPDH) was used as an internal control, and relative mRNA expression was determined using the cycle threshold (CT) formula 2−ΔΔCT, where ΔCT = [CT (target gene) − CT (GAPDH)]. The primer sets for amplification were as follows: human CDCA5, forward 5′-AGA AAG TCA GGC GTT CCT ACA G-3′ and reverse 5′-GGG AGA TTC CAG GGA GAG TCA T-3′; human GAPDH, forward 5′-TGC ACC ACC AAC TGC TTA GC-3′ and reverse 5′-AGC TCA GGG ATG ACC TTG CC-3′.
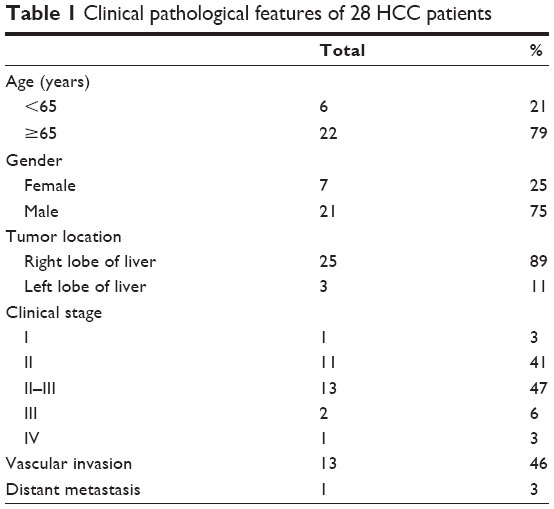 | Table 1 Clinical pathological features of 28 HCC patients |
Cell lines and cell culture
Huh7 human HCCs cells were obtained from the Cell Bank of the Chinese Academy of Sciences (Shanghai, China) and were cultured in Dulbecco’s Modified Eagle’s Medium (Gibco, Thermo Fisher Scientific, Waltham, MA, USA) supplemented with 10% fetal bovine serum (Gibco) in a humidified atmosphere containing 5% CO2 at 37°C.
Lentivirus transfection
Three CDCA5 shRNA vectors (sh-CDCA5-1, 2, and 3) and a control vector (sh-Ctrl, GV248) were purchased from Shanghai GeneChem Co., Ltd (Shanghai, China). Cells were plated in six-well plates (5×10⁴ cells/well) and were cultured to 60% confluence. Appropriate volumes of lentiviruses were then added according to the multiplicity of infection values (numbers of lentiviruses per cell) recommended by the manufacturer, and experiments were performed at 72 h after transfection.
Cell confluence observations
After transfection of Huh-7 cells with sh-CDCA5 lentiviruses or sh-Ctrl lentivirus for 72 h, cell growth was assessed by determining cell confluence and green fluorescent protein expression using a phase contrast fluorescence microscope (Axio Observer A1, Carl Zeiss AG, Jena, Germany). Images were captured at a magnification of 200×.
Trypan blue dye exclusion
Huh-7 cells were seeded into six-well plates (5×10⁴ cells/well) in complete medium and were transfected with sh-Ctrl or one of the three sh-CDCA5 lentiviruses for 72 h and were then collected by trypsinization and resuspended in fresh complete medium. Subsequently, 10-μL aliquots of cells were mixed with 10-μL aliquots of 0.4% trypan blue dye (VWR International, Radnor, PA, USA), and cell counting was performed using a Countstar Automated Cell Counter (Inno-Alliance Biotech, Wilmington, DE, USA).
Cell growth assays
After transfection with sh-Ctrl or sh-CDCA5 lentiviruses for 72 h, Huh-7 cells were collected and reseeded into 96-well plates (1×10³/well) in complete medium. Cell viability was then determined using cell counting kit-8 (CCK-8; Donjindo, Kumamoto Japan) assays at indicated time points according to the manufacturer’s protocol. Briefly, after addition of 10 μL of CCK-8 reagent to culture wells, samples were incubated for an additional 2 h at 37°C in the dark, and absorbance was measured at 450 nm using a microplate reader (Bio-Tek, Winooski, VT, USA).
Colony formation assays
Transfected cells were collected and diluted in medium in the absence of sh-Ctrl or sh-CDCA5 lentiviruses and were then reseeded into 12-well plates at a density of 500 cells/well. After 8–10 days culture, supernatants were discarded, and cells were washed three times in PBS, were fixed with 4% paraformaldehyde for 20 min, and were finally stained with 0.01% crystal violet (Solarbio, Beijing, China) for 20 min. Photographs were taken, and numbers of colonies were counted. Finally, cell survival was calculated relative to that of sh-Ctrl cells.
Cell cycle analyses
Cell cycle progression was determined using propidium iodide (PI) staining and flow cytometry. In these experiments, 1×10⁶ transfected cells were collected in PBS, were fixed in 70% ethanol overnight at −4°C, and were then centrifuged at 1,000 rpm for 5 min, washed with PBS, and finally collected by centrifugation at 1,000 rpm for 5 min. Cells were then resuspended in 400 μL of PI staining buffer and were incubated for 15 min at room temperature in the dark. Fluorescent signals were detected using flow cytometry (BD, Franklin Lakes, NJ, USA), and proportions of DNA in different cell cycle phases were determined using ModfitLT version 3.0 (Verity Software House, Topsham, ME, USA).
Hoechst staining
Apoptosis was determined using Hoechst staining assays. Briefly, transfected cells were fixed with 4% polyoxymethylene and were then incubated in Hoechst 33258 solution for 10–15 min in the dark. Staining images were captured at a magnification of 200× and were recorded using a phase contrast fluorescence microscope (Axio Observer A1, Carl Zeiss AG).
Annexin V-APC assays
After transfection with sh-Ctrl or sh-CDCA5 lentiviruses for 72 h, cells were stained with Annexin V-APC solution (KeyGEN, Jiangsu, China) according to the manufacturer’s instructions. Numbers of apoptotic Huh-7 cells were then determined using flow cytometry with a fluorescence-activated cell sorting (FACS) caliber instrument (BD). Percentages of apoptotic cells were calculated according to Annexin V staining.
Western blotting
Cells were lysed in Western and IP cell lysis buffer (Beyotime, Shanghai, China) containing phenylmethanesulfonyl fluoride (PMSF; VWR International) on ice for 30 min and were centrifuged at 14,000 rpm for 10 min at 4°C. After collecting supernatants, equal amounts of proteins were separated on 12% sodium dodecyl sulfate polyacrylamide gel and were transferred onto polyvinylidene difluoride membranes. Membranes were then incubated with tris-buffer-solution-tween (TBST) containing 5% skim milk at 37°C for 2 h, followed by primary rabbit anti-CDCA5 (1:2,000 dilution; Abcam, Cambridge, UK), rabbit anti-CDK1 (1:1,000 dilution; Abcam), rabbit anti-CCNB1 (1:500 dilution, Cell Signaling Technology, Inc. [CST], Danvers, MA, USA), or rabbit anti-GAPDH (1:1,000 dilution; CST) antibodies at 4°C overnight. After three 10-min washes in TBST, membranes were incubated with goat anti-rabbit secondary antibody (Santa Cruz Biotechnology, Santa Cruz, CA, USA) at room temperature for 1 h. Membranes were finally washed three times in TBST for 10 min each, and chemiluminescent signals were detected using ECL kits (Thermo Fisher Scientific, USA). GAPDH protein expression was used as an internal control.
Statistical analysis
Data are expressed as mean ± standard deviations of three independent experiments. Differences between two groups were identified using unpaired or paired Student’s t-tests, and those between multiple groups were identified using one-way ANOVA. All statistical analyses were performed using SPSS18.0 software, and differences were considered significant when P<0.05.
Results
CDCA5 is upregulated in HCC tissues
Analyses of mRNA expression among various tumor samples from published datasets on the GEPIA website indicated significantly greater CDCA5 expression in tumor tissues than in matched normal tissues (Figure 1A). In particular, CDCA5 was significantly upregulated in HCC tissues compared with normal liver tissues (*P<0.05; Figure 1B). In agreement, analyses of the Oncomine platform (https://www.oncomine.org) from Chen’s published dataset (http://genome-www.stanford.edu/hcc/Figures/ArrayInformation.htm) showed dramatic increases in CDCA5 in HCC tissues (n=101) compared with normal liver tissues (n=68; Figure 1C; fold change: 4.400; t-test: 11.810; P=4.55E-24<0.05). Moreover, in comparisons of HCC tissues (n=35) with normal liver tissues (n=10) from Wurmbach’s dataset (GEO accession, GSE6764), CDCA5 expression was higher in HCC tissues (Figure 1D; fold change: 2.422; t-test: 5.128; P=4.84E-6<0.05). To further verify these observations, we performed Q-PCR analysis using cDNA arrays of 28 paired HCC and normal liver tissue samples and again observed greater CDCA5 expression in HCC tissues (P<0.05; Figure 1E). Finally, analyses of data from the HPA (https://www.proteinatlas.org) confirmed CDCA5 expression in HCC tissues and undetectable expression in normal liver tissues (Figure 1F). Collectively, these studies demonstrate that CDCA5 mRNA and protein levels are higher in HCC than in normal liver tissues, suggesting that CDCA5 acts as an oncogene that promotes HCC.
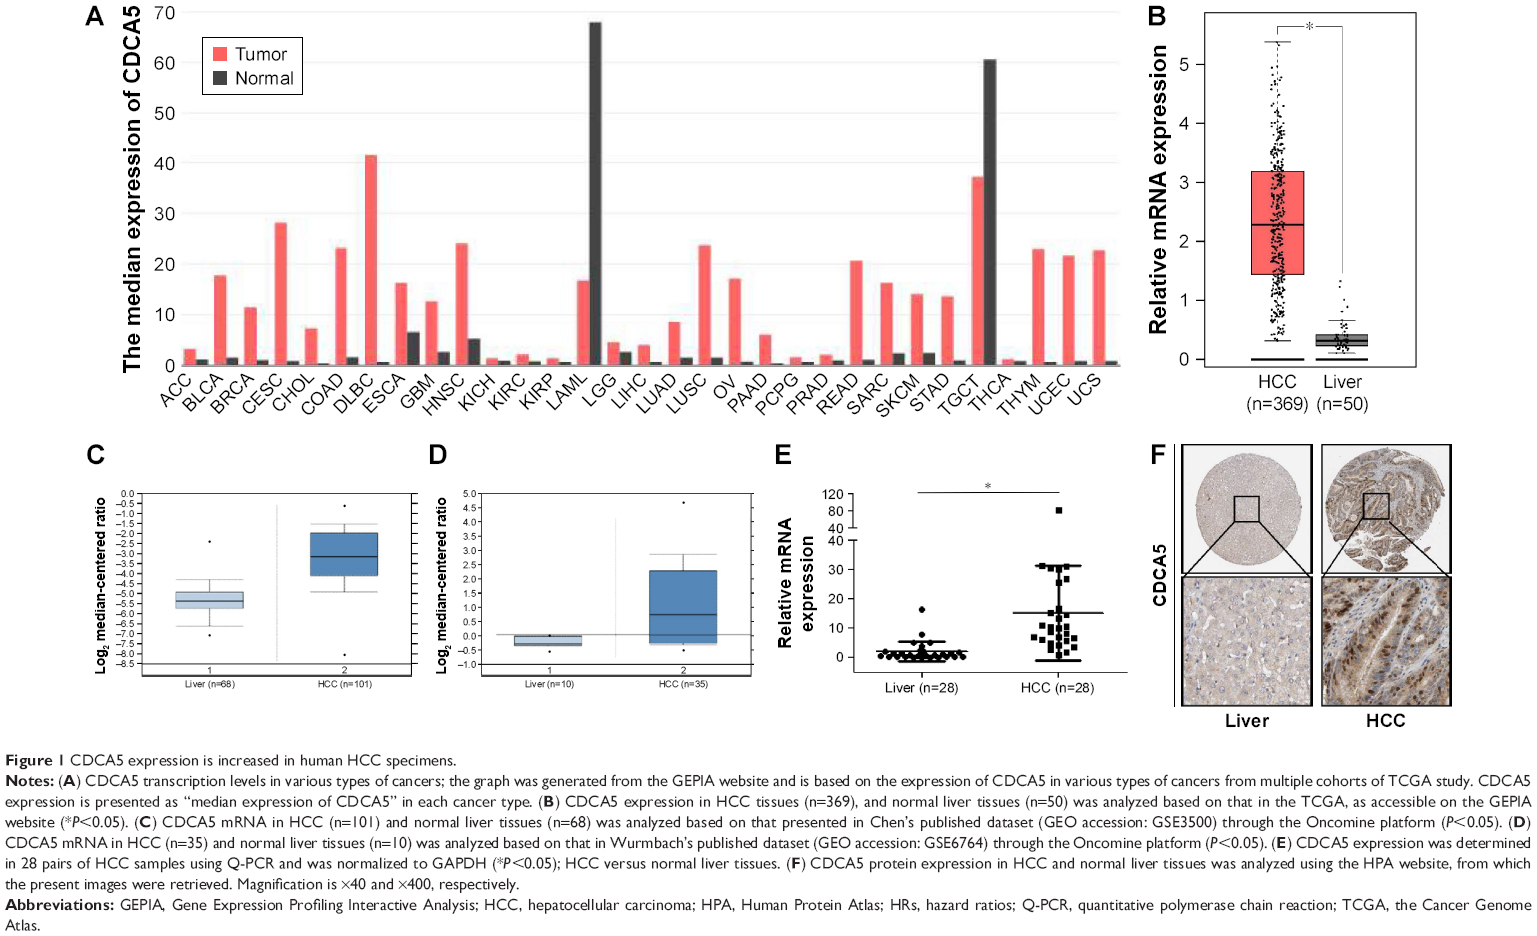 | Figure 1 CDCA5 expression is increased in human HCC specimens. |
High CDCA5 expression indicates poor survival of patients with HCC
To correlate CDCA5 expression with survival of patients with HCC, a total of 364 HCC samples with CDCA5 expression and survival data were analyzed. As shown in Figure 2A, high CDCA5 expression was associated with poorer OS (P<0.05) and DFS (P<0.05; Figure 2B), suggesting that high expression of CDCA5 in HCC is predictive of poor prognosis.
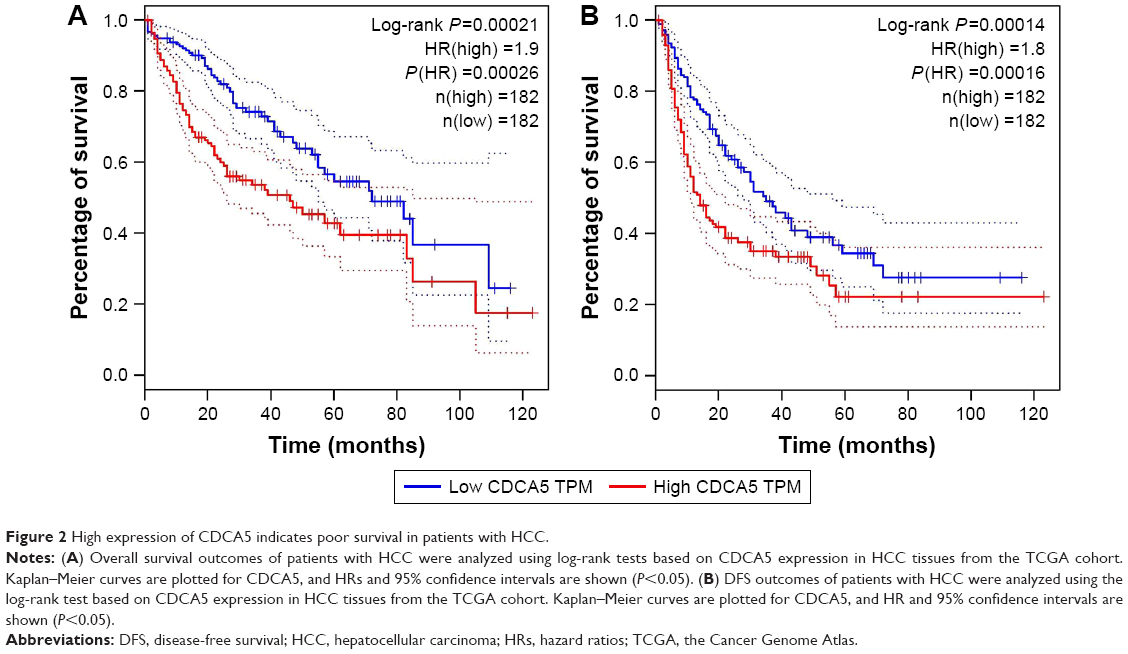 | Figure 2 High expression of CDCA5 indicates poor survival in patients with HCC. |
CDCA5 knockdown suppresses growth of HCC cells
To assess the functions of CDCA5 in HCC cells, three different lentivirus-mediated shRNAs were generated to knock down the expression of CDCA5 in human Huh7 cells. After transfection, knockdown efficiency of the shRNA lentiviruses was determined using Western-blotting analyses, which showed significant downregulation of CDCA5 protein expression after transfection with three sh-CDCA5 lentiviruses compared to after transfection with sh-Ctrl lentivirus (Figure 3A). Cell confluence observations also indicated that CDCA5 knockdown significantly decreased cell growth (Figure 3B and C), and suppression of Huh7 cell growth was confirmed in cell counting analysis (*P<0.05; Figure 3D).
 | Figure 3 CDCA5 knockdown suppresses HCC cell growth. |
CDCA5 knockdown reduces viability and survival and induces cell cycle arrest of HCC cells
In CCK-8 assays, CDCA5 knockdown using sh-CDCA5-1, sh-CDCA5-2, or sh-CDCA5-3 decreased the viability of Huh7 cells (*, #, and Δ; P<0.05, versus sh-Ctrl, respectively; Figure 4A). Moreover, colony formation assays (Figure 4B) showed decreased numbers of colonies and cell survival rates after CDCA5 knockdown in Huh7 cells. Collectively, these data show that CDCA5 knockdown decreases cell viability and survival of Huh7 cells. Because shRNA-mediated knockdown of CDCA5 significantly suppressed Huh-7 cell growth, we examined the effects on distribution of cells across the cell cycle using PI staining and flow cytometry analyses (Figure 4C). In these experiments, transfection of Huh-7 cells with sh-CDCA5 lentiviruses led to higher percentages of cells in the sub G2/M stage compared with the control group, indicating that G2/M arrest contributes to the cell growth suppressing effects of CDCA5 knockdown.
 | Figure 4 CDCA5 knockdown reduces viability and survival and induces cell cycle arrest of HCC cells. |
CDCA5 knockdown induces apoptosis of HCC cells
In further experiments, we assessed the effects of CDCA5 knockdown on apoptosis using Hoechst and Annexin V staining. As shown in Figure 5A, CDCA5 knockdown cells showed typical apoptotic features such as condensed chromatin and fragmented nuclear morphology, whereas the sh-Ctrl cell nuclei were homogeneously and less intensely stained. Similarly, Annexin V staining and FACS analyses confirmed the induction of apoptosis by CDCA5 knockdown in Huh7 cells (*P<0.05; Figure 5B). Taken together, these data show that CDCA5 knockdown strongly induces apoptosis in HCC cells.
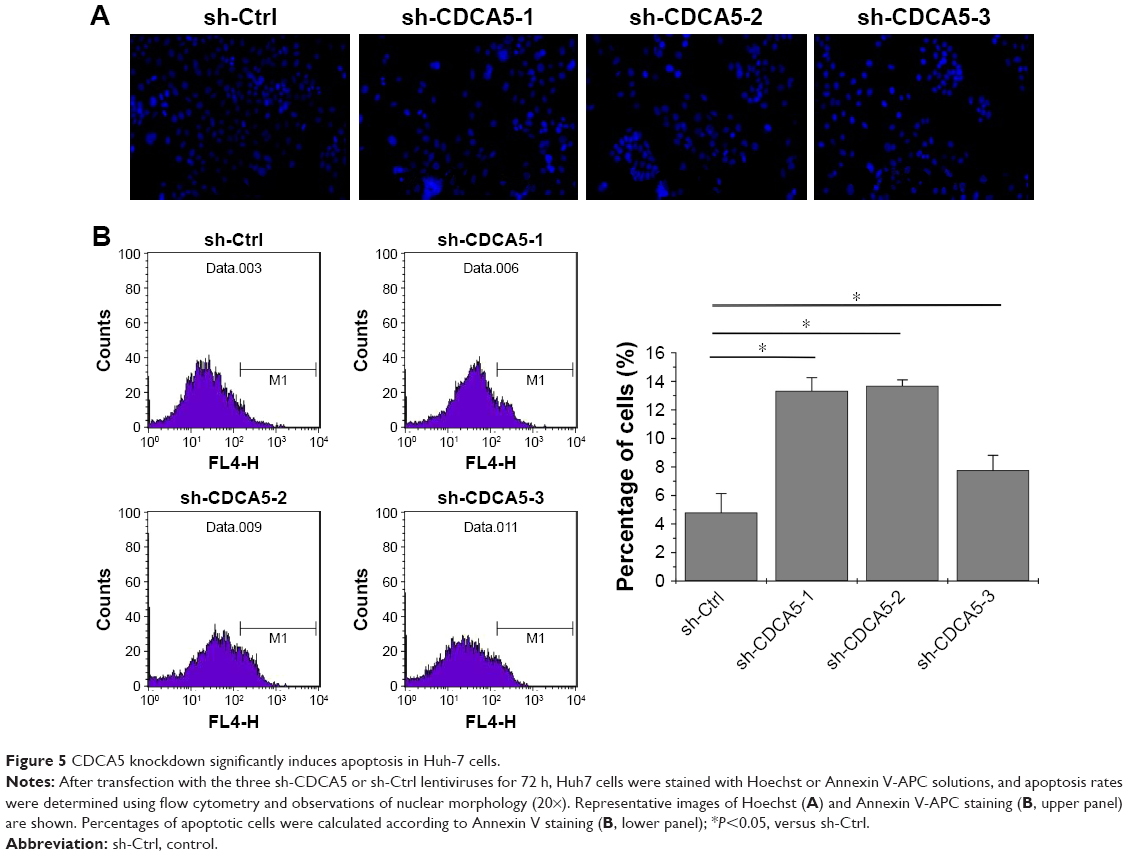 | Figure 5 CDCA5 knockdown significantly induces apoptosis in Huh-7 cells. |
CDCA5 knockdown downregulates CCNB1 and CDK1
Because CDCA5 knockdown significantly suppresses cell proliferation by inducing cell cycle progression at the G2/M phase, we assessed expression levels of the cell cycle control proteins CDK1 and CCNB1 after CDCA5 knockdown with sh-CDCA5-1 lentivirus (Figure 6A). CDK1 and CCNB1 expression levels are reportedly increased in tumor tissues and are essential for G2/M phase transitions in cancer cells.26–29 In the present study, CDCA5 knockdown significantly decreased the expression of these proteins, and in analyses of data from the GEPIA website, CDK1 and CCNB1 expression levels were significantly greater in HCC tissues than in normal liver tissues (Figure 6B) and were both positively correlated with CDCA5 mRNA expression in HCC samples (Figure 6C, P<0.05). Hence, CDK1 and CCNB1 contribute to cell cycle arrest following CDCA5 knockdown.
 | Figure 6 CDCA5 knockdown downregulates CCNB1 and CDK1. |
Discussion
The key findings of this study are that CDCA5 mRNA and protein expression levels are significantly increased in HCC tissues and that these are correlated with poor prognosis of patients with HCC. Moreover, suppression of cell growth following CDCA5 knockdown was indicated by assays of cell viability and survival and analyses of cell cycle arrest in HCC cells. Specifically, CDCA5 knockdown suppressed CDK1 and CCNB1 expression levels, and these were positively correlated with CDCA5 levels in HCC samples. Collectively, these data warrant consideration of CDCA5 as an oncogene in HCC, with potential as a diagnostic marker and prognostic biomarker and therapeutic target.
Despite recent improvements in treatments for HCC, disease-specific mortality remains high and novel early diagnostic biomarkers and therapeutic targets are eagerly awaited. Herein, we used the GEPIA website, which was set up as a platform for identifying candidate genes using data from multiple cohorts, and confirmed previous studies showing that CDCA5 expression is significantly upregulated in various tumor types.9–12 Moreover, based on these GEPIA results, we performed further analyses using Oncomine and HPA databases and found that CDCA5 mRNA and protein levels are significantly increased in HCC. Corresponding CDCA5 mRNA expression levels were confirmed in Q-PCR-based tissue cDNA arrays, indicating that high expression of CDCA5 is common in HCC and could be exploited for early diagnoses. Accordingly, high CDCA5 expression was significantly associated with poor OS and DFS among patients with HCC. These findings are consistent with previous studies of other cancers9–12 and suggest that CDCA5 plays critical roles in the progression of HCC.
CDCA5 is a substrate of the anaphase-promoting complex and participates in the regulation of sister chromatid cohesion, which is required during S and G2 phases of the cell cycle and, therefore, for cell cycle progression.13–17 Increasing evidence shows that knockdown of CDCA5 significantly suppresses cancer cell growth in vitro and in vivo.9–12 However, because the functional roles of CDCA5 in HCC are poorly understood, we initially determined the effects of CDCA5 knockdown on HCC cell growth after transfecting cultured hepatoma cells with three different lentivirus-encoded shRNAs. Transfection with sh-CDCA5 letiviruses markedly decreased the CDCA5 on protein level, indicating efficient knockdown in Huh7 cells. Further cell counting and morphology observations of these cells were corroborated by CCK-8 and colony formation assays, which indicated that knockdown of CDCA5 markedly decreases cell viability and survival, as indicated previously.9–12
Eukaryotic cell proliferation is primarily regulated by the cell cycle, and CDCA5 has been associated with cell cycle control.15,26 Thus, we performed cell cycle analyses of CDCA5 knockdown Huh7 cells and showed increased cell cycle arrest at the G2/M phase. Recent studies also demonstrate roles of CDCA5 in cell cycle progression and apoptosis of other cancer cells.11,12,18 Apoptotic cell death plays important roles in the tissue development and homeostasis27 and is the desired outcome of all cancer preventive strategies.28 In the present Hoechst staining analyses and Annexin V assays, silencing of CDCA5 significantly induced apoptosis of Huh7 cells, further confirming the tumor-suppressive effects of CDCA5 knockdown in HCC and indicating the therapeutic potential of CDCA5 as a target for anti-HCC treatments.
CDK1 and CCNB1 are accepted as central regulators of cell cycle progression at the G2/M checkpoint.29–32 Thus, induction of G2/M cell cycle arrest by CDCA5 knockdown is likely mediated by CDK1 and CCNB1. Accordingly, our Western-blotting analysis of CDK1 and CCNB1 showed significant suppression in CDCA5 knockdown cells, and expression and correlation analyses of CDCA5 and CDK1/CCNB1 from the TCGA cohort indicated that CDK1 and CCNB1 expression levels are increased in patients with HCC and are positively associated with CDCA5. Taken together, these findings indicate that manipulations of CDCA5 expression could be used to suppress tumors by mitigating CDK1 and CCNB1-mediated cell cycle progression at the G2/M phase.
Conclusion
The present study demonstrates that CDCA5 is strongly expressed in HCC tissues and is significantly associated with shorter survival of patients with HCC. We also show previously uncharacterized mechanisms that underlie the roles of CDCA5 in the progression of HCC and suggest that CDCA5 has potential as a diagnostic and prognostic marker for HCC and a therapeutic target for cancer.
Acknowledgments
This study was supported by the National Natural Science Foundation of China (81400625), the Natural Science Foundation of Fujian province (2015J01413 and 2016Y9065), and the Quanzhou Science and Technology Project (2014Z37).
Disclosure
The authors report no conflicts of interest in this work.
References
Ferlay J, Soerjomataram I, Dikshit R, et al. Cancer incidence and mortality worldwide: sources, methods and major patterns in GLOBOCAN 2012. Int J Cancer. 2015;136:E359–E386. | ||
Kim DW, Talati C, Kim R. Hepatocellular carcinoma (HCC): beyond sorafenib-chemotherapy. J Gastrointest Oncol. 2017;8:256–265. | ||
Cheng AL, Kang YK, Chen Z, et al. Efficacy and safety of sorafenib in patients in the Asia-Pacific region with advanced hepatocellular carcinoma: a phase III randomised, double-blind, placebo-controlled trial. Lancet Oncol. 2009;10:25–34. | ||
Llovet JM, Ricci S, Mazzaferro V, et al. Sorafenib in advanced hepatocellular carcinoma. N Engl J Med. 2008;359:378–390. | ||
Lang H, Sotiropoulos GC, Brokalaki EI, et al. Survival and recurrence rates after resection for hepatocellular carcinoma in noncirrhotic livers. J Am Coll Surg. 2007;205:27–36. | ||
Daigo Y, Nakamura Y. From cancer genomics to thoracic oncology: discovery of new biomarkers and therapeutic targets for lung and esophageal carcinoma. Gen Thorac Cardiovasc Surg. 2008;56:43–53. | ||
Rachidi SM, Qin T, Sun S, Zheng WJ, Li Z. Molecular profiling of multiple human cancers defines an inflammatory cancer-associated molecular pattern and uncovers KPNA2 as a uniform poor prognostic cancer marker. PLoS One. 2013;8:e57911. | ||
Hong S, Huang Y, Cao Y, Chen X, Han JD. Approaches to uncovering cancer diagnostic and prognostic molecular signatures. Mol Cell Oncol. 2014;1:e957981. | ||
Nguyen MH, Koinuma J, Ueda K, et al. Phosphorylation and activation of cell division cycle associated 5 by mitogen-activated protein kinase play a crucial role in human lung carcinogenesis. Cancer Res. 2010;70:5337–5347. | ||
Chang IW, Lin VC, He HL, et al. CDCA5 overexpression is an indicator of poor prognosis in patients with urothelial carcinomas of the upper urinary tract and urinary bladder. Am J Transl Res. 2015;7:710–722. | ||
Tokuzen N, Nakashiro K, Tanaka H, Iwamoto K, Hamakawa H. Therapeutic potential of targeting cell division cycle associated 5 for oral squamous cell carcinoma. Oncotarget. 2016;7:2343–2353. | ||
Chen T, Huang Z, Tian Y, et al. Role of triosephosphate isomerase and downstream functional genes on gastric cancer. Oncol Rep. 2017;38:1822–1832. | ||
Rankin S, Ayad NG, Kirschner MW. Sororin, a substrate of the anaphase-promoting complex, is required for sister chromatid cohesion in vertebrates. Mol Cell. 2005;18:185–200. | ||
Schmitz J, Watrin E, Lenart P, Mechtler K, Peters JM. Sororin is required for stable binding of cohesin to chromatin and for sister chromatid cohesion in interphase. Curr Biol. 2007;17:630–636. | ||
Nishiyama T, Ladurner R, Schmitz J, et al. Sororin mediates sister chromatid cohesion by antagonizing Wapl. Cell. 2010;143:737–749. | ||
Watrin E, Demidova M, Watrin T, Hu Z, Prigent C. Sororin pre-mRNA splicing is required for proper sister chromatid cohesion in human cells. EMBO Rep. 2014;15:948–955. | ||
Ladurner R, Kreidl E, Ivanov MP, et al. Sororin actively maintains sister chromatid cohesion. EMBO J. 2016;35:635–653. | ||
Kato T, Lee D, Wu L, et al. SORORIN and PLK1 as potential therapeutic targets in malignant pleural mesothelioma. Int J Oncol. 2016;49:2411–2420. | ||
Tang Z, Li C, Kang B, et al. GEPIA: a web server for cancer and normal gene expression profiling and interactive analyses. Nucleic Acids Res. 2017;45(Web Server issue):W98–W102. | ||
Weinstein JN, Collisson EA, Mills GB, et al. The Cancer Genome Atlas Pan-Cancer analysis project. Nat Genet. 2013;45:1113–1120. | ||
Wang Z, Gerstein M, Snyder M. RNA-Seq: a revolutionary tool for transcriptomics. Nat Rev Genet. 2009;10:57–63. | ||
Rhodes DR, Yu J, Shanker K, et al. ONCOMINE: a cancer microarray database and integrated data-mining platform. Neoplasia. 2004;6:1–6. | ||
Chen X, Cheung ST, So S, et al. Gene expression patterns in human liver cancers. Mol Biol Cell. 2002;13:1929–1939. | ||
Wurmbach E, Chen YB, Khitrov G, et al. Genome-wide molecular profiles of HCV-induced dysplasia and hepatocellular carcinoma. Hepatology. 2007;45:938–947. | ||
Uhlen M, Oksvold P, Fagerberg L, et al. Towards a knowledge-based Human Protein Atlas. Nat Biotechnol. 2010;28:1248–1250. | ||
Ouyang Z, Zheng G, Song J, et al. Structure of the human cohesin inhibitor Wapl. Proc Natl Acad Sci U S A. 2013;110:11355–11360. | ||
Elmore S. Apoptosis: a review of programmed cell death. Toxicol Pathol. 2007;35:495–516. | ||
Farnebo M, Bykov VJ, Wiman KG. The p53 tumor suppressor: a master regulator of diverse cellular processes and therapeutic target in cancer. Biochem Biophys Res Commun. 2010;396:85–89. | ||
Wang Z, Fan M, Candas D, et al. Cyclin B1/Cdk1 coordinates mitochondrial respiration for cell-cycle G2/M progression. Dev Cell. 2014;29:217–232. | ||
Lohberger B, Leithner A, Stuendl N, Kaltenegger H, Kullich W, Steinecker-Frohnwieser B. Diacerein retards cell growth of chondrosarcoma cells at the G2/M cell cycle checkpoint via cyclin B1/CDK1 and CDK2 downregulation. BMC Cancer. 2015;15:891. | ||
Yuan J, Yan R, Kramer A, et al. Cyclin B1 depletion inhibits proliferation and induces apoptosis in human tumor cells. Oncogene. 2004;23:5843–5852. | ||
Fang Y, Yu H, Liang X, et al. Chk1-induced CCNB1 overexpression promotes cell proliferation and tumor growth in human colorectal cancer. Cancer Biol Ther. 2014;15:1268–1279. |
 © 2018 The Author(s). This work is published and licensed by Dove Medical Press Limited. The
full terms of this license are available at https://www.dovepress.com/terms
and incorporate the Creative Commons Attribution
- Non Commercial (unported, 3.0) License.
By accessing the work you hereby accept the Terms. Non-commercial uses of the work are permitted
without any further permission from Dove Medical Press Limited, provided the work is properly
attributed. For permission for commercial use of this work, please see paragraphs 4.2 and 5 of our Terms.
© 2018 The Author(s). This work is published and licensed by Dove Medical Press Limited. The
full terms of this license are available at https://www.dovepress.com/terms
and incorporate the Creative Commons Attribution
- Non Commercial (unported, 3.0) License.
By accessing the work you hereby accept the Terms. Non-commercial uses of the work are permitted
without any further permission from Dove Medical Press Limited, provided the work is properly
attributed. For permission for commercial use of this work, please see paragraphs 4.2 and 5 of our Terms.