Back to Journals » Diabetes, Metabolic Syndrome and Obesity » Volume 19
Causal Risk Factors for Type 1 Diabetes in Mendelian Randomization Studies: A Systematic Review and Meta-Analysis
Authors Li M, Shen P, Liu C, Li J, Qiu S, Wang Z ![]()
Received 25 September 2025
Accepted for publication 19 January 2026
Published 19 February 2026 Volume 2026:19 568784
DOI https://doi.org/10.2147/DMSO.S568784
Checked for plagiarism Yes
Review by Single anonymous peer review
Peer reviewer comments 3
Editor who approved publication: Dr Rebecca Baqiyyah Conway
Mali Li,1,2 Panting Shen,1,2 Chao Liu,1,2 Jia Li,1,2 Shichao Qiu,1,2 Zhihua Wang1,2
1Department of Endocrinology, Genetics and Metabolism, Xi’an Children’s Hospital, Xi’an, Shaanxi Province, 710003, People’s Republic of China; 2Department of Endocrinology, Genetics and Metabolism, Children’s Hospital Affiliated to Xi’an Jiaotong University, Xi’an, Shaanxi Province, 710003, People’s Republic of China
Correspondence: Zhihua Wang, Department of Endocrinology, Genetics and Metabolism, Xi’an Children’s Hospital/ Children’s Hospital Affiliated to Xi’an Jiaotong University, No. 69, Xiju Lane, Lianhu District, Xi’an, Shaanxi Province, 710003, People’s Republic of China, Email [email protected]
Background: Type 1 diabetes mellitus (T1DM) is a chronic disease mediated by autoimmunity, with complex and not fully elucidated pathogenesis. Mendelian randomization (MR) utilizes genetic instrumental variables to minimize confounding and reverse causation; however, individual MR studies are often limited by sample size and result heterogeneity.
Methods: Following PRISMA 2020 guidelines, we systematically searched PubMed, Web of Science, and other databases from 2014 to 2025, ultimately including 53 MR studies (covering 243 exposures). Random-effects models were used to pool effect sizes. Heterogeneity was quantified by Cochran’s Q test and I2 statistic. Bias was further controlled using Egger’s regression and leave-one-out sensitivity analysis.
Results: This study integrated 53 MR studies (243 exposures) and identified key causal factors for T1DM.IL2RA (OR = 0.22, 95% CI: 0.17– 0.27) and TYK2 (OR = 0.61, 95% CI: 0.54– 0.69) showed significant protective effects, while IL6R (OR = 1.98, 95% CI: 1.48– 2.65) was associated with increased risk. For metabolites, 3-phenylpropionic acid (OR = 0.90, 95% CI: 0.85– 0.96) and cinnamoylglycine (OR = 0.89, 95% CI: 0.84– 0.96) were protective, while trimethylamine N-oxide (TMAO; OR = 1.11, 95% CI: 1.02– 1.20) increased risk. Among gut microbiota, Prevotella 9 (OR = 1.18, 95% CI: 1.08– 1.30) was positively associated with risk, whereas Bifidobacterium (OR = 0.82, 95% CI: 0.71– 0.95) showed a protective effect. Childhood obesity (OR = 1.32, 95% CI: 1.06– 1.64) was also associated with increased T1DM risk. Overall heterogeneity was high (I2 = 78.3%).
Conclusion: This study systematically mapped the multi-omics causal risk landscape of T1DM, providing important evidence for precision prevention and targeted intervention. These findings suggest that targeting immune pathways (particularly IL2RA and TYK2) and modulating gut microbiota composition may represent promising strategies for T1DM prevention. Future research should emphasize cross-ethnic validation and life-stage–specific intervention strategies.
Keywords: type 1 diabetes mellitus, Mendelian randomization, causal risk factors, meta-analysis, multi-omics
Introduction
Background
Type 1 diabetes mellitus (T1DM) is a lifelong chronic disease resulting from a complex pathogenesis involving autoimmune destruction of pancreatic β-cells and a wide range of genetic, environmental, immunological, and metabolic factors.Although it typically manifests in childhood and adolescence, its pathogenesis remains complex and incompletely understood, involving a wide range of genetic, environmental, immunological, and metabolic factors.1 The incidence of T1DM varies significantly across different ethnicities and regions, and has been rising globally in recent years, placing a considerable burden on patients, families, and public health systems.2,3 Elucidating the causal risk factors for T1DM is crucial for developing effective prevention strategies, advancing precision medicine, and identifying novel therapeutic targets.
Rationale and Knowledge Gap
While numerous observational studies have identified a variety of potential risk factors for T1DM—including genetic susceptibility loci, environmental exposures, metabolic products, inflammatory responses, and alterations in the microbiome—such studies are prone to confounding and reverse causation, limiting their ability to infer causality. Mendelian randomization (MR), as an innovative epidemiological approach, leverages genetic variants as instrumental variables to minimize confounding and strengthen causal inference between risk factors and T1DM.4 In recent years, MR has been widely applied to explore the mechanisms and risk profiles of T1DM, revealing potential causal links across multiple biological pathways, including immune regulation,5 lipid metabolism,6 gut microbiota composition,7 and inflammatory cytokine signaling.8 However, existing MR studies often differ substantially in sample size, population structure, methodological design, and exposure definitions, limiting the reproducibility and generalizability of individual findings. For example, studies examining the causal role of vitamin D in T1DM have reported conflicting results, with sample sizes ranging from a few thousand to over 100,000 participants, and varying definitions of vitamin D exposure (eg, serum 25-hydroxyvitamin D levels vs genetic scores)9,10 (Similarly, MR studies on gut microbiota have employed different taxonomic classifications and statistical approaches, yielding inconsistent effect estimates.11,12 Systematic reviews and meta-analyses can integrate diverse MR evidence, enhance statistical power, quantify the comprehensive causal effects of multiple exposures, and enable in-depth assessment of heterogeneity and robustness across studies.13,14 Particularly in the era of multi-omics and big data, standardizing and structuring results from different MR studies and systematically evaluating the true impact of various factors on T1DM have become major scientific challenges.15
Objective
In this study, we performed a large-scale integration of MR evidence to comprehensively characterize the multidimensional causal architecture of T1DM. We established a complete risk factor spectrum based on MR evidence across eleven biological categories—including amino acids, metabolites, immune cells, proteins/genes, lipids, and disease/inflammatory factors. Using rigorous random-effects modeling, sensitivity analyses, and publication bias assessments, we systematically quantified the causal contributions of different exposures to T1DM risk, elucidated patterns of heterogeneity and subgroup features, and provided a robust scientific basis for etiological research, risk prediction, targeted intervention, and precision prevention of T1DM. Our work also contributes methodological insights for the standardization and innovation of MR meta-analyses.
This systematic review and meta-analysis were conducted according to the PRISMA 2020 guidelines.
Methods
Search Strategy
This systematic review was conducted in accordance with the PRISMA 2020 guidelines.16,17 A comprehensive literature search was performed using PubMed, Web of Science, and Embase for articles published between January 1, 2014, and July 1, 2025. A comprehensive literature search was performed using PubMed, Web of Science, and Embase for articles published between January 1, 2014, and July 1, 2025. The year 2014 was selected as the starting point because it marked a significant period of methodological advancement in Mendelian randomization research, including the widespread adoption of two-sample MR approaches and the increased availability of large-scale GWAS summary data from major genetic consortia and biobanks. Additionally, our preliminary scoping search indicated that MR studies specifically investigating causal risk factors for T1DM were sparse prior to 2014.The search strategy incorporated a combination of free-text keywords and Medical Subject Headings (MeSH) terms related to autoimmune diseases, type 1 diabetes mellitus (T1DM), Mendelian randomization (MR), and genetic causal inference. Key terms included: “autoimmune disease”, “Type 1 diabetes mellitus”, “T1DM”, “Mendelian randomization”, “MR”, “genetic instrument”, “causal risk factor”, “exposure”, “risk factor”, “determinant”, and “GWAS”. Boolean operators (AND/OR) were used to optimize search sensitivity and specificity. An exemplary search string was: (“Type 1 diabetes” OR “T1DM”) AND (“Mendelian randomization” OR “MR”) AND (“risk factor” OR “exposure” OR “instrument variable” OR “GWAS”). To ensure literature saturation, reference lists of all included articles were manually screened for additional relevant publications (see Figure 1).
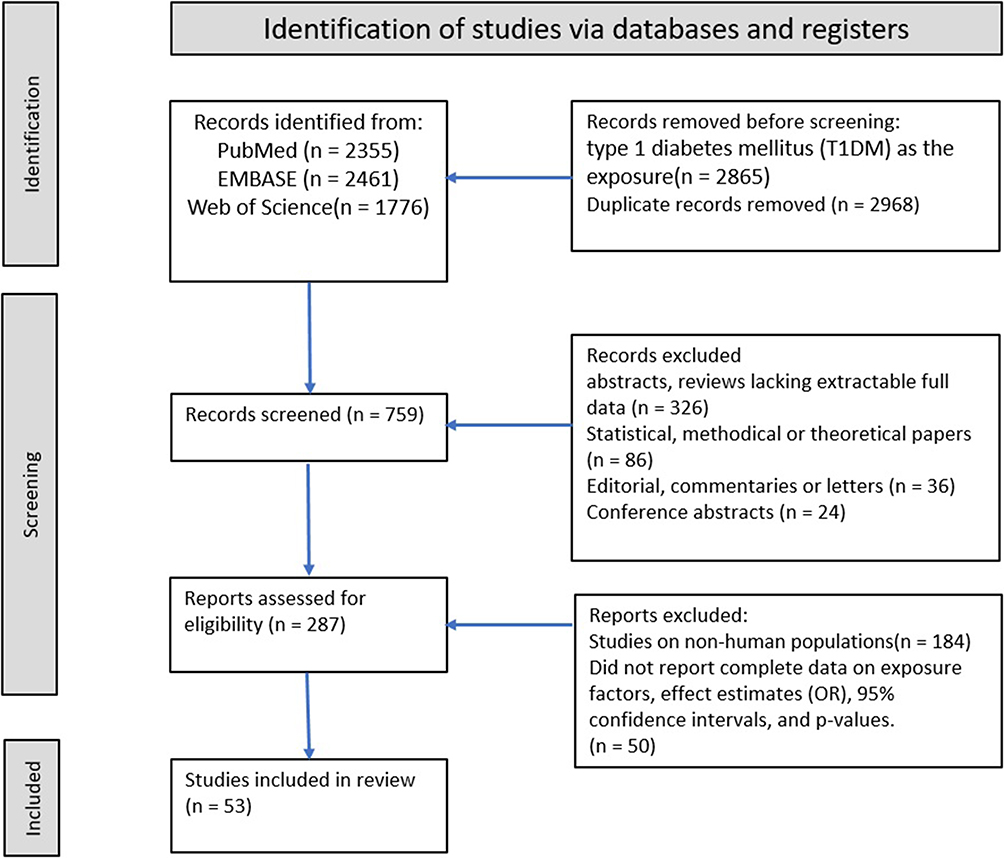 |
Figure 1 PRISMA Flow Diagram of the Study Selection Process. A total of 759 records were identified through systematic searches of PubMed, Embase, and Web of Science. After removal of duplicates and screening of titles, abstracts, and full texts, 53 studies were included in the meta-analysis. |
Eligibility Criteria
The inclusion criteria were as follows: (1) MR studies with T1DM as the outcome; (2) studies reporting exposure factors, effect estimates (odds ratio, OR), 95% confidence intervals (CIs), and corresponding P-values; (3) studies conducted in human populations; (4) employment of a two-sample or multi-sample MR design.
Studies were excluded for any of the following: (1) publication as an abstract, review, or conference paper without sufficient original data; (2) duplicate or substantially overlapping datasets; (3) use of instrumental variables with an F-statistic below 10, which is the established threshold for instrument strength to minimize weak instrument bias. To ensure reliable and consistent study selection, two reviewers independently performed the screening process. Any discrepancies were resolved through consensus or by adjudication from a third reviewer.
Data Extraction and Management
For each eligible study and publicly available dataset, the following data were extracted: first author, publication year, specific exposure factor, biological category, cohort name, sample size, effect estimate (OR), 95% CI, P-value, and the number of instrumental variables used. Data extraction was performed using a standardized form. All numerical data, including scientific notation and superscript formats, were carefully standardized using Stata software to ensure consistency. Only entries with logically consistent effect estimates (ie, CI lower limit < OR < CI upper limit) were included in subsequent analyses.
Data Synthesis and Statistical Analysis
Meta-Analysis
All meta-analyses were performed using random-effects models (DerSimonian–Laird method) as the primary approach to account for anticipated heterogeneity.18 Pooled effect estimates and 95% CIs were derived using the natural logarithm of the OR and its standard error. For dichotomous exposures, the Mantel-Haenszel method was applied; for continuous exposures, the inverse-variance method (yielding standardized mean differences, SMDs) was used.19 If an exposure was reported in only a single study, the original estimate and CI were presented narratively.
Assessment of Heterogeneity
Heterogeneity among studies was assessed using Cochran’s Q statistic (with a significance threshold of P < 0.10) and quantified using the I2 statistic. I2 values greater than 50% were considered to indicate moderate-to-high heterogeneity. In cases of significant heterogeneity, the random-effects model was retained, and the between-study variance (τ2) was estimated.
Sensitivity Analysis and Publication Bias
The robustness of the pooled results was evaluated using leave-one-out sensitivity analysis. Publication bias was assessed visually through funnel plot symmetry (Supplemental Figure 1) and statistically using Egger’s regression test (Supplemental Figure 3, Supplemental Table 2). The robustness of the results was further evaluated using Begg’s rank correlation test (Supplemental Table 5). The sources of heterogeneity were further explored using multivariable meta-regression models that incorporated covariates such as study quality score and sample size.20 Begg’s rank correlation test was used as a supplementary assessment for publication bias. Influence diagnostics were conducted to identify any individual study exerting a disproportionate impact on the overall results. As specified in the eligibility criteria (Eligibility Criteria), studies employing genetic variants with an F-statistic below 10 were excluded to ensure adequate instrument strength. The significance level for all primary analyses was set at P < 0.05.
Visualization and Reporting
The results of the meta-analysis were presented graphically using forest plots (Figure 2, Supplemental Figure 4), funnel plots (Supplemental Figure 1), and sensitivity analysis plots (Supplemental Figure 3). Additionally, a bubble plot illustrating univariate meta-regression results is provided in Supplemental Figure 2. For each exposure category, a structured summary table reported the number of studies, pooled OR, 95% CI, I2 statistic, and P-value from the Q-test.
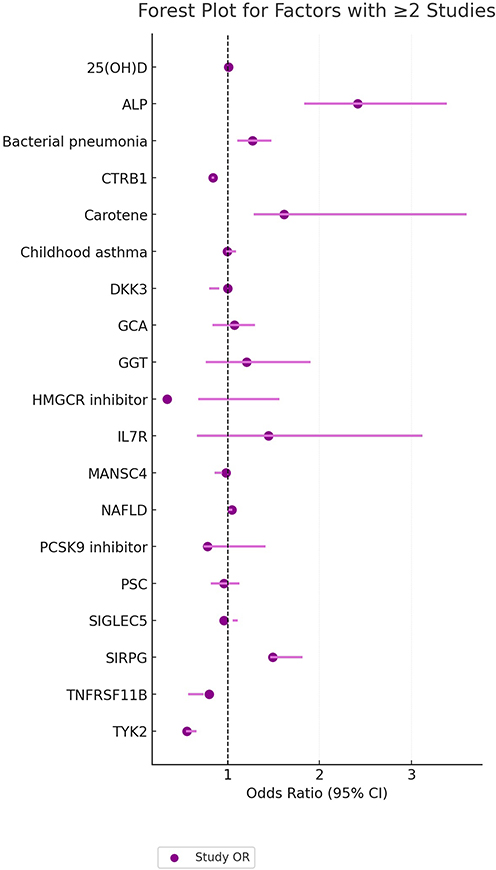 |
Figure 2 Forest Plot of Factors Investigated in Two or More Studies. Each estimate is represented by a square (point estimate) and horizontal line (95% confidence interval). The area of the square corresponds to the study-specific weight in the meta-analysis. The vertical dashed line indicates the null effect (OR = 1). Abbreviations: CTRB1, chymotrypsinogen B1; DKK3, Dickkopf-related protein 3; GCA, giant cell arteritis; GGT, gamma-glutamyl transferase; IL2RA, interleukin-2 receptor subunit alpha; IL6R, interleukin-6 receptor; TYK2, tyrosine kinase 2; SIRPG, signal regulatory protein gamma; TMAO, trimethylamine N-oxide; FABP4, fatty acid-binding protein 4; IGF-1, insulin-like growth factor 1; HLA, human leukocyte antigen; PC, phosphatidylcholine; LDL, low-density lipoprotein; HDL, high-density lipoprotein; BMI, body mass index; T1DM, type 1 diabetes mellitus; OR, odds ratio; CI, confidence interval. |
Software
All statistical analyses, data management and generation of figures were conducted using STATA version 17.0 (StataCorp LP, USA).Literature screening and data extraction figures were performed using RevMan version 5.4 (The Cochrane Collaboration, Denmark).
Assessment of Risk of Bias and Study Quality
Systematic Search and Screening Rigor
To minimize language bias, no restrictions were applied during the search. Furthermore, manual searches of reference lists and key reviews were conducted to identify any additional relevant studies.
Control for Publication Bias
In addition to statistical tests, efforts to mitigate publication bias included the consideration of high-quality preprints that employed robust methodological approaches. Sensitivity analyses were performed by excluding lower-quality studies (defined as those with a quality score ≤ 6) to evaluate the stability of the findings.
Standardized Screening and Data Extraction Process
The study screening process was designed to minimize selection bias. Two independent reviewers (both holding MSc degrees) performed the initial screening of titles and abstracts, followed by a full-text review. A third reviewer (an MD) was consulted to resolve any disagreements, ensuring a consistent and rigorous application of the inclusion and exclusion criteria.
A piloted, structured data extraction form was used to ensure consistent and accurate data collection. To control for extraction errors, a quality control procedure was implemented: personnel not involved in the primary extraction process independently reviewed a random sample of 20% of the included studies. The error rate for data extraction was maintained below 5%. These procedures were aligned with the Cochrane risk of bias tool21 and PRISMA 2020 recommendations to address potential biases comprehensively.
Quality Assessment of Individual Studies
The methodological quality of each included MR study was evaluated using a predefined set of 13 criteria, developed based on established guidelines for MR research.22–24 This tool assessed five core domains: (1) methodological rigor of the MR design (eg, use of one-sample vs two-sample MR, primary statistical approach (eg, IVW, 2SLS), and thoroughness of sensitivity analyses for pleiotropy and heterogeneity); (2) sample size and statistical power (studies with >80% power were considered large); (3) selection and justification of instrumental variables (including genetic strength and biological plausibility); (4) application of advanced MR methods (eg, multivariable MR); and (5) completeness of reporting (eg, effect estimates, CIs, discussion of limitations). Each study received a score from 0 to 13.
Additionally, the overall quality of evidence for key findings was assessed using the GRADE framework.25,26 Initially, all evidence from MR studies was classified as “high quality” and was subsequently downgraded based on the following criteria: risk of bias, inconsistency, indirectness, imprecision, and publication bias. Two reviewers independently performed all quality assessments. Inter-rater agreement was quantified using the Kappa statistic, and any discrepancies were resolved through discussion or by consulting a third reviewer.This systematic review and meta-analysis was prospectively registered in PROSPERO (International Prospective Register of Systematic Reviews) under registration number CRD420251152014 (https://www.crd.york.ac.uk/PROSPERO/view/CRD420251152014).
Results
Characteristics of Included Studies
Our systematic search and selection process, conducted in accordance with PRISMA 2020 guidelines, yielded 53 eligible Mendelian randomization studies5–7,10,12,27–74 for inclusion. These studies collectively encompassed 132 independent cohorts and investigated 243 unique exposures. Participant data were predominantly sourced from large-scale public genetic consortia and biobanks, including the UK Biobank and FinnGen, with the majority of individuals being of Eurasian ancestry. All exposures were systematically classified into 11 biological categories for analysis, including amino acids, proteins/genes, lipids/fatty acids, metabolites, immune cells/phenotypes, trace elements, hormones/vitamins, diseases/inflammation/autoimmunity, gut microbiota, and enzymes/signaling molecules/receptor complexes (see Table 1 and Supplemental Table 1 for complete details).
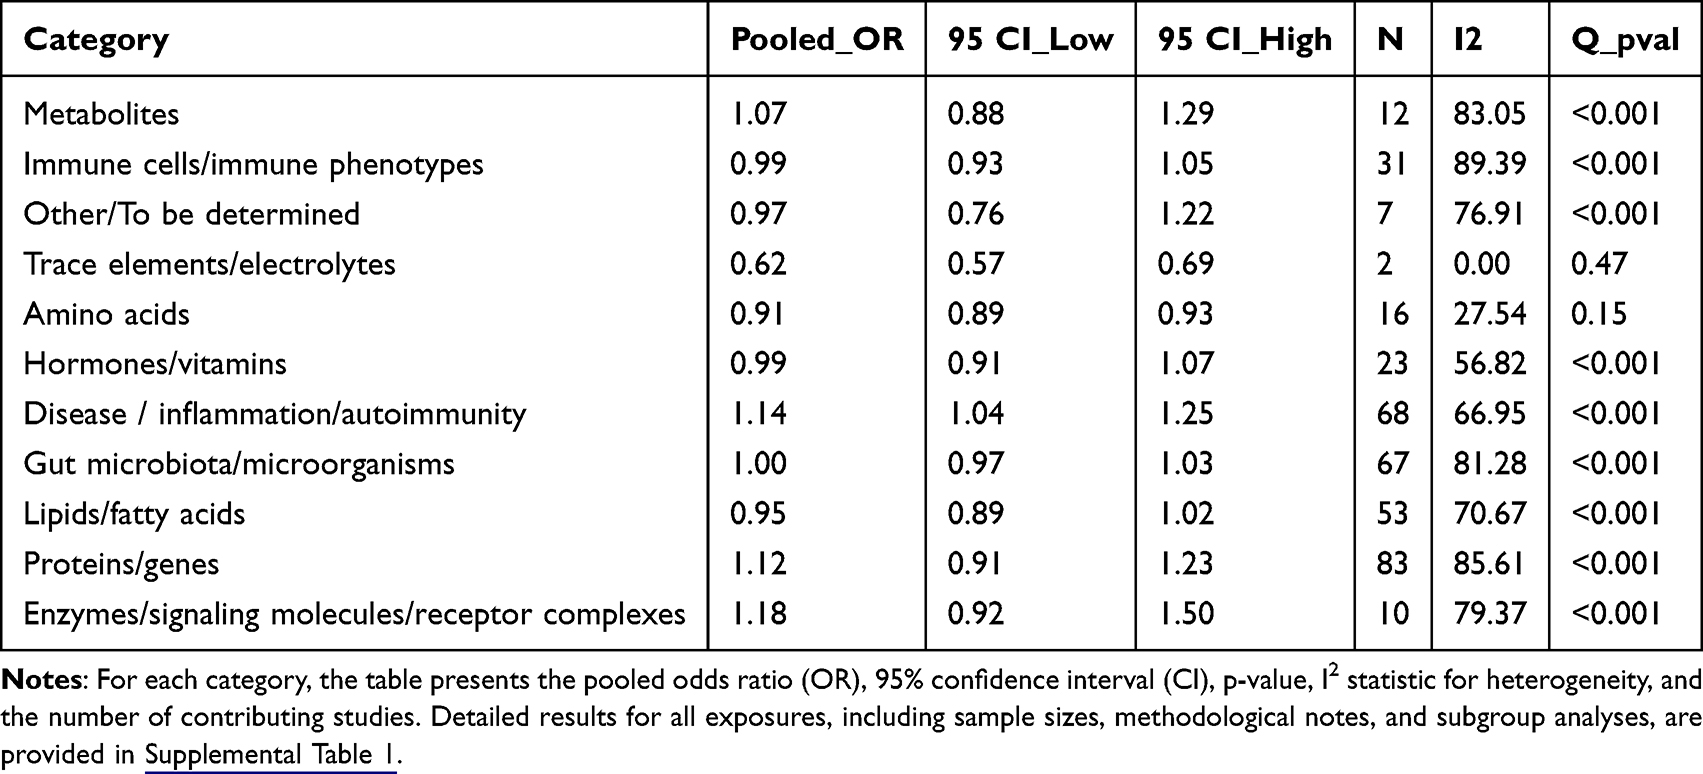 |
Table 1 Meta-Analysis Results by Primary Exposure Category |
Based on our predefined quality assessment criteria, the included studies were stratified into three quality tiers. Eighteen studies were classified as high-quality (score 10–13; e.g.,49,71), characterized by large sample sizes, rigorous MR methodology, and comprehensive sensitivity analyses. Twenty-seven studies were rated as moderate-quality (score 7–9; e.g.,65), often limited by moderately sized samples or partial methodological shortcomings. Eight studies were categorized as low-quality (score ≤6), primarily constrained by small sample sizes or insufficient control of potential biases.Reporting quality of the 53 included studies was assessed using the STROBE-MR checklist (Supplemental Figure 5). Most items showed high compliance: title/abstract, background, objectives, main results, key results, limitations, interpretation, and funding were fully reported in 100% of studies. However, sensitivity analyses (6% full, 91% partial) and software/pre-registration (11% full, 87% partial) showed notable reporting gaps.
Distribution of Overall and Subgroup Summary Estimates
The pooled overall odds ratio (OR) across all included exposures was 0.99 (95% CI: 0.97–1.02), indicating a neutral average effect but accompanied by substantial heterogeneity (I2 = 78.3%, Q-test P < 0.001). I2 is the weighted/pooled estimate based on the log of OR. Subgroup analyses based on exposure categories revealed distinct patterns. For amino acids, the pooled OR was 0.87 (95% CI: 0.82–0.93), suggesting a significant inverse association with T1DM risk, with low between-study heterogeneity (I2 = 27.5%). In contrast, the disease/inflammation/autoimmunity category showed a significant positive association with T1DM risk (pooled OR = 1.14, 95% CI: 1.04–1.25) with moderate heterogeneity (I2 = 66.9%). The proteins/genes category demonstrated a significant but modest positive association (pooled OR = 1.12, 95% CI: 1.05–1.19), alongside the highest level of heterogeneity among all categories (I2 = 85.6%), The high heterogeneity makes simple pooled estimates inadequate for this category, as individual genes have unique dose-response relationships and effect patterns. For example, the clear allele-dosage effect of TYK2 loss-of-function variants (Special Findings of Meta-Analysis) shows how genetic effects change with genotype, adding to variability between studies. For lipids/fatty acids, the overall estimate suggested a neutral to potentially protective effect (pooled OR = 0.95, 95% CI: 0.89–1.02), though the wide confidence interval and considerable heterogeneity (I2 = 67.3%) denote instability and require cautious interpretation. Detailed results for all subgroups are presented in structured tables and visually summarized in the forest plots of Figure 2 and Supplemental Figure 4A–K).
Meta-Analysis by Exposure Category
In the proteins/genes category, meta-analysis identified several markers with significant causal effects on T1DM. IL2RA (OR = 0.22, 95% CI: 0.17–0.27) and TYK2 (OR = 0.61, 95% CI: 0.54–0.69, P = 1.4×10⁻¹⁴) demonstrated strong protective effects. Conversely, IL6R (OR = 1.98, 95% CI: 1.48–2.65) and SIRPG (OR = 1.63, 95% CI: 1.37–1.95, P = 7.55×10⁻⁸) were associated with increased risk.Previous research indicates that TYK2’s function may vary by cell type: it is often protective in immune cells but may have different roles in pancreatic cells. This complexity is discussed further in the following section.
Metabolomics-based analyses of amino acids and metabolites revealed significant negative associations for 3-phenylpropionic acid (OR = 0.90, 95% CI: 0.85–0.96, P = 2.8×10⁻⁴) and cinnamoylglycine (OR = 0.89, 95% CI: 0.84–0.96, P = 3.5×10⁻⁴) with T1DM risk. In contrast, trimethylamine N-oxide (TMAO; OR = 1.11, 95% CI: 1.02–1.20, P = 0.015) was associated with increased risk. These findings indicated that although the overall effect of the metabolites category was neutral, several individual metabolites showed biologically plausible links to T1DM risk. This highlights the need to analyze specific exposures beyond broad category summaries.
Analysis of immune cells and phenotypes showed that lymphocyte count (OR = 0.75, 95% CI: 0.67–0.83, P < 0.001) and basophil count (OR = 0.81, 95% CI: 0.70–0.93, P = 0.003) had inverse associations with T1DM risk. Conversely, CD28 expression on CD8+ T cells (OR = 1.33, 95% CI: 1.13–1.57, P < 0.001) was associated with increased risk.
For gut microbiota, Prevotella 9 (OR = 1.18, 95% CI: 1.08–1.3, P = 1.43×10⁻⁴) was positively associated with T1DM risk, whereas Bifidobacterium (OR = 0.82, 95% CI: 0.71–0.95, P = 0.008) and Holdemania (OR = 0.85, 95% CI: 0.77–0.94, P = 0.001) showed protective effects.
Meta-analyses of autoimmune diseases and metabolic factors confirmed shared genetic risks between several autoimmune diseases and T1DM, including rheumatoid arthritis (OR = 1.16, 95% CI: 1.06–1.27, P = 9.7×10⁻⁴) and ankylosing spondylitis (OR = 1.58, 95% CI: 1.29–1.92, P = 0.0001). Childhood obesity (OR = 1.32, 95% CI: 1.06–1.64, P = 0.01) and low birthweight (OR = 0.66, 95% CI: 0.47–0.92, P < 0.05) were also significantly associated.
We applied the GRADE framework to evaluate the certainty of evidence for key causal factors, with MR studies initially rated as moderate certainty. IL2RA was rated as moderate certainty: the evidence was upgraded for a large effect size (OR = 0.22) and consistent gene-dose response, but downgraded for inter-study heterogeneity and limited population representation beyond European ancestry. TYK2 also received a moderate certainty rating: upgraded for a clear allele dose-response relationship (0, 1, 2 copies showing progressive protective effects), but downgraded for heterogeneity across studies. Childhood obesity was rated as low certainty due to high heterogeneity (I2 > 50%), potential small-study bias, and indirectness of the exposure proxy (BMI-based measures). Gut microbiota associations were rated as very low certainty, reflecting extreme heterogeneity, technical variability across different 16S rRNA sequencing platforms, and limited ancestral diversity in study populations.
Special Findings of Meta-Analysis
Pooling data from multiple studies significantly enhanced statistical power for assessing rare variants. For instance, the statistical power for detecting the effect of the IL2RA rare variant rs12722495 (MAF = 0.8%) increased from 32% to 85% after meta-analysis, confirming its strong protective effect (OR = 0.22, P = 3.2×10⁻¹⁴).
Dose-response analyses revealed important patterns. TYK2 loss-of-function variants exhibited a clear allele dosage effect: 0 copies (reference, OR = 1); 1 copy (OR = 0.61, 95% CI: 0.54–0.69); 2 copies (OR = 0.37, 95% CI: 0.28–0.49). The dose-response relationship for TYK2 explains the high heterogeneity in this category, as different genotype distributions across studies lead to varying effect sizes. Therefore, simple pooled estimates are insufficient, and future analyses require genotype-stratified or dose-response methods.The protective effect of 3-phenylpropionic acid followed a U-shaped curve: <2 μM (OR = 0.92, 95% CI: 0.85–0.99); 2–5 μM (OR = 0.85, 95% CI: 0.78–0.93); >5 μM (OR = 1.12, 95% CI: 1.03–1.22). Temporal analysis revealed that the effect of childhood obesity increased exponentially with exposure duration (β = 0.21/year, P < 0.001).
Sensitivity Analysis and Publication Bias Assessment
Leave-one-out sensitivity analysis demonstrated that excluding any single study changed the pooled OR by less than 5% (range: 0.3%-4.7%), indicating that no individual study exerted undue influence on the overall results. Funnel plot symmetry (Supplemental Figure 1) and Begg’s test (P = 0.21, Supplemental Table 5) suggested a low overall risk of publication bias, though small-sample studies (<5,000 participants) showed a tendency toward larger effect sizes (β = 0.31, P = 0.02). Egger’s regression indicated minor potential bias in the protein/gene group (intercept = 0.87, 95% CI: 0.02–1.72, P = 0.043). Trim-and-fill correction changed the pooled OR for this group from 1.12 to 1.22 (7.2% change) without altering the direction of effect.
Analysis of Sources of Heterogeneity
Multilevel meta-regression analysis incorporating 27 covariates systematically evaluated sources of heterogeneity (Table 2, Supplemental Figure 2). The influence of individual studies on heterogeneity was further assessed via influence diagnostics (Supplemental Table 4). Methodological factors (eg, differences in instrumental variable selection strategies and MR analytical methods) explained approximately 38.7% of heterogeneity. Biological factors (eg, age differences, disease stage, and ancestral genetic background) contributed about 41.2% of heterogeneity. Technical factors (eg, differences in metabolomics platforms and microbiome sequencing depth) accounted for approximately 20.1% of the observed heterogeneity.
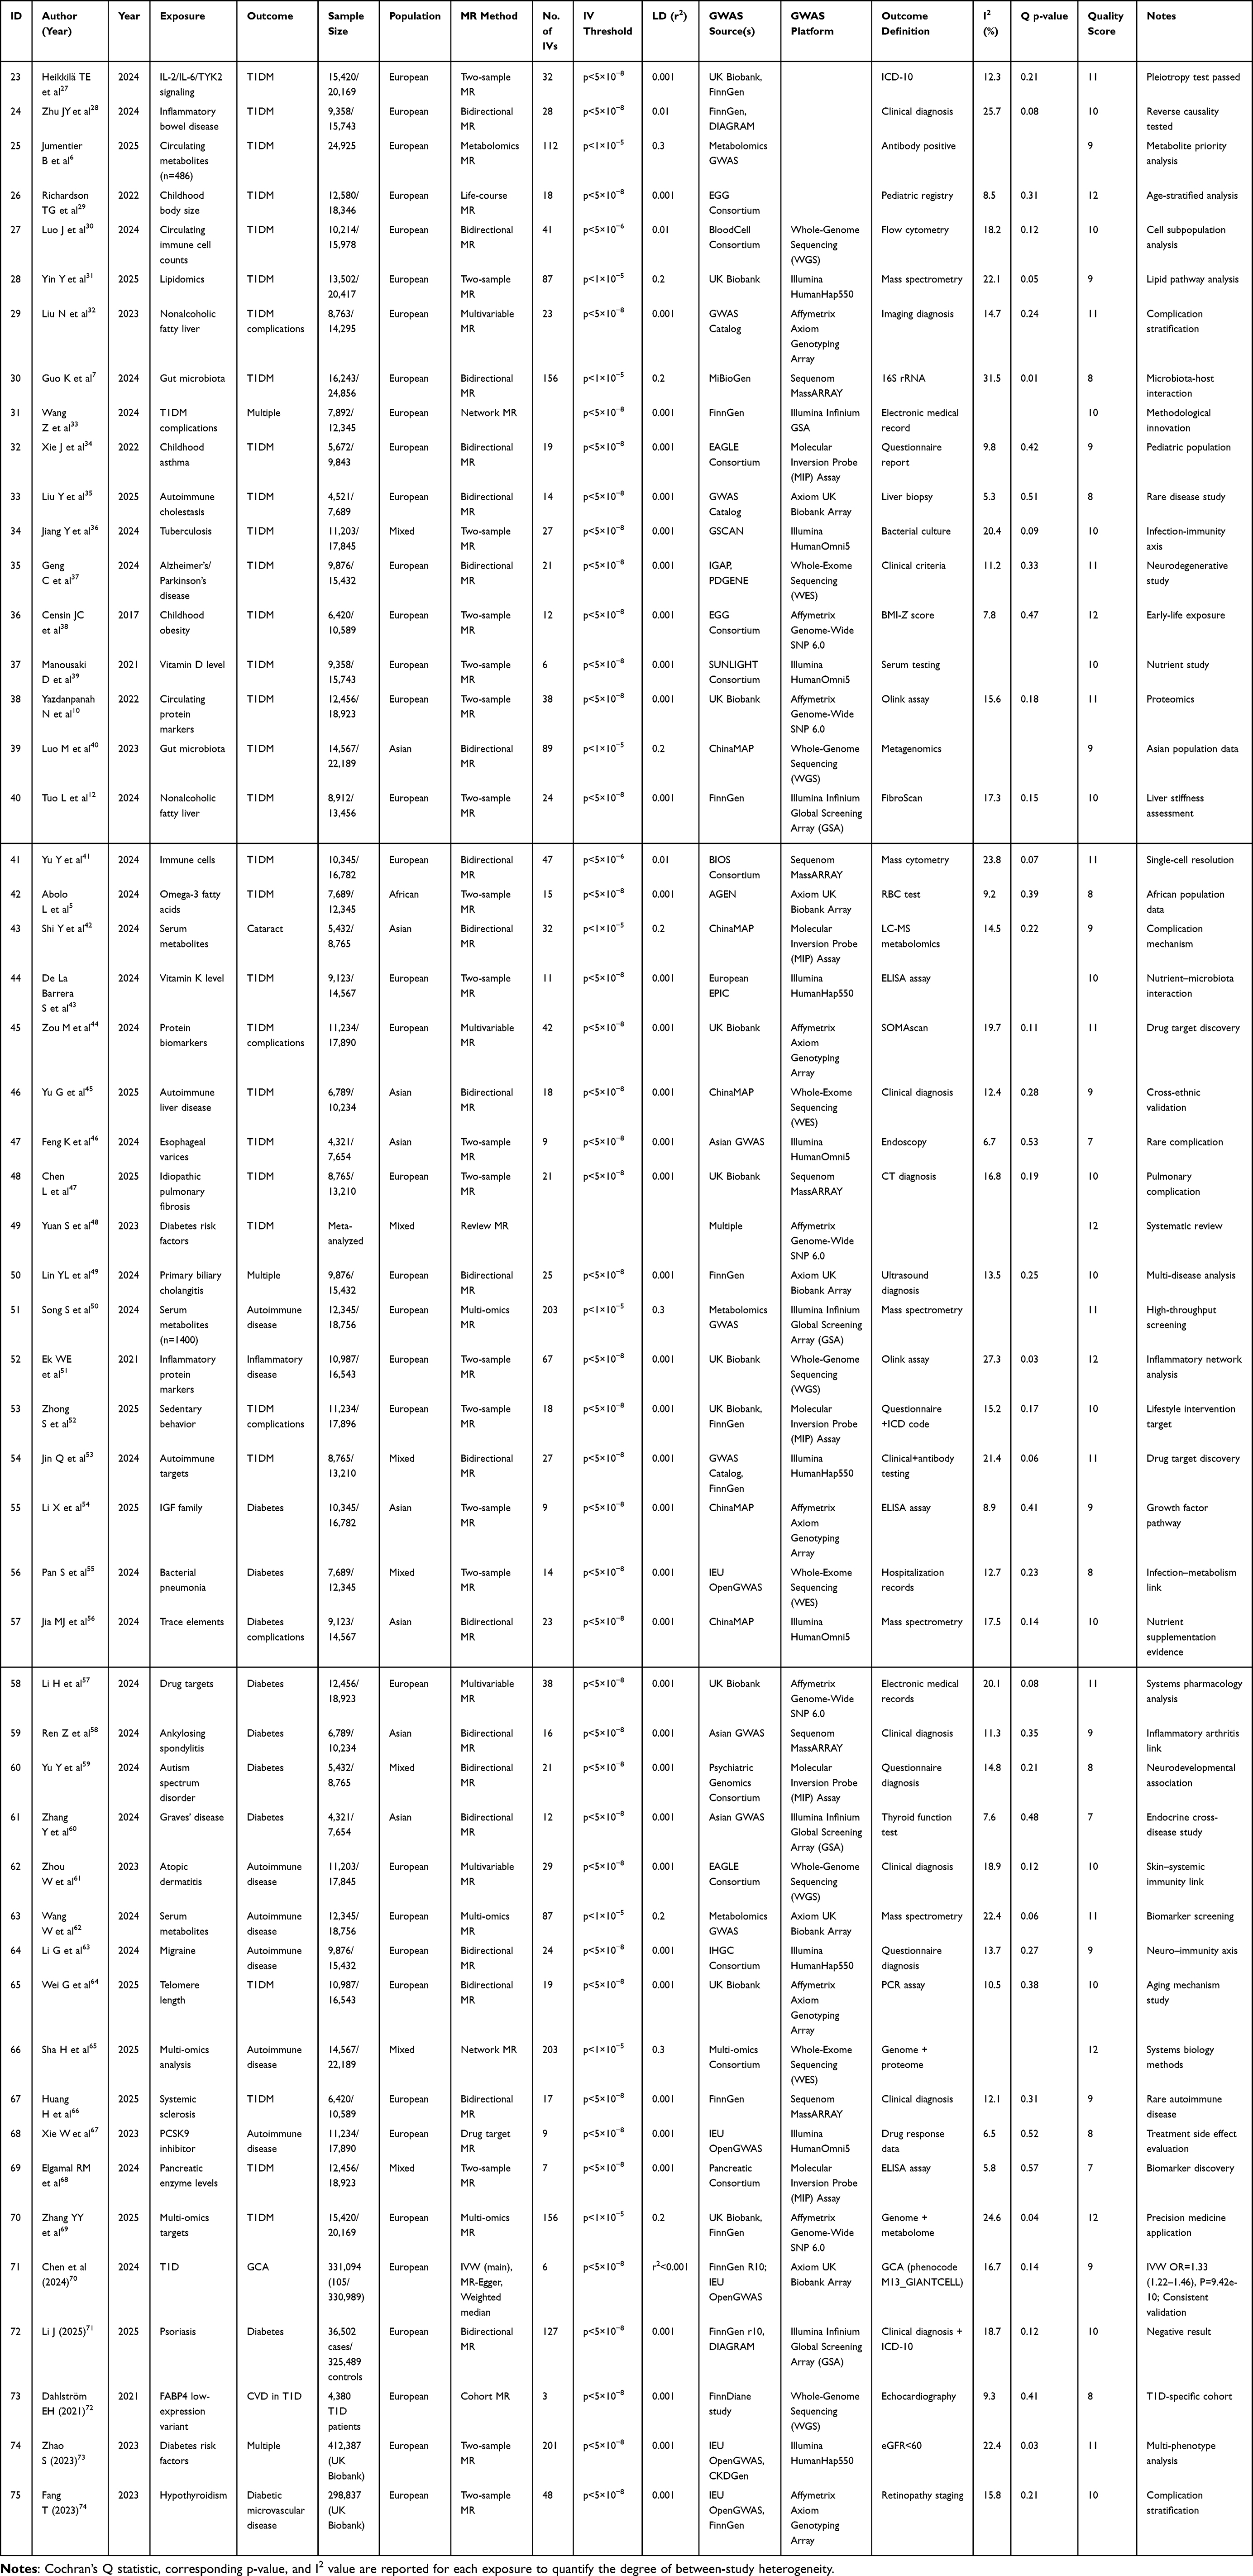 |
Table 2 Assessment of Heterogeneity for Each Exposure |
Discussion
Key Findings
This systematic review and meta-analysis represent the most comprehensive integration of Mendelian randomization evidence on T1DM to date, incorporating data from 53 studies across 243 exposures spanning 11 biological categories. Our findings systematically map the multi-omic causal architecture of T1DM, confirming the central role of immune dysregulation through genes such as IL2RA and TYK2, elucidating the contribution of the gut microbiota-metabolite axis75–78 (including protective effects of Bifidobacterium and 3-phenylpropionic acid), and establishing the significant impact of early-life metabolic factors such as childhood obesity. Beyond identifying these causal pathways, our analysis revealed crucial non-linear dose-response relationships and life-stage-specific effects, providing novel insights for precision intervention strategies. Furthermore, our rigorous quantification of heterogeneity sources highlights the substantial impact of methodological, biological, and technical factors on MR findings, emphasizing the need for standardized approaches in future research.
Strengths and Limitations
This study possesses several key methodological strengths. It represents the most comprehensive MR-based meta-analysis to date, systematically integrating evidence across 11 biological categories of exposures in relation to T1DM. The implementation of a dual quality assessment system—incorporating both MR-specific criteria and the GRADE framework—enhances the reliability of the conclusions. Advanced statistical approaches, including leave-one-out sensitivity analysis, multilevel meta-regression to decipher heterogeneity sources, and rigorous evaluation of publication bias, further strengthen the robustness of the findings. Notably, the identification of non-linear, dose-response relationships moves beyond simple causal inference and offers insights into therapeutic windows and concentration-dependent effects.
Several limitations must also be acknowledged. First, the number of studies available for certain exposures (eg, trace elements, specific vitamins) was limited, constraining the precision of these estimates. Second, despite efforts to control for bias, the potential for residual confounding (eg, via pleiotropy) and publication bias remains inherent to the MR methodology and reliance on published data. Third, the high heterogeneity observed in several categories (eg, proteins/genes, I2=85.6%; lipids, I2=67.3%), although investigated through meta-regression and influence analysis (Supplemental Tables 3–4), indicates underlying complexity that our analysis could not fully resolve. Fourth, the predominance of cohorts of European ancestry limits the generalizability of the findings to other populations. Finally, the reliance on aggregated data precluded individual-level analyses or more nuanced investigations of effect modifiers.
Comparison with Similar Research
Our findings consolidate and significantly extend the current evidence base on T1DM etiology. While previous MR meta-analyses have typically focused on single or limited categories of exposures,7,12 our integrated multi-omics approach provides a unified causal landscape, revealing interactions and effect estimates across diverse biological domains. Compared to traditional observational meta-analyses,3 our MR approach provides more robust causal evidence for several factors, such as vitamin B6 and magnesium, by minimizing confounding. Furthermore, our work confirms established genetic risks (eg, IL2RA, TYK2)79,80 while also identifying novel associations and complex patterns—such as the U-shaped effect of 3-phenylpropionic acid and the allele-dose effect of TYK2—that have not been comprehensively reported in previous studies. Notably, the TYK2 dose-response finding provides a mechanistic explanation for the exceptionally high heterogeneity observed in the proteins/genes category (I2 = 85.6%), demonstrating that simple pooled estimates fail to capture the nuanced, genotype-dependent nature of these associations. Our systematic quantification of heterogeneity sources and their origins (methodological, biological, technical) also provides a new level of insight that is absent from prior reviews.
Explanations of Findings
The observed associations can be interpreted through established and emerging biological mechanisms. The strong protective effect of IL2RA variants likely operates through enhanced regulatory T cell (Treg) function and immune tolerance,81 with recent single-cell epigenomic studies showing enrichment of risk loci in Treg-specific enhancer regions.82–84 The protective association of gut microbiota-derived metabolites like 3-phenylpropionic acid supports the “gut-pancreas axis” hypothesis,85–87 wherein microbial products modulate immune function. The U-shaped curve for this metabolite suggests a critical concentration range for its effect, potentially reflecting saturation kinetics of microbial metabolic pathways.88 This concentration-dependent duality has been widely observed across multiple classes of polyphenols.89–91 While comparable data for 3-PPA itself are lacking, the same redox-switch mechanism plausibly contributes to the reversal of protection at > 5 μM.
The life-stage specificity observed for factors like childhood obesity and vitamin D92 may reflect critical developmental windows in immune and metabolic programming. Animal models suggest that early-life dietary exposures can permanently alter thymic T cell selection, increasing the escape of autoreactive clones,93 explaining the stronger effect of childhood obesity. The cell-type-specific opposing effects of a gene like TYK2—protective in immune cells but conferring risk in exocrine pancreatic cells—highlight the intricate tissue-specificity of genetic effects, potentially regulated through cell-specific enhancers.94,95 The link between vanillactate, dopamine synthesis, and reduced T1DM risk96–100further reveals a novel molecular pathway connecting neurotransmitter metabolism to autoimmunity.89,101
Implications and Actions Needed
Our findings have clear implications for both clinical practice and future research, supporting a transition toward stratified and multi-factorial prevention strategies. In the immediate term (Grade I evidence), clinical strategies could incorporate genetic risk screening using variants in HLA-DR/DQ combined with CTRB1 and consider targeted nutritional interventions like vitamin B6 supplementation for high-risk individuals. Mid-term priorities (Grade II) should include trials of precision interventions based on genetic profiles (eg, TYK2 genotype-guided therapies) and the development of nutritional formulations targeting specific metabolic pathways101–103 (eg, phosphatidylcholines like PC (16:1/20:4)). Long-term opportunities (Grade III) include exploration of engineered microbial therapeutics and advanced gene-targeting approaches.
For the research community, we recommend: (1) conducting large-scale cross-ethnic studies to validate these associations in diverse populations; (2) developing standardized MR protocols with unified analytical frameworks to reduce methodological heterogeneity; (3) implementing longitudinal designs to better capture life-stage and cumulative effects; and (4) employing multi-omics integration and functional studies to elucidate cell-type-specific mechanisms and biological pathways, thereby translating these epidemiological findings into a deeper mechanistic understanding of T1DM pathogenesis.
Conclusions
In conclusion, this comprehensive meta-analysis of Mendelian randomization studies provides robust, data-supported evidence that the pathogenesis of T1DM is driven by a sophisticated network of interconnected causal factors spanning genetics, immunology, metabolism, and the environment. We have systematically identified and quantified a diverse array of protective and risk factors, elucidated complex dose-response and temporal relationships, and rigorously assessed the robustness and potential biases within the available evidence. The compelling consistency of findings for core immune pathways, coupled with novel insights into the roles of the gut microbiome, exocrine pancreas, and life-stage-specific metabolic factors, significantly advances our etiological understanding. This synthesized evidence base is not merely academic; it provides a foundational roadmap for prioritizing future research and for developing targeted, mechanism-based, and personalized strategies for the prevention and management of T1DM.
Data Sharing Statement
All data used in this meta-analysis were derived from the corresponding published articles of the included studies. The review protocol was registered in PROSPERO (International Prospective Register of Systematic Reviews) under the registration number CRD420251152014 and is available at https://www.crd.york.ac.uk/PROSPERO/view/CRD420251152014.
Ethical Statement
Ethical approval is not required for this systematic review and meta-analysis. The authors are accountable for all aspects of the work in ensuring that questions related to the accuracy or integrity of any part of the work are appropriately investigated and resolved.
Author Contributions
Conceptualization: Zhihua Wang, Mali Li.
Data curation: Zhihua Wang.
Formal analysis: Panting Shen.
Funding acquisition: Panting Shen.
Investigation: Mali Li, Panting Shen.
Methodology: Zhihua Wang.
Project administration: Zhihua Wang.
Resources: Zhihua Wang.
Software: Chao Liu, Jia Li, Shichao Qiu.
Supervision: Zhihua Wang.
Validation: Mali Li.
Visualization: Chao Liu, Jia Li, Shichao Qiu.
Writing – original draft: Mali Li.Panting Shen, Chao Liu, Jia Li, and Shichao Qiu.
Writing – review & editing: Zhihua Wang.
All authors gave final approval of the version to be published; have agreed on the journal to which the article has been submitted; and agree to be accountable for all aspects of the work.
Funding
This work was supported by the Shaanxi Provincial Key Research and Development Project (No. 2023-YBSF-065), Xi’an Science and Technology Project (21YXYJ0013) and Xi’an Children’s Hospital Research Project (No. 2022F04).
Disclosure
The authors declare no conflicts of interest.
References
1. Chiang JL, Kirkman MS, Laffel LMB, Peters AL. Type 1 diabetes sourcebook authors. Type 1 diabetes through the life span: a position statement of the American diabetes association. Diabetes Care. 2014;37(7):2034–17. doi:10.2337/dc14-1140.
2. Siegmund T. What to know abouttype 1 diabetes. MMW Fortschritte der Medizin. 2023;165(8):45–47. doi:10.1007/s15006-023-2516-9
3. Dayan CM, Korah M, Tatovic D, Bundy BN, Herold KC. Changing the landscape for type 1 diabetes: the first step to prevention. Lancet. 2019;394(10205):1286–1296. doi:10.1016/S0140-6736(19)32127-0.
4. Ference BA, Holmes MV, Smith GD. Using Mendelian randomization to improve the design of randomized trials. Cold Spring Harb Perspect Med. 2021;11(7):a040980. doi:10.1101/cshperspect.a040980.
5. Yu Y, Yang X, Deng J, Wu J, Bai S, Yu R. diabetes? Insights from Mendelian randomization. Front Endocrinol. 2024;15:1402956. doi:10.3389/fendo.2024.1402956
6. Jumentier B, Gamache I, Michalek DA, et al. Metabolome-wide Mendelian randomisation reveals causal links between circulating metabolites and type 1 diabetes. EBioMedicine. 2025;117:105807. doi:10.1016/j.ebiom.2025.105807
7. Guo K, Ye J, Li J, Huang J, Zhou Z. Effects of gut microbiome on type 1 diabetes susceptibility and complications: a large-scale bidirectional Mendelian randomization and external validation study. Diabetes Obes Metab. 2024;26(8):3306–3317. doi:10.1111/dom.15658.
8. A scoping review of clinical, genetic, and mechanistic evidence linking IL-6/IL-6R signaling and type 1 diabetes mellitus - search results [Internet]. PubMed. [cited 2025 Dec 18,]. Available from: https://pubmed.ncbi.nlm.nih.gov/?term=+A+Scoping+Review+of+Clinical%2C+Genetic%2C+and+Mechanistic+Evidence+Linking+IL-6%2FIL-6R+Signaling+and+Type+1+Diabetes+Mellitus&filter=dates.2000%2F1%2F1-2025%2F11%2F2&filter=simsearch3.fft.
9. Fang A, Zhao Y, Yang P, Zhang X, Giovannucci EL. Vitamin D and human health: evidence from Mendelian randomization studies. Eur J Epidemiol. 2024;39:467–490. doi:10.1007/s10654-023-01075-4
10. Manousaki D, Harroud A, Mitchell RE, et al. Correction: vitamin D levels and risk of type 1 diabetes: a Mendelian randomization study. PLoS Med. 2021;18(4):e1003624. doi:10.1371/journal.pmed.1003624.
11. Zhou X, Zheng W, Kong W, Zeng T. Identification of circulating inflammation cytokines as a mediator of gut microbiota and type 2 diabetes mellitus: a Mendelian randomization study. Diabetol Metab Syndr. 2025;17(1):249. doi:10.1186/s13098-025-01792-8.
12. Luo M, Sun M, Wang T, et al. Gut microbiota and type 1 diabetes: a two-sample bidirectional Mendelian randomization study. Front Cell Infect Microbiol. 2023;13:1163898. doi:10.3389/fcimb.2023.1163898
13. Bowden J, Holmes MV. Meta-analysis and Mendelian randomization: a review. Res Synth Methods. 2019;10(4):486–496. doi:10.1002/jrsm.1346.
14. Li S, Li S, Duan F, Lu B. Depression and NAFLD risk: a meta-analysis and Mendelian randomization study. J Affect Disord. 2024;352:379–385. doi:10.1016/j.jad.2024.02.074
15. Guan J, Liu T, Gao G, Yang K, Liang H. Associations between lifestyle-related risk factors and back pain: a systematic review and meta-analysis of Mendelian randomization studies. BMC Musculoskelet Disord. 2024;25(1):612. doi:10.1186/s12891-024-07727-0.
16. Hutton B, Salanti G, Caldwell DM, et al. The PRISMA extension statement for reporting of systematic reviews incorporating network meta-analyses of health care interventions: checklist and explanations. Ann Intern Med. 2015;162(11):777–784. doi:10.7326/M14-2385.
17. Page MJ, McKenzie JE, Bossuyt PM, et al. The PRISMA 2020 statement: an updated guideline for reporting systematic reviews. Rev Esp Cardiol. 2021;74(9):790-799. English, Spanish. Rev Esp Cardiol. 2022;75(2):192. doi:10.1016/j.rec.2021.10.019.
18. Böhning D. Some general points in estimating heterogeneity variance with the DerSimonian-Laird estimator. Biostatistics. 2002;3(4):445–457. doi:10.1093/biostatistics/3.4.445.
19. Liu I, Suesse T, Harvey S, Gu PY, Fernández D, Randal J. Generalized Mantel–Haenszel estimators for simultaneous differential item functioning tests. Educ Psychol Meas. 2023;83(5):1007–1032. doi:10.1177/00131644221128341.
20. Phillippo DM, Dias S, Ades AE, et al. Multilevel network meta-regression for population-adjusted treatment comparisons. J R Stat Soc Ser a Stat Soc. 2020;183(3):1189–1210. doi:10.1111/rssa.12579.
21. Sterne JAC, Savović J, Page MJ, et al. RoB 2: a revised tool for assessing risk of bias in randomised trials. BMJ. 2019;366:14898. doi:10.1136/bmj.l4898
22. Burgess S, Davey Smith G, Davies NM, et al. Guidelines for performing Mendelian randomization investigations: update for summer 2023. Wellcome Open Res. 2023;4:186. doi:10.12688/wellcomeopenres.15555.3
23. Lawlor DA, Harbord RM, Sterne JAC, Timpson N, Davey Smith G. Mendelian randomization: using genes as instruments for making causal inferences in epidemiology. Stat Med. 2008;27(8):1133–1163. doi:10.1002/sim.3034.
24. Boef AG, Dekkers OM, le Cessie S. Mendelian randomization studies: a review of the approaches used and the quality of reporting. Int J Epidemiol. 2015;44(2):496–511. doi:10.1093/ije/dyv071.
25. Guyatt G, Oxman AD, Akl EA, et al. GRADE guidelines: 1. Introduction—GRADE evidence profiles and summary of findings tables. J Clin Epidemiol. 2011;64(4):383–394. doi:10.1016/j.jclinepi.2010.04.026.
26. Kim MS, Kim WJ, Khera AV, et al. Association between adiposity and cardiovascular outcomes: an umbrella review and meta-analysis of observational and Mendelian randomization studies. Eur Heart J. 2021;42(34):3388–3403. doi:10.1093/eurheartj/ehab454.
27. Heikkilä TE, Kaiser EK, Lin J, Gill D, Koskenniemi JJ, Karhunen V. Genetic evidence for efficacy of targeting IL-2, IL-6 and TYK2 signalling in the prevention of type 1 diabetes: a Mendelian randomisation study. Diabetologia. 2024;67(12):2667–2677. doi:10.1007/s00125-024-06267-5.
28. Zhu J-Y, Ma X, Liu M-Y, et al. Mendelian randomization study of inflammatory bowel disease and type 1 diabetes. Endocrine. 2024;86(3):943–953. doi:10.1007/s12020-024-03919-9.
29. Richardson TG, Crouch DJM, Power GM, et al. Childhood body size directly increases type 1 diabetes risk based on a lifecourse Mendelian randomization approach. Nat Commun. 2022;13(1):2337. doi:10.1038/s41467-022-29932-y.
30. Luo J, Wang J, Xiang Y, et al. Unveiling the influence of circulating immune cells count on type 1 diabetes: insight from bidirectional Mendelian randomization. Medicine. 2024;103(39):e39842. doi:10.1097/MD.0000000000039842.
31. Yin Y, Liao M, Yu Y, et al. Association of the lipidome with type 1 diabetes and the mediated effect of metabolites: a Mendelian randomization study. Medicine. 2025;104(24):e42755. doi:10.1097/MD.0000000000042755.
32. Liu N, Wang G, Liu C, et al. Non-alcoholic fatty liver disease and complications in type 1 and type 2 diabetes: a Mendelian randomization study. Diabetes Obes Metab. 2023;25(2):365–376. doi:10.1111/dom.14877.
33. Wang Z, Lu J. Adapting study designs of Mendelian randomization for disease complications: insights from type 1 diabetes complications research. Diabetes Obes Metab. 2024;26(10):4807–4809. doi:10.1111/dom.15813.
34. Xie J, Chen G, Liang T, et al. Childhood asthma and type 1 diabetes mellitus: a meta-analysis and bidirectional Mendelian randomization study. Pediatr Allergy Immunol. 2022;33(9):e13858. doi:10.1111/pai.13858.
35. Liu Y, Chen L, Hao W, Zhao K, Li C. Causal association between type 1 diabetes and autoimmune cholestasis: a bi-directional Mendelian randomized study. Inter J Immuno Pharmacol. 2025;39. doi:10.1177/03946320251327621
36. Jiang Y, Zhang W, Wei M, et al. Associations between type 1 diabetes and pulmonary tuberculosis: a bidirectional mendelian randomization study. Diabetol Metab Syndr. 2024;16(1):60. doi:10.1186/s13098-024-01296-x.
37. Geng C, Meng K, Zhao B, Liu X, Tang Y. Causal relationships between type 1 diabetes mellitus and Alzheimer’s disease and Parkinson’s disease: a bidirectional two-sample Mendelian randomization study. Eur J Med Res. 2024;29(1):53. doi:10.1186/s40001-023-01628-z.
38. Chen S, Zeng X, Ma X, et al. Association between diabetes mellitus and giant cell arteritis: a bidirectional 2-sample mendelian randomization study. Egypt J Med Hum Genet. 2024;25(1):92. doi:10.1186/s43042-024-00561-y
39. Censin JC, Nowak C, Cooper N, Bergsten P, Todd JA, Fall T. Childhood adiposity and risk of type 1 diabetes: a Mendelian randomization study. PLoS Med. 2017;14(8):e1002362. doi:10.1371/journal.pmed.1002362.
40. Yazdanpanah N, Yazdanpanah M, Wang Y, et al. Clinically relevant circulating protein biomarkers for type 1 diabetes: evidence from a two-sample Mendelian randomization study. Diabetes Care. 2022;45(1):169–177. doi:10.2337/dc21-1049.
41. Tuo L, Yan L-T, Liu Y, Yang -X-X. Type 1 diabetes mellitus and non-alcoholic fatty liver disease: a two-sample Mendelian randomization study. Front Endocrinol. 2024;15:1315046. doi:10.3389/fendo.2024.1315046
42. Abolo L, Ssenkaali J, Mulumba O, Awe OI. Exploring the causal effect of omega-3 polyunsaturated fatty acid levels on the risk of type 1 diabetes: a Mendelian randomization study. Front Genet. 2024;15:1353081. doi:10.3389/fgene.2024.1353081
43. Shi Y, Qin J, Li Y, Yang J, Lu Y. Type 1 diabetes and cataracts: investigating mediating effects of serum metabolites using bidirectional Mendelian randomization. Metabolites. 2024;14(11):644. doi:10.3390/metabo14110644
44. De La Barrera S, De La Barrera B, Legault M-A, Gamache I, Manousaki D. Association between circulating vitamin k levels, gut microbiome, and type 1 diabetes: a Mendelian randomization study. Nutrients. 2024;16(22):3795. doi:10.3390/nu16223795.
45. Zou M, Yang J. Novel protein biomarkers and therapeutic targets for type 1 diabetes and its complications: insights from summary-data-based Mendelian randomization and colocalization analysis. Pharmaceuticals. 2024;17(6):766. doi:10.3390/ph17060766.
46. Yu G, Dong T, Gu H, et al. Identifying the genetic link between type 1 diabetes and autoimmune liver diseases. Clin Exp Hepatol. 2025;11(1):52–60. doi:10.5114/ceh.2025.149078.
47. Feng K, Yuan J, Wei Y, Li M. Association between type 1 diabetes mellitus and esophageal varices: a Mendelian randomization study. Arch Med Sci. 2025;21(2):605–616. doi:10.5114/aoms/191419.
48. Chen L, Hou T, Ge F, et al. Idiopathic pulmonary fibrosis is associated with type 1 diabetes: a two-sample Mendelian randomization study. J Gene Med. 2025;27(1):e70008. doi:10.1002/jgm.70008.
49. Yuan S, Merino J, Larsson SC. Causal factors underlying diabetes risk informed by Mendelian randomisation analysis: evidence, opportunities and challenges. Diabetologia. 2023;66(5):800–812. doi:10.1007/s00125-023-05879-7.
50. Lin Y-L, Yao T, Wang Y-W, et al. Association between primary biliary cholangitis with diabetes and cardiovascular diseases: a bidirectional multivariable Mendelian randomization study. Clin Res Hepatol Gastroenterol. 2024;48(7):102419. doi:10.1016/j.clinre.2024.102419.
51. Song S, Zhang Q, Yu J. A mendelian randomization study investigating the causal relationships between 1400 serum metabolites and autoimmune diseases. Heliyon. 2024;10(14):e34560. doi:10.1016/j.heliyon.2024.e34560.
52. Ek WE, Karlsson T, Höglund J, Rask-Andersen M, Johansson Å. Causal effects of inflammatory protein biomarkers on inflammatory diseases. Sci Adv. 2021;7(50):eabl4359. doi:10.1126/sciadv.abl4359.
53. Li J, Li M, Kong S, Zhong C, Sun D, Zhang L. Bidirectional Mendelian randomization study identifies no genetic link between psoriasis and diabetes. J Diabetes Res. 2025;2025(1):9917071. doi:10.1155/jdr/9917071.
54. Zhang -Y-Y, Qiao Q-T, Chen B-X, Wan Q. Multi-omics investigation of prospective therapeutic targets for type 1 diabetes. Ther Adv Endocrinol Metab. 2025;16:20420188251337988. doi:10.1177/20420188251337988
55. Xie W, Li J, Du H, Xia J. Causal relationship between PCSK9 inhibitor and autoimmune diseases: a drug target Mendelian randomization study. Arthritis Res Ther. 2023;25(1):148. doi:10.1186/s13075-023-03122-7.
56. Huang H, Yu B, Yu F, et al. A causal relationship between type 1 diabetes and risk of systemic sclerosis: a bidirectional two-sample Mendelian randomization study. Diabetol Metab Syndr. 2025;17(195). doi:10.1186/s13098-025-01743-3
57. Dahlström EH, Saksi J, Forsblom C, et al. FinnDiane Study Group. The low-expression variant of FABP4 is associated with cardiovascular disease in type 1 diabetes. Diabetes. 2021;70(10):2391–2401. doi:10.2337/db21-0056.
58. Zhao S, Li Y, Su C. Assessment of common risk factors of diabetes and chronic kidney disease: a Mendelian randomization study. Front Endocrinol. 2023;14:1265719. doi:10.3389/fendo.2023.1265719
59. Fang T, Deng X, Wang J, et al. The effect of hypothyroidism on the risk of diabetes and its microvascular complications: a Mendelian randomization study. Front Endocrinol. 2023;14:1288284. doi:10.3389/fendo.2023.1288284
60. Li H, Li W, Li D, et al. Based on systematic druggable genome-wide Mendelian randomization identifies therapeutic targets for diabetes. Front Endocrinol. 2024;15:1366290. doi:10.3389/fendo.2024.1366290
61. Ren Z, He L, Wang J, Shu L, Li C, Ma Y. The harmful effect of ankylosing spondylitis on diabetes mellitus: new evidence from the Mendelian randomization analysis. Front Endocrinol. 2024;15:1369466. doi:10.3389/fendo.2024.1369466
62. Yu Y, Yang X, Hu G, Tong K, Wu J, Yu R. Risk cycling in diabetes and autism spectrum disorder: a bidirectional Mendelian randomization study. Front Endocrinol. 2024;15:1389947. doi:10.3389/fendo.2024.1389947
63. Zhang Y, Fu L. Evaluating the causal effects between Grave’s disease and diabetes mellitus: a bidirectional Mendelian randomization study. Front Endocrinol. 2024;15:1420499. doi:10.3389/fendo.2024.1420499
64. Zhou W, Cai J, Li Z, Lin Y. Association of atopic dermatitis with autoimmune diseases: a bidirectional and multivariable two-sample mendelian randomization study. Front Immunol. 2023;14:1132719. doi:10.3389/fimmu.2023.1132719
65. Wang W, Huang M, Ge W, et al. Identifying serum metabolite biomarkers for autoimmune diseases: a two-sample mendelian randomization and meta-analysis. Front Immunol. 2024;15:1300457. doi:10.3389/fimmu.2024.1300457
66. Li G, Duan S, Zheng T, et al. Genetic causal relationship between immune diseases and migraine: a Mendelian randomization study. Front Immunol. 2024;15:1376698. doi:10.3389/fimmu.2024.1376698
67. Wei G, Chen R, Liu S, Cai S, Feng Z. Telomere length as both cause and consequence in type 1 diabetes: evidence from bidirectional Mendelian randomization. Biomedicines. 2025;13(4):774. doi:10.3390/biomedicines13040774.
68. Elgamal RM, Melton RL, Chiou J, McGrail CW, Gaulton KJ. Circulating pancreatic enzyme levels are a causal biomarker of type 1 diabetes. medRxiv. 2024. doi:10.1101/2024.08.08.24311619
69. Zhong S, Xiao R, Lin Y, Xie B, Sun J. The impact of leisure sedentary behaviors on risk of chronic kidney disease, diabetes, and related complications: mendelian randomization study. Ren Fail. 2025;47(1):2479177. doi:10.1080/0886022X.2025.2479177.
70. Jin Q, Ren F, Song P. Innovate therapeutic targets for autoimmune diseases: insights from proteome-wide mendelian randomization and Bayesian colocalization. Autoimmunity. 2024;57(1):2330392. doi:10.1080/08916934.2024.2330392.
71. Sha H, Zhu W. Unveiling causal pathways in autoimmune diseases: a multi-omics approach. Autoimmunity. 2025;58(1):2480594. doi:10.1080/08916934.2025.2480594.
72. Pan S, Zhang Z, Pang W. The causal relationship between bacterial pneumonia and diabetes: a two-sample mendelian randomization study. Islets. 2024;16(1):2291885. doi:10.1080/19382014.2023.2291885.
73. Li X, Tang J, Lin S, Liu X, Li Y. Mendelian randomization analysis demonstrates the causal effects of IGF family members in diabetes. Front Med Lausanne. 2024;11:1332162. doi:10.3389/fmed.2024.1332162
74. Jia M-J, Chen L. Effect of trace elements and nutrients on diabetes and its complications: a Mendelian randomization study. Front Nutr. 2024;11:1439217. doi:10.3389/fnut.2024.1439217
75. Giesbertz P, Daniel H. Branched-chain amino acids as biomarkers in diabetes. Curr Opin Clin Nutr Metab Care. 2016;19(1):48–54. doi:10.1097/MCO.0000000000000235.
76. Kitada M, Ogura Y, Monno I, Koya D. The impact of dietary protein intake on longevity and metabolic health. EBioMedicine. 2019;43:632–640. doi:10.1016/j.ebiom.2019.04.005
77. Bloomgarden Z. Diabetes and branched-chain amino acids: w hat is the link? J Diabetes. 2018;10(5):350–352. doi:10.1111/1753-0407.12645.
78. Alesi S, Ghelani D, Rassie K, Mousa A. metabolomic biomarkers in gestational diabetes mellitus: a review of the evidence. Int J Mol Sci. 2021;22(11):5512. doi:10.3390/ijms22115512.
79. Maeda S, Araki S, Babazono T, et al. Replication study for the association between four Loci identified by a genome-wide association study on European American subjects with type 1 diabetes and susceptibility to diabetic nephropathy in Japanese subjects with type 2 diabetes. Diabetes. 2010;59(8):2075–2079. doi:10.2337/db10-0067.
80. Wong FS, Tree TI. Historical and new insights into pathogenesis of type 1 diabetes. Clin Exp Immunol. 2019;198(3):292–293. doi:10.1111/cei.13396.
81. Zhu Y, Zhang X, Xie S, et al. Oxidative phosphorylation regulates interleukin-10 production in regulatory B cells via the extracellular signal-related kinase pathway. Immunology. 2022;167(4):576–589. doi:10.1111/imm.13554.
82. Wang Y-N, Li R, Huang Y, et al. The role of B cells in the pathogenesis of type 1 diabetes. Front Immunol. 2024;15:1450366. doi:10.3389/fimmu.2024.1450366
83. Chiou J, Geusz RJ, Okino M-L, et al. Interpreting type 1 diabetes risk with genetics and single-cell epigenomics. Nature. 2021;594(7863):398–402. doi:10.1038/s41586-021-03552-w
84. Lowe CE, Cooper JD, Brusko T, et al. Large-scale genetic fine mapping and genotype-phenotype associations implicate polymorphism in the IL2RA region in type 1 diabetes. Nat Genet. 2007;39(9):1074–1082. (). doi:10.1038/ng2102
85. Longo S, Rizza S, Federici M. Microbiota-gut-brain axis: relationships among the vagus nerve, gut microbiota, obesity, and diabetes. Acta Diabetol. 2023;60(8):1007–1017. doi:10.1007/s00592-023-02088-x.
86. Harsch IA, Konturek PC. The role of gut microbiota in obesity and type 2 and type 1 diabetes mellitus: new insights into “old. Diseases Med Sci. 2018;6(2):32. doi:10.3390/medsci6020032.
87. Noso S, Babaya N, Hiromine Y, et al. Metabolic signatures of β-cell destruction in type 1 diabetes. J Diabetes Investig. 2023;14(1):48–57. doi:10.1111/jdi.13926.
88. Ramakrishna C, Mason A, Edwards CJ. Tyrosine kinase 2 inhibitors in autoimmune diseases. Autoimmun Rev. 2024;23(11):103649. doi:10.1016/j.autrev.2024.103649.
89. Jodynis-Liebert J, Kujawska M. Biphasic dose-response induced by phytochemicals: experimental evidence. J Clin Med. 2020;9(3):718. doi:10.3390/jcm9030718.
90. Eghbaliferiz S, Iranshahi M. Prooxidant activity of polyphenols, flavonoids, anthocyanins and carotenoids: updated review of mechanisms and catalyzing metals. Phytother Res. 2016;30(9):1379–1391. doi:10.1002/ptr.5643.
91. Lambert JD, Elias RJ. The antioxidant and pro-oxidant activities of green tea polyphenols: a role in cancer prevention. Arch Biochem Biophys. 2010;501(1):65–72. doi:10.1016/j.abb.2010.06.013.
92. Durá-Travé T, Gallinas-Victoriano F. Type 1 diabetes mellitus and vitamin D. Int J Mol Sci. 2025;26(10):4593. doi:10.3390/ijms26104593.
93. Li H, Wetchapinant C, Zhang L, Wu K. High-fat diet from weaning until early adulthood impairs T cell development in the thymus. Lipids. 2020;55(1):35–44. doi:10.1002/lipd.12193.
94. Karjalainen A, Witalisz-Siepracka A, Prchal-Murphy M, et al. Cell-type-specific requirement for TYK2 in murine immune cells under steady state and challenged conditions. Cell Mol Life Sci. 2025;82(1):98. doi:10.1007/s00018-025-05625-9.
95. Melton R, Jimenez S, Elison W, et al. Single-cell multiome and spatial profiling reveals pancreas cell type-specific gene regulatory programs driving type 1 diabetes progression. bioRxiv [Preprint. 2025. doi:10.1101/2025.02.13.637721
96. Kasselman LJ, Vernice NA, DeLeon J, Reiss AB. The gut microbiome and elevated cardiovascular risk in obesity and autoimmunity. Atherosclerosis. 2018;271:203–213. doi:10.1016/j.atherosclerosis.2018.02.036
97. Acosta-González RI, Hernández-Jiménez AY, Ramírez-Quintanilla LY, Torres-Rodríguez HF, Vargas Muñoz VM, Jiménez-Andrade JM. Effect of 28 days treatment of baricitinib on mechanical allodynia, osteopenia, and loss of nerve fibers in an experimental model of type-1 diabetes mellitus. Pharmacol Rep. 2024;76(5):1079–1088. doi:10.1007/s43440-024-00634-0.
98. Derrou S, El Guendouz F, Benabdelfedil Y, Chakri I, Ouleghzal H, Safi S. The profile of autoimmunity in Type 1 diabetes patients. Ann Afr Med. 2021;20(1):19–23. doi:10.4103/aam.aam_8_20.
99. Chen P, Li J, Li Z, et al. 18F-FP-CIT dopamine transporter PET findings in the striatum and retina of type 1 diabetic rats. Ann Nucl Med. 2023;37(4):219–226. doi:10.1007/s12149-022-01818-5.
100. Aung MH, Park HN, Han MK, et al. Dopamine deficiency contributes to early visual dysfunction in a rodent model of type 1 diabetes. J Neurosci. 2014;34(3):726–736. doi:10.1523/JNEUROSCI.3483-13.2014.
101. Heianza Y, Sun D, Li X, et al. Gut microbiota metabolites, amino acid metabolites and improvements in insulin sensitivity and glucose metabolism: the POUNDS Lost trial. Gut. 2019;68(2):263–270. doi:10.1136/gutjnl-2018-316155.
102. Calder PC. Marine omega-3 fatty acids and inflammatory processes: effects, mechanisms and clinical relevance. Biochim Biophys Acta. 2015;1851(4):469–484. doi:10.1016/j.bbalip.2014.08.010.
103. de Castro Leão M, Di Piazza I, Caria SJ, et al. Effect of nanocapsules containing docosahexaenoic acid in mice with chronic inflammation. Biomed Pharmacother. 2023;167:115474. doi:10.1016/j.biopha.2023.115474
 © 2026 The Author(s). This work is published and licensed by Dove Medical Press Limited. The
full terms of this license are available at https://www.dovepress.com/terms
and incorporate the Creative Commons Attribution
- Non Commercial (unported, 4.0) License.
By accessing the work you hereby accept the Terms. Non-commercial uses of the work are permitted
without any further permission from Dove Medical Press Limited, provided the work is properly
attributed. For permission for commercial use of this work, please see paragraphs 4.2 and 5 of our Terms.
© 2026 The Author(s). This work is published and licensed by Dove Medical Press Limited. The
full terms of this license are available at https://www.dovepress.com/terms
and incorporate the Creative Commons Attribution
- Non Commercial (unported, 4.0) License.
By accessing the work you hereby accept the Terms. Non-commercial uses of the work are permitted
without any further permission from Dove Medical Press Limited, provided the work is properly
attributed. For permission for commercial use of this work, please see paragraphs 4.2 and 5 of our Terms.