Back to Journals » International Journal of Women's Health » Volume 17
Causal Relationship Between Type 2 Diabetes Mellitus and Preeclampsia: A Bidirectional Two-Sample Mendelian Randomized Study
Authors Song X ![]() , Wang Y
, Wang Y ![]() , Li P
, Li P ![]() , Wang Y, Wen X, Nie Q, An W
, Wang Y, Wen X, Nie Q, An W ![]() , Wang H
, Wang H ![]() , He F
, He F
Received 12 March 2025
Accepted for publication 22 May 2025
Published 8 June 2025 Volume 2025:17 Pages 1725—1737
DOI https://doi.org/10.2147/IJWH.S517371
Checked for plagiarism Yes
Review by Single anonymous peer review
Peer reviewer comments 2
Editor who approved publication: Dr Matteo Frigerio
Xuwen Song,1 Yikang Wang,2 Pengsheng Li,3 Yafei Wang,4 Xinghui Wen,4 Qingwen Nie,1 Wanlu An,1 Huan Wang,1 Fang He1
1Department of Obstetrics and Gynecology; Guangdong Provincial Key Laboratory of Major Obstetric Diseases; Guangdong Provincial Clinical Research Center for Obstetrics and Gynecology; Guangdong-Hong Kong-Macao Greater Bay Area Higher Education Joint Laboratory of Maternal-Fetal Medicine; The Third Affiliated Hospital, Guangzhou Medical University, Guangzhou, Guangdong Province, People’s Republic of China; 2Department of Cardiovascular Surgery, The Affiliated Hospital of Qingdao University, Qingdao, Shandong Province, People’s Republic of China; 3Department of Obstetrics, Affiliated Foshan Maternity & Child Healthcare Hospital, Southern Medical University, Foshan, Guangdong Province, People’s Republic of China; 4Department of Obstetrics and Gynecology, The Second People’s Hospital of Guiyang, Guiyang, Guizhou Province, People’s Republic of China
Correspondence: Fang He, Department of Obstetrics and Gynecology; Guangdong Provincial Key Laboratory of Major Obstetric Diseases; Guangdong Provincial Clinical Research Center for Obstetrics and Gynecology; Guangdong-Hong Kong-Macao Greater Bay Area Higher Education Joint Laboratory of Maternal-Fetal Medicine; The Third Affiliated Hospital, Guangzhou Medical University, Guangzhou, Guangdong Province, People’s Republic of China, Tel +8618922182396, Email [email protected]
Background: Observational epidemiologic investigations into the link between diabetes mellitus and preeclampsia (PE) have been conducted, but genetic evidence is still lacking. We utilized a two-sample Mendelian randomization (MR) analysis to shed light on the potential influence of type 2 diabetes mellitus (T2DM) on PE at the genetic prediction level.
Methods: We carried out a two-sample bidirectional MR analysis, utilizing genetic variants associated with T2DM (N=461,920) and PE (N=219,817) from the largest available genome-wide association studies. Using inverse variance weighting (IVW) and five validated approaches—MR-Egger, MR-RAPS, ConMix, weighted median, and weighted mode—we derived a potential causal association between T2DM and PE. The relationship between PE and T2DM was explored using reverse MR analysis.
Results: The two-sample MR analysis indicated a causal link between T2DM and PE, with an odds ratio of 1.10 (95% CI, 1.02– 1.18; P=0.01). The weighted mode method yielded an odds ratio of 1.22 (95% CI, 1.06– 1.40; P=0.019), and the weighted median method produced an odds ratio of 1.19 (95% CI, 1.04– 1.36; P=0.022). However, no significant association was detected in the MR-Egger analysis. Heterogeneity was noted in the analysis of T2DM and PE, but no significant horizontal pleiotropy was observed. The results of the reverse MR analysis indicated no significant causal association between PE and T2DM.
Conclusion: For the first time, MR analysis showed a positive causal link from T2DM to PE, but not vice versa. The limited number of SNPs in reverse analysis may affect reliability. Future studies should use more instrumental variables to strengthen findings. Further experiments are also needed to explore underlying mechanisms.
Keywords: causal effect, type 2 diabetes mellitus, preeclampsia, genome-wide association study
Introduction
Hypertensive disorders of pregnancy (HDP), including PE, rank as the second leading cause of maternal deaths worldwide and are among the most serious complications of pregnancy, impacting 3–8% of pregnancies.1 Each year, an estimated 4 million women globally are diagnosed with PE, which leads to the deaths of over 70,000 women and 500,000 babies.2 Infants conceived in PE are more likely to experience preterm birth, perinatal death, neurodevelopmental disorders, and cardiovascular and metabolic diseases.3 PE arises from a complex interplay of factors such as placental dysfunction, immune system anomalies, disrupted maternal metabolic and cardiovascular function, aberrant placental gene expression, and irregular release of placental factors.4 Conditions like chronic hypertension, chronic kidney disease, systemic lupus erythematosus, antiphospholipid syndrome, and diabetes mellitus are potential risk factors for PE.5,6
Diabetes mellitus is a chronic disorder distinguished by hyperglycemia, originating from a relative or absolute shortage of insulin.7 T2DM accounts for over 90% of all diabetes cases.8 Pre-existing diabetes mellitus has been confirmed as a significant risk factor for HDP, especially PE, and is crucial for early pregnancy prevention, according to clinical studies.9 Women with diabetes have a 2–6 times greater risk of developing PE compared to women without diabetes.10 Globally, the prevalence of T2DM among women of childbearing age is on the rise.11 Despite recent advances in treatment options for pre-existing diabetes mellitus, women are at significantly increased risk of adverse obstetric outcomes compared with the nondiabetic population.12
Individuals experiencing PE or gestational hypertension (GH) exhibit a twofold elevation in the likelihood of diabetes onset, as observed in long-term follow-up studies extending up to 16.5 years postpartum.13 A study examining an intergenerational cohort revealed that PE is linked to a heightened risk of T2DM development among mothers.14 A comprehensive systematic review and meta-analysis, which assessed diabetes prevalence among women both with and without a history of PE, demonstrated that PE is independently correlated with a significant twofold elevation in the risk of developing diabetes in the future.15 A comprehensive research effort, spanning 21 studies and covering more than 2.8 million participants, explored the link between PE and the risk of diabetes onset in subsequent years. The results indicated that PE is significantly correlated with a higher likelihood of developing diabetes in the future. Notably, this elevated risk remains consistent not only in the immediate postpartum period within the first year but also extends up to ten years after childbirth.16 Nevertheless, the presence of residual confounding variables and biases originating from reverse causality in observational studies limits the establishment of robust causal inferences. Consequently, additional evidence is required to confirm the correlation between T2DM and PE.
In the realm of epidemiological research, the MR approach emerges as a robust technique, primarily leveraging single nucleotide polymorphisms (SNPs) as instrumental variables. This methodological framework is designed to elucidate causal associations between risk factors and particular diseases.17 By employing MR, researchers can adeptly navigate and mitigate common pitfalls associated with observational studies, including confounding variables and reverse causality. Additionally, it addresses certain limitations inherent in randomized controlled trials, such as difficulties in ensuring representativeness and feasibility.18 Despite an extensive review of the literature, no studies have been identified that employ MR to examine the causal link between T2DM and PE. Given this gap in the research, our objective is to utilize the MR approach to further explore the potential causal relationship between T2DM and PE. This method aims to precisely evaluate the effect of T2DM as an exposure on the incidence of PE, thereby mitigating the influence of confounding variables and reverse causation often encountered in traditional observational studies. Our study not only provides novel and robust evidence supporting the causal relationship between T2DM and PE, effectively supplementing and reinforcing the existing evidence base, but also enhances our understanding of the complex interplay between T2DM and PE risk. It offers new perspectives and insights for the formulation of PE prevention strategies.
Method
Study Design
In this investigation, we utilized a two-sample MR approach to evaluate the causal link between T2DM and PE, employing SNPs as instrumental variables (IVs).19 To ensure the highest accuracy of the findings, three key assumptions must be acknowledged throughout the process.20 Initially, the selected IVs need to be directly linked to T2DM. Subsequently, IVs must be independent of any potential confounders affecting the exposures and outcomes. Thirdly, IVs affect PE only through T2DM (Figure 1). Data were collected from publicly available databases, thus avoiding the need for additional informed consent from participants.
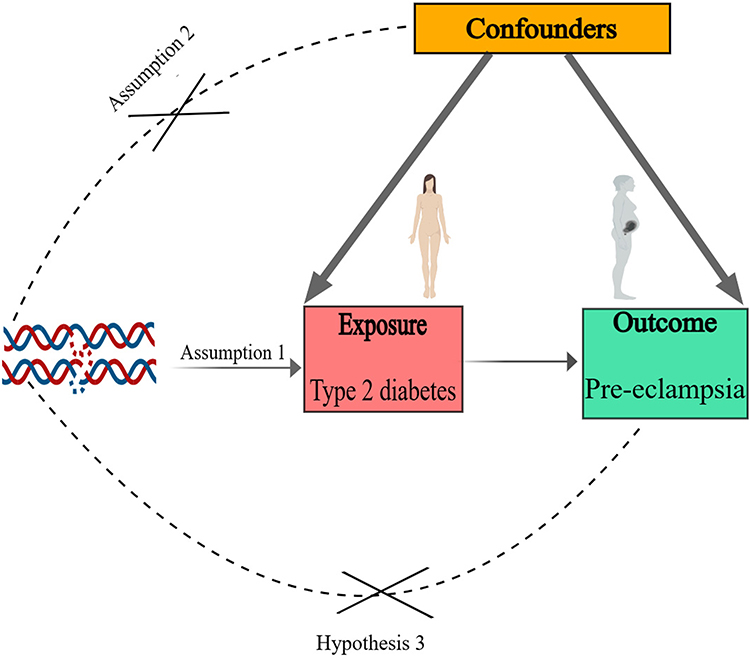 |
Figure 1 Overview of the design of the MR study on T2DM and PE. Abbreviations: MR, Mendelian randomization; T2DM, Type 2 diabetes mellitus; PE, Preeclampsia. |
Data Source
Genome-wide association study (GWAS) datasets provide a reliable tool for MR analysis. For our study, the summary statistics for T2DM were sourced from a comprehensive meta-analysis of GWAS, which included 48,286 cases and 250,671 controls.21 The Finnish Human Biobank provided summary statistics for PE, comprising 7,965 cases and 211,852 controls. For each independent SNP, we applied a genome-wide significance threshold P value (P < 5 × 10⁻⁸) for those not in linkage disequilibrium, and all participants were of European heritage. Table 1 presents detailed information regarding the data sources. In the reverse MR analysis, the number of SNPs reaching the conventional genome-wide significance threshold (P< 5 × 10⁻⁸) was insufficient to facilitate downstream sensitivity analyses. To overcome this limitation, we adopted a suggestive significance threshold (P < 5 × 10⁻⁸) to include additional genetic instruments associated with the exposure of interest, thereby improving the robustness and statistical power of the analysis.
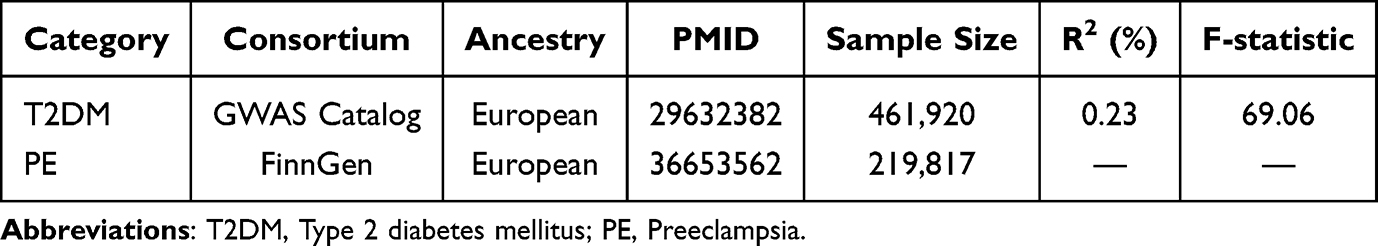 |
Table 1 Study Data Sources |
IVs Selection
Linkage Disequilibrium (LD) Testing and Data Validation
To ensure the validity of the data, we assessed the LD in the selected SNPs. We applied the clumping procedure to identify independent SNPs within a window size of 10,000 kb, using an r² threshold of less than 0.001.
F-Statistics Calculation and Instrument Strength Assessment
We then calculated the F-statistics to gauge the strength of each instrumental variable (IV) and to exclude weak instruments. The formula used was: F = R² × (N - K - 1) / [K × (1 - R²)], where R² represents the proportion of exposure variance explained by the IVs, N is the sample size of the GWAS, and K is the number of SNPs used for MR analysis. An F-value greater than 10 indicated sufficient instrument strength, ensuring that the IVs had a robust estimated effect for the subsequent MR analysis, thereby mitigating weak-tool bias.22,23
SNP Harmonization
Finally, we harmonized the SNPs of exposure and outcome based on alleles and allele frequencies. This involved removing or adjusting SNPs with inconsistent alleles to ensure that they corresponded correctly.
Statistical Analyses
We utilized the IVW method as the main technique to assess the potential causal link between T2DM and PE in this study. The Cochran’s Q statistic was utilized to determine the heterogeneity produced by different genetic variants in the fixed-effect variance weighted analysis, with P ≤ 0.05 suggesting significant heterogeneity.24 In the event of heterogeneity in the results, a random-effects IVW MR analysis should be applied. We then evaluated the potential presence of horizontal pleiotropy using MR-Egger regression, considering an intercept term deviation from zero (P < 0.05) as evidence for directional pleiotropic bias.17 If horizontal pleiotropy is observed, the slope coefficient from MR-Egger regression provides a reliable estimate of the causal effect. Sensitivity analyses were also carried out using the weighted-median,25 weighted-mode,26 MR-RAPS27 and ConMix28 methods, each based on unique assumptions. The MR-RAPS method posits that a linear association exists between IVs and exposure factors, while also assuming that these instrumental variables are independent of confounders. By adjusting the distribution of the instrumental variables, it yields more reliable estimates of causal effects.29 ConMix operates under the premise that IVs might be subject to a certain degree of contamination, implying that not all IVs may entirely meet the assumptions of MR. This method evaluates the influence of such contamination via a mixture model, thereby yielding more precise estimates of causal effects.28 If all included SNPs adhere to the assumption of being valid IVs, IVW can provide accurate estimations.30 Consequently, in scenarios without weak IVs, we used IVs as the primary outcome. To delve deeper, we executed the MR Steiger test to estimate the potential reverse causal influence of PE on T2DM.31 To evaluate how individual variants affect the observed associations, a leave-one-out analysis was conducted. Scatter and forest plots were used to visually summarize the MR analysis results. The analyses were completed using MR in R version 4.1.2, utilizing the Two-Sample MR package (version 0.10.0).
Results
Two-Sample Mendelian Randomization Analysis
In this MR analysis, 50 SNPs closely associated with T2DM were chosen and are presented in Table 2, with F statistics of IVs related to exposure greater than 10, thereby minimizing the risk of weak instrumental bias. In the reverse MR analysis, after harmonization of the SNPs, only four were obtained. However, due to the application of Steiger filtering, which identified one SNP with directional inconsistency, only three SNPs were ultimately included in the reverse analysis as detailed in Table 3. The F-statistic of this genetic variable exceeds the threshold of 10.
 |
Table 2 Comprehensive Details of SNPs Associated with T2DM |
 |
Table 3 Comprehensive Details of SNPs Associated with PE |
A causal relationship between T2DM and PE was supported by the MR results (IVW: OR=1.10, 95% CI, 1.008–1.998, P=0.031) (Figure 2 and Table 4). The estimates were similar in size in weighted median (OR=1.19; 95% CI, 1.044–1.357; P=0.009), weighted mode (OR=1.22; 95% CI, 1.057–1.404; P=0.008), MR-RAPS (OR=1.10; 95% CI, 1.022–1.187; P=0.012) and Conmix (OR=1.19; 95% CI, 1.073–1.336; P=0.003) (Figure 2 and Table 4). The MR results supported a causal association between genetic susceptibility to T2DM and an increased risk of PE. Despite the MR-Egger method failing to achieve statistical significance (P=0.405), the significant findings from the IVW method and the alignment of the beta coefficients from both analyses support the existence of a causal relationship between T2DM and PE (Table 4). The MR Steiger test revealed no indication of reverse causality throughout the analyses (Table 5). Scatter plots depicting the association between T2DM and PE risk for the instruments are illustrated (Figure 3), where the coloured lines signify the slopes derived from various regression analyses.
 |
Table 4 Mendelian Randomization Analysis of the Causal Relationship Between T2DM and PE |
 |
Table 5 MR Steiger Test for T2DM and PE |
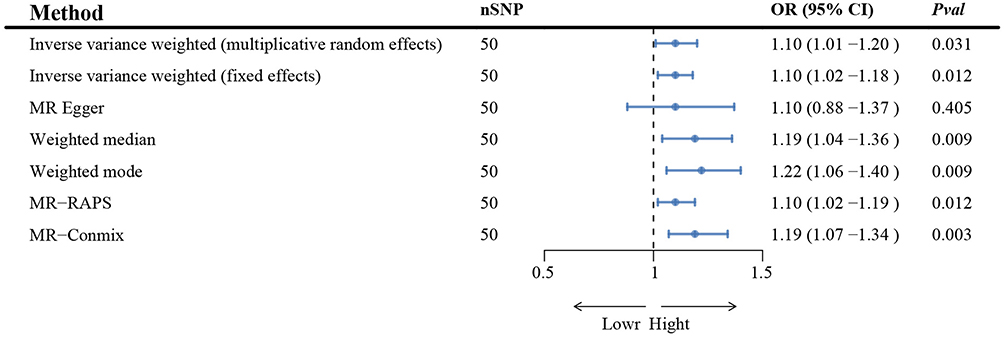 |
Figure 2 MR analysis of the causal relationship between T2DM and PE. Abbreviations: MR, Mendelian randomization; T2DM, Type 2 diabetes; PE, Preeclampsia; SNP, single nucleotide polymorphism; OR, odds ratio; CI, confidence interval; IVW, inverse variance weighted; RAPS, robust adjusted profile score; Conmix, contamination mixture. |
 |
Figure 3 Scatter plots for the causal association between T2DM and PE. Abbreviations: T2DM, Type 2 diabetes mellitus; PE, Preeclampsia. |
Sensitivity Analysis and Heterogeneity Test
The analysis did not identify any significant MR-PRESSO intercept values (intercept = 2.09E-05; P = 0.997), additionally, the MR-PRESSO global test results (P = 0.052) failed to indicate directional pleiotropy (Table 6). Heterogeneity was quantified using Cochran’s Q test, P < 0.05 indicated significant heterogeneity. MR-Egger regression (Cochran’s Q = 66.49, P = 0.040) and IVW (Cochran’s Q = 66.49, P = 0.049) indicated that there was heterogeneity between the SNPs (Table 7). Despite the presence of heterogeneity in the majority of results from Cochran’s Q test, it did not compromise the MR estimates within this study. This stability is attributed to the utilization of the random-effects IVW method, which adeptly mitigates the aggregated heterogeneity. We used the leave-one-out method to remove SNPs to analyze the sensitivity, no distortion in the leave-one-out plot (Figure 4), and the funnel plot showing the symmetrical distribution of the causal relationship between T2DM and PE (Figure 5), suggesting that the estimates remained unaffected.
 |
Table 6 MR-PRESSO Analysis and MR-Egger Intercept of T2DM Causally Linked to PE |
 |
Table 7 Heterogeneity and Horizontal Pleiotropy Test of T2DM and PE |
 |
Figure 4 Leave-one-out plots for the causal association between T2DM and PE. Abbreviations: T2DM, Type 2 diabetes mellitus; PE, Preeclampsia. |
 |
Figure 5 Funnel plots of the casual relationship of T2DM and PE. Abbreviations: T2DM, Type 2 diabetes mellitus; PE, Preeclampsia. |
Casual Effect of PE on T2DM
A reverse causality analysis was undertaken to explore the potential impact of PE on T2DM. In total, 3 SNP was screened and identified as IV in reverse MR analysis, with F values greater than 10. According to the results of reverse MR analysis, the causal effect of PE on T2DM was found to be non-significant (Supplemental Table 1). In the heterogeneity test for the association between PE and T2DM, the IVW method was employed. The Q statistic was 0.077, resulting in a P-value of 0.962 (Supplemental Table 2). This suggests that there is no significant heterogeneity in the causal effect estimates for the relationship between PE and T2DM when using the IVW method. In the horizontal pleiotropy test for the association between PE and T2DM, the Egger regression intercept was used to assess potential pleiotropy. The Egger regression intercept was −0.00344, with a P-value of 0.98 (Supplemental Table 3). This result suggests that there is no significant evidence of horizontal pleiotropy in the relationship between PE and T2DM.
Discussion
This study used genetic data from an open database to conduct a two-sample MR analysis to explore the association between T2DM and the risk of PE. Our findings supported the association between T2DM and PE. The MR results were robust and reliable, as confirmed by sensitivity analysis.
The results we obtained are in agreement with earlier observational studies that found pregnant women with pregestational diabetes to be at an elevated risk of PE. A meta-analysis with a sample size of 253,566,68 pregnancies among 92 studies showed pregestational diabetes was one of the prominent risk factors of PE.32 Compared to the relatively low incidence of PE in non-diabetic women, PE is diagnosed in 10–14% of pregnant women with type 2 diabetes.33 A retrospective population-based study in Washington state revealed that women with T2DM faced an increased risk of PE.34 A cohort study in Brazil highlighted the risk of PE in pregnant women with T2DM and suggested that these women should be closely monitored for systolic blood pressure and gestational weight gain to prevent adverse outcomes.35 The prevalence of PE was found to be lower in women with diabetes receiving tight glycemic and diastolic control compared to previously published data.9 Pregnant women with T2DM were more likely to experience not only PE but also other complications, including preterm delivery, cesarean sections, stillbirth, perinatal mortality, and macrosomia.36 Pregnant women with pre-existing T2DM should be evaluated and monitored for complications during pregnancy. It is well established that PE is a risk factor for long-term adverse cardiovascular events.37 PE is recognized as a significant risk for end-stage renal disease, according to observational studies.38 In conclusion, T2DM heightens the risk of PE during pregnancy. More research is necessary to delve into the pathophysiology, treatment, and long-term health ramifications of PE in women with pre-existing diabetes.10
The association between PE and the subsequent development of T2DM does not align with previous research. Women with HDP have an increased risk of developing T2DM after delivery, as found in observational epidemiological studies.39 Information on prior HDP is not only crucial for assessing the risk of cardiometabolic disease in the post-pregnancy years, but may also be clinically helpful for predicting the development of T2DM in middle age.40 This susceptibility may be mediated through more adverse vascular, inflammatory, and/or insulin-resistant pathways.41 Women with HDP, including PE and GH, experience greater weight gain and are twice as likely to develop T2DM in the years following pregnancy compared to those without a history of HDP,13 this suggests that HDP may further heighten the risk of developing T2DM in the postpartum period, in synergy with body mass index (BMI). It is hypothesized that insulin resistance may be involved in the pathogenesis of new-onset hypertension in pregnancy,42 potentially explaining the persistence of metabolic abnormalities after delivery and the development of subsequent diabetes. In the reverse causality analysis, we found no significant causal effect of PE on T2DM. This result contradicts the findings of several observational studies, which typically report a positive association between PE and the risk of developing T2DM in the postpartum period. This discrepancy may be attributable to a variety of factors, including sample size, choice of instrumental variables, methodological differences, and potential confounders in observational studies. Our study utilized large-scale GWAS data and multiple MR methods to ensure the robustness and reliability of our results. In addition, our selection of instrumental variables was based on rigorous statistical criteria, ensuring their significant association with T2DM and reducing the effects of confounders and reverse causality bias.
The possible reasons for explaining the association between T2DM and PE had been presumed in present studies. Initially, a greater number of M1 macrophages and a diminished number of M2 macrophages in the placenta may be associated with PE.43 The modified levels and polarization states of macrophages could underlie the defective trophoblast invasion and spiral artery remodeling observed in PE. Macrophages that are aberrantly activated are capable of secreting TNF-α and IFN-γ, potentially influencing trophoblast invasion through ECM reorganization.44 It is well known that abnormal macrophage polarization is confirmed to mediate the development of T2DM.45 The elevated concentrations of TNF-α and IFN-γ are important in the development of T2DM.46,47 Consequently, it seems plausible that the abnormal polarization of macrophages and the presence of pro-inflammatory cytokines in individuals with T2DM could be associated with an increased risk of PE. Secondly, endoplasmic reticulum (ER) stress has been identified as a causative factor with a role in the development of the T2DM.48 ER stress has been found to play a crucial in the pathophysiology of PE.49 These recent studies provided evidence for the connection between T2DM and PE, and further animal and cell experiments are required to confirm this inference. Thirdly, the role of NLRP3 inflammasome has been focused a hypothesis. Lee et al found that monocytes from T2DM patients have elevated expression of the inflammasome component NLRP3 and increased caspase-1 activation.50 Patients with PE have higher levels of the NLRP3 inflammasome expressed in peripheral blood mononuclear cells and placental tissue compared to healthy pregnant women.51,52 Activation of the NLRP3 inflammasome by various damage-associated molecular patterns (DAMPs), such as cholesterol and uric acid crystals, leads to the recruitment of immune cells and the production of inflammatory cytokines and vascular damage, which are implicated in the development of PE.53 Therefore, we presumed that triggered NLPR3 inflammasome in type 2 diabetic patients might induce PE during pregnancy.
Although there are no treatment strategies that directly address the relationship between PE and T2DM, lifestyle changes and treatment of MS may help to avoid some future pregnancy complications. Several research projects are looking into the potential of medications like metformin for the prevention and treatment of PE, especially in diseases where insulin resistance is present, such as T2DM.
Our research has the following strengths. T2DM has been demonstrated to increase the incidence of PE. IVs were chosen from SNPs with genome-wide associations and independent inheritance, which helps to exclude potential confounders and address reverse causation in this study design. To detect and exclude horizontal pleiotropy, we applied the MR-PRESSO and MR-Egger regression intercept term tests. Despite finding heterogeneity in the analysis of T2DM and PE, the test results showed that our results were adapted to the IVW randomized model. Moreover, the results of the horizontal multivariate test showed no evidence of horizontal pleiotropy for the genetic variables in this study.
Our study faced several limitations. Firstly, in the reverse MR analysis, we relaxed the threshold for SNP selection, three SNPs was used in the reverse analysis, which may potentially introduce bias. However, no significant heterogeneity or pleiotropy was detected in the current data analysis. Future studies should consider using more instrumental variables to enhance the reliability of the reverse analysis. Secondly, the MR data were obtained from populations of European ancestry, which restricts the generalizability of our findings to other ethnic groups. The presence of a causal relationship in other populations remains to be confirmed. The analysis did not identify any SNPs that would affect the stability of the results, ensuring the accuracy of our conclusions. However, further investigations involving other ethnic groups should be conducted to confirm the causality of the relationship. Lastly, additional research is needed to explore the relationship between T2DM and the subtypes of PE, as the data on PE lack specific information to categorize the severity of the disease.
Conclusions
For the first time, MR has been employed to clarify the causal relationship between T2DM and PE from a genetic aspect. Our analysis reveals that T2DM is positively associated with a higher risk of PE, nevertheless, no significant causal effect of PE was found on T2DM. The use of three single SNPs in the reverse analysis might have constrained the method’s reliability. Multiple instrumental variables should be employed in future studies to bolster the dependability of the reverse analysis. Of course, further basic experiments are needed to investigate the mechanisms of action behind T2DM and PE.
Data Sharing Statement
The original contributions highlighted in this study are included in the article and Supplementary Materials. Further inquiries can be directed to the corresponding author. We wish to acknowledge the participants and investigators of the FinnGen study. Furthermore, we are grateful to all consortium studies for their essential contributions in providing publicly accessible summary association statistics data.
Ethics Statement
The study protocol was approved by the Institutional Ethics Committee of the Third Affiliated Hospital of Guangzhou Medical University. In accordance with national legislation and institutional guidelines, the specific reasons for the exemption are outlined as follows: The data have been de-identified and are not traceable to individual subjects. Additionally, the data are publicly available and do not contain any personally identifiable information.
Acknowledgments
We thank the researchers and participants for their contributions to this study.
Author Contributions
All authors made a significant contribution to the work reported, whether that is in the conception, study design, execution, acquisition of data, analysis and interpretation, or in all these areas; took part in drafting, revising or critically reviewing the article; gave final approval of the version to be published; have agreed on the journal to which the article has been submitted; and agree to be accountable for all aspects of the work.
Funding
This work was supported by the Guangdong Basic and Applied Basic Research Fund (Guangdong-Shenzhen Joint Fund) (Grant No:2021B1515120070).
Disclosure
The authors assert that the research was conducted free from any commercial or financial interests that might be considered a potential conflict of interest.
References
1. Dimitriadis E, Rolnik DL, Zhou W, et al. Pre-eclampsia. Nat Rev Dis Primers. 2023;9(1):8. doi:10.1038/s41572-023-00417-6
2. Reddy M, Fenn S, Rolnik DL, et al. The impact of the definition of preeclampsia on disease diagnosis and outcomes: a retrospective cohort study. Am J Obstet Gynecol. 2021;224(2):217.e1–217.e11. doi:10.1016/j.ajog.2020.08.019
3. Cnattingius S, Lindam A, Persson M. Risks of asphyxia-related neonatal complications in offspring of mothers with type 1 or type 2 diabetes: the impact of maternal overweight and obesity. Diabetologia. 2017;60(7):1244–1251. doi:10.1007/s00125-017-4279-2
4. Chappell LC, Cluver CA, Kingdom J, Tong S. Pre-eclampsia. Lancet. 2021;398(10297):341–354. doi:10.1016/S0140-6736(20)32335-7
5. Webster K, Fishburn S, Maresh M, Findlay SC, Chappell LC. Diagnosis and management of hypertension in pregnancy: summary of updated NICE guidance. BMJ. 2019;366:l5119. doi:10.1136/bmj.l5119
6. Gestational Hypertension and Preeclampsia: ACOG Practice Bulletin, Number 222. Obstet Gynecol. 2020;135(6):e237–e260. doi:10.1097/AOG.0000000000003891
7. DiMeglio LA, Evans-Molina C, Oram RA. Type 1 diabetes. Lancet. 2018;391(10138):2449–2462. doi:10.1016/S0140-6736(18)31320-5
8. Ma Q, Li Y, Li P, et al. Research progress in the relationship between type 2 diabetes mellitus and intestinal flora. Biomed Pharmacother. 2019;117:109138. doi:10.1016/j.biopha.2019.109138
9. Norgaard SK, Vestgaard MJ, Jorgensen IL, et al. Diastolic blood pressure is a potentially modifiable risk factor for preeclampsia in women with pre-existing diabetes. Diabetes Res Clin Pract. 2018;138:229–237. doi:10.1016/j.diabres.2018.02.014
10. Weissgerber TL, Mudd LM. Preeclampsia and diabetes. Curr Diab Rep. 2015;15(3):9. doi:10.1007/s11892-015-0579-4
11. Padmanabhan S, Zen M, Lee V, Cheung NW. Pre-existing diabetes in pregnancy. Minerva Endocrinol (Torino). 2016;41(1):122–137.
12. Robinson DJ, Coons M, Haensel H, Vallis M, Yale JF. Diabetes and Mental Health. Can J Diabetes. 2018;42 Suppl 1:S130-S141.
13. Feig DS, Shah BR, Lipscombe LL, et al. Preeclampsia as a risk factor for diabetes: a population-based cohort study. PLoS Med. 2013;10(4):e1001425. doi:10.1371/journal.pmed.1001425
14. Slapo GD, Lossius MI, Gjerstad L. Poststroke epilepsy: occurrence, predictors and treatment. Expert Rev Neurother. 2006;6(12):1801–1809. doi:10.1586/14737175.6.12.1801
15. Wu P, Kwok CS, Haththotuwa R, et al. Pre-eclampsia is associated with a twofold increase in diabetes: a systematic review and meta-analysis. Diabetologia. 2016;59(12):2518–2526. doi:10.1007/s00125-016-4098-x
16. Palaniswamy C, Sekhri A, Aronow WS, Kalra A, Peterson SJ. Association of warfarin use with valvular and vascular calcification: a review. Clin Cardiol. 2011;34(2):74–81. doi:10.1002/clc.20865
17. Bowden J, Davey Smith G, Burgess S. Mendelian randomization with invalid instruments: effect estimation and bias detection through Egger regression. Int J Epidemiol. 2015;44(2):512–525. doi:10.1093/ije/dyv080
18. Huang R, Bai C, Liu X, et al. The p53/RMRP/miR122 signaling loop promotes epithelial-mesenchymal transition during the development of silica-induced lung fibrosis by activating the notch pathway. Chemosphere. 2021;263:128133. doi:10.1016/j.chemosphere.2020.128133
19. Davey SG, Hemani G. Mendelian randomization: genetic anchors for causal inference in epidemiological studies. Hum Mol Genet. 2014;23(R1):R89–98. doi:10.1093/hmg/ddu328
20. Sekula P, Del GMF, Pattaro C, Kottgen A. Mendelian randomization as an approach to assess causality using observational data. J Am Soc Nephrol. 2016;27(11):3253–3265. doi:10.1681/ASN.2016010098
21. Mahajan A, Wessel J, Willems SM, et al. Refining the accuracy of validated target identification through coding variant fine-mapping in type 2 diabetes. Nat Genet. 2018;50(4):559–571. doi:10.1038/s41588-018-0084-1
22. Shim H, Chasman DI, Smith JD, et al. A multivariate genome-wide association analysis of 10 LDL subfractions, and their response to statin treatment, in 1868 Caucasians. PLoS One. 2015;10(4):e0120758. doi:10.1371/journal.pone.0120758
23. Burgess S, Thompson SG. Avoiding bias from weak instruments in Mendelian randomization studies. Int J Epidemiol. 2011;40(3):755–764. doi:10.1093/ije/dyr036
24. Bowden J, Del GMF, Minelli C, et al. A framework for the investigation of pleiotropy in two-sample summary data Mendelian randomization. Stat Med. 2017;36(11):1783–1802. doi:10.1002/sim.7221
25. Bowden J, Davey SG, Haycock PC, Burgess S. Consistent estimation in Mendelian randomization with some invalid instruments using a weighted median estimator. Genet Epidemiol. 2016;40(4):304–314. doi:10.1002/gepi.21965
26. Hartwig FP, Davey SG, Bowden J. Robust inference in summary data Mendelian randomization via the zero modal pleiotropy assumption. Int J Epidemiol. 2017;46(6):1985–1998. doi:10.1093/ije/dyx102
27. Fu L, Wang Y, Hu YQ. Bi-directional causal effect between vitamin B12 and non-alcoholic fatty liver disease: inferring from large population data. Front Nutr. 2023;10:1015046. doi:10.3389/fnut.2023.1015046
28. Burgess S, Foley CN, Allara E, Staley JR, Howson JMM. A robust and efficient method for Mendelian randomization with hundreds of genetic variants. Nat Commun. 2020;11(1):376. doi:10.1038/s41467-019-14156-4
29. Warkala M, Chen D, Ramirez A, et al. Cell-extracellular matrix interactions play multiple essential roles in aortic arch development. Circ Res. 2021;128(3):e27–e44. doi:10.1161/CIRCRESAHA.120.318200
30. Hartwig FP, Davies NM, Hemani G, Davey SG. Two-sample Mendelian randomization: avoiding the downsides of a powerful, widely applicable but potentially fallible technique. Int J Epidemiol. 2016;45(6):1717–1726. doi:10.1093/ije/dyx028
31. Hemani G, Tilling K, Davey SG. Orienting the causal relationship between imprecisely measured traits using GWAS summary data. PLoS Genet. 2017;13(11):e1007081. doi:10.1371/journal.pgen.1007081
32. Bartsch E, Medcalf KE, Park AL, Ray JG. Clinical risk factors for pre-eclampsia determined in early pregnancy: systematic review and meta-analysis of large cohort studies. BMJ. 2016;353:i1753. doi:10.1136/bmj.i1753
33. Groen B, Links TP, van den Berg PP, et al. Similar adverse pregnancy outcome in native and nonnative Dutch women with pregestational type 2 diabetes: a multicentre retrospective study. ISRN Obstet Gynecol. 2013;2013:361435. doi:10.1155/2013/361435
34. Lisonkova S, Joseph KS. Incidence of preeclampsia: risk factors and outcomes associated with early- versus late-onset disease. Am J Obstet Gynecol. 2013;209(6):544.e1–544.e12. doi:10.1016/j.ajog.2013.08.019
35. Oppermann M, Alessi J, Hirakata VN, Wiegand DM, Reichelt AJ. Preeclampsia in women with pregestational diabetes - a cohort study. Hypertens Pregnancy. 2020;39(1):48–55. doi:10.1080/10641955.2019.1704002
36. Mackin ST, Nelson SM, Kerssens JJ, et al. Diabetes and pregnancy: national trends over a 15 year period. Diabetologia. 2018;61(5):1081–1088. doi:10.1007/s00125-017-4529-3
37. Mosca L, Benjamin EJ, Berra K, et al. Effectiveness-based guidelines for the prevention of cardiovascular disease in women--2011 update: a guideline from the American Heart Association. J Am Coll Cardiol. 2011;57(12):1404–1423. doi:10.1016/j.jacc.2011.02.005
38. Paauw ND, Luijken K, Franx A, Verhaar MC, Lely AT. Long-term renal and cardiovascular risk after preeclampsia: towards screening and prevention. Clin Sci (Lond). 2016;130(4):239–246. doi:10.1042/CS20150567
39. Stuart JJ, Tanz LJ, Missmer SA, et al. Hypertensive disorders of pregnancy and maternal cardiovascular disease risk factor development: an observational cohort study. Ann Intern Med. 2018;169(4):224–232. doi:10.7326/M17-2740
40. Timpka S, Markovitz A, Schyman T, et al. Midlife development of type 2 diabetes and hypertension in women by history of hypertensive disorders of pregnancy. Cardiovasc Diabetol. 2018;17(1):124. doi:10.1186/s12933-018-0764-2
41. Sung KC, Park HY, Kim MJ, Reaven G. Metabolic markers associated with insulin resistance predict type 2 diabetes in Koreans with normal blood pressure or prehypertension. Cardiovasc Diabetol. 2016;15:47. doi:10.1186/s12933-016-0368-7
42. Seely EW, Solomon CG. Insulin resistance and its potential role in pregnancy-induced hypertension. J Clin Endocrinol Metab. 2003;88(6):2393–2398. doi:10.1210/jc.2003-030241
43. Schonkeren D, van der Hoorn ML, Khedoe P, et al. Differential distribution and phenotype of decidual macrophages in preeclamptic versus control pregnancies. Am J Pathol. 2011;178(2):709–717. doi:10.1016/j.ajpath.2010.10.011
44. Renaud SJ, Postovit LM, Macdonald-Goodfellow SK, et al. Activated macrophages inhibit human cytotrophoblast invasiveness in vitro. Biol Reprod. 2005;73(2):237–243. doi:10.1095/biolreprod.104.038000
45. Orliaguet L, Dalmas E, Drareni K, Venteclef N, Alzaid F. Mechanisms of macrophage polarization in insulin signaling and sensitivity. Front Endocrinol. 2020;11:62. doi:10.3389/fendo.2020.00062
46. Kuriya G, Uchida T, Akazawa S, et al. Double deficiency in IL-17 and IFN-gamma signalling significantly suppresses the development of diabetes in the NOD mouse. Diabetologia. 2013;56(8):1773–1780. doi:10.1007/s00125-013-2935-8
47. Akash M, Rehman K, Liaqat A. Tumor necrosis factor-alpha: role in development of insulin resistance and pathogenesis of type 2 diabetes mellitus. J Cell Biochem. 2018;119(1):105–110. doi:10.1002/jcb.26174
48. Back SH, Kaufman RJ. Endoplasmic reticulum stress and type 2 diabetes. Annu Rev Biochem. 2012;81:767–793. doi:10.1146/annurev-biochem-072909-095555
49. Mizuuchi M, Cindrova-Davies T, Olovsson M, et al. Placental endoplasmic reticulum stress negatively regulates transcription of placental growth factor via ATF4 and ATF6beta: implications for the pathophysiology of human pregnancy complications. J Pathol. 2016;238(4):550–561. doi:10.1002/path.4678
50. Lee HM, Kim JJ, Kim HJ, et al. Upregulated NLRP3 inflammasome activation in patients with type 2 diabetes. Diabetes. 2013;62(1):194–204. doi:10.2337/db12-0420
51. Matias ML, Romao M, Weel IC, et al. Endogenous and uric acid-induced activation of NLRP3 inflammasome in pregnant women with preeclampsia. PLoS One. 2015;10(6):e0129095. doi:10.1371/journal.pone.0129095
52. Weel C, Romao-Veiga M, Matias ML, et al. Increased expression of NLRP3 inflammasome in placentas from pregnant women with severe preeclampsia. J Reprod Immunol. 2017;123:40–47. doi:10.1016/j.jri.2017.09.002
53. Murthi P, Pinar AA, Dimitriadis E, Samuel CS. Inflammasomes-A molecular link for altered immunoregulation and inflammation mediated vascular dysfunction in preeclampsia. Int J Mol Sci. 2020;21(4). doi:10.3390/ijms21041406
 © 2025 The Author(s). This work is published and licensed by Dove Medical Press Limited. The
full terms of this license are available at https://www.dovepress.com/terms
and incorporate the Creative Commons Attribution
- Non Commercial (unported, 4.0) License.
By accessing the work you hereby accept the Terms. Non-commercial uses of the work are permitted
without any further permission from Dove Medical Press Limited, provided the work is properly
attributed. For permission for commercial use of this work, please see paragraphs 4.2 and 5 of our Terms.
© 2025 The Author(s). This work is published and licensed by Dove Medical Press Limited. The
full terms of this license are available at https://www.dovepress.com/terms
and incorporate the Creative Commons Attribution
- Non Commercial (unported, 4.0) License.
By accessing the work you hereby accept the Terms. Non-commercial uses of the work are permitted
without any further permission from Dove Medical Press Limited, provided the work is properly
attributed. For permission for commercial use of this work, please see paragraphs 4.2 and 5 of our Terms.