Back to Journals » Clinical Interventions in Aging » Volume 10
Caregiver burden, productivity loss, and indirect costs associated with caring for patients with poststroke spasticity
Authors Ganapathy V, Graham GD, DiBonaventura M, Gillard PJ, Goren A ![]() , Zorowitz R
, Zorowitz R
Received 25 June 2015
Accepted for publication 26 August 2015
Published 6 November 2015 Volume 2015:10 Pages 1793—1802
DOI https://doi.org/10.2147/CIA.S91123
Checked for plagiarism Yes
Review by Single anonymous peer review
Peer reviewer comments 3
Editor who approved publication: Dr Richard Walker
Vaidyanathan Ganapathy,1 Glenn D Graham,2 Marco D DiBonaventura,3 Patrick J Gillard,1 Amir Goren,3 Richard D Zorowitz4
1Allergan, Irvine, CA, USA; 2Department of Veterans Affairs, San Francisco, CA, USA; 3Health Outcomes Practice, Kantar Health, New York, NY, USA; 4Johns Hopkins Bayview Medical Center, Baltimore, MD, USA
Objective: Many stroke survivors experience poststroke spasticity and the related inability to perform basic activities, which necessitates patient management and treatment, and exerts a considerable burden on the informal caregiver. The current study aims to estimate burden, productivity loss, and indirect costs for caregivers of stroke survivors with spasticity.
Methods: Internet survey data were collected from 153 caregivers of stroke survivors with spasticity including caregiving time and difficulty (Oberst Caregiver Burden Scale), Work Productivity and Activity Impairment measures, and caregiver and patient characteristics. Fractional logit models examined predictors of work-related restriction, and work losses were monetized (2012 median US wages).
Results: Mean Oberst Caregiver Burden Scale time and difficulty scores were 46.1 and 32.4, respectively. Employed caregivers (n=71) had overall work restriction (32%), absenteeism (9%), and presenteeism (27%). Caregiver characteristics, lack of nursing home coverage, and stroke survivors’ disability predicted all work restriction outcomes. The mean total lost-productivity cost per employed caregiver was US$835 per month (>$10,000 per year; 72% attributable to presenteeism).
Conclusion: These findings demonstrate the substantial burden of caring for stroke survivors with spasticity illustrating the societal and economic impact of stroke that extends beyond the stroke survivor.
Keywords: burden, caregiver, productivity, spasticity, stroke
Introduction
Stroke is the fourth-leading cause of death and a leading cause of long-term disability in the US.1,2 Most stroke survivors need home care, which is usually provided by a family member, but the continuous, long-term commitments required of caregivers are often associated with psychological and financial burdens.3–5
Nearly one-fifth (17%) of stroke survivors experience poststroke spasticity (PSS), a disorder of the sensorimotor system characterized by a velocity-dependent increase in muscle tone.6 PSS frequently causes pain and interferes with hand and arm positioning, which affects grasping, self-care, and other activities of daily living of the stroke survivor.7,8 Spasticity-related stiffness and discomfort can interfere with physical activities such as ambulation, hygiene, and dressing in addition to psychological consequences on mood and self-esteem.9
The inability of a stroke survivor with PSS to perform basic activities exerts a considerable burden on the informal caregiver, defined as someone close to the stroke survivor who is not hired to provide caregiving services.7,8 Significant humanistic burden such as depression and anxiety, among caregivers of PSS has been reported.10 Furthermore, informal caring for stroke survivors is associated with both humanistic costs including decrements in health-related quality of life and indirect economic costs such as restrictions in work productivity. While the humanistic burden has been well documented, the economic costs associated with providing care for PSS patients are not well documented. Therefore, the purpose of this study was to assess and quantify the economic burden of providing care for stroke survivors with PSS.
Methods
Study design
Participants were recruited from the 2008 US National Health and Wellness Survey (NHWS) and the Ailment Panel of Lightspeed Research (Warren, NJ, USA). NHWS is an annual, cross-sectional, self-administered Internet-based survey given to a sample of 75,000 adults (≥18 years of age) who are identified through Lightspeed Research’s Internet panel. Members of the Internet panel are recruited through opt-in emails, coregistration with panel partners, e-newsletter campaigns, online banner placements, and both internal and external affiliate networks. A stratified random sample procedure was implemented for NHWS so that the final sample was representative of the demographic composition of the adult US population.
NHWS (2008) respondents who reported that they care for a stroke survivor (n=854) were invited via email to participate in this study. To increase sample size, members of the Lightspeed Research Internet panel who did not participate in NHWS were also contacted, and those who did report providing care to a stroke survivor were invited to participate in this study.
Caregivers were eligible to participate if they provided care for a friend or a family member with PSS who experienced spasticity of the upper or lower limbs for ≥6 months and received no payment (or reimbursement by a government agency or insurance) for providing care. All caregivers provided informed consent. The study was reviewed and approved by Essex Institutional Review Board (Lebanon, NJ).
Evaluations
Caregiver characteristics
Caregiver demographics and clinical characteristics obtained included sex, age, ethnicity, education, household income, employment status, relationship to stroke survivor, symptoms experienced in the past month (eg, headaches, nervousness or anxiety, stomach pain), and number of comorbidities. Caregiver health outcomes were assessed using the mental component summary (MCS) and physical component summary (PCS) and health utilities (SF-6D) scores derived from the Short Form-12, Version 2 (SF-12v2),11 and the Patient Health Questionnaire-9.12
Stroke survivor characteristics
Caregivers provided characteristics of the stroke survivors under their care, which included age, sex, race/ethnicity, employment status, insurance status, symptoms experienced (eg, abnormal posture, inability to sleep), and body areas affected by spasticity. Caregivers also rated the level of disability that stroke survivors experienced, using the Disability Assessment Scale (DAS). The DAS is a validated scale that consists of four domains – hygiene, pain, dressing, and impact of limb posture on daily living, each of which was rated on a Likert-type scale (0= no disability, 1= mild disability, 2= moderate disability, and 3= severe disability).13
Caregiver burden
The Oberst Caregiving Burden Scale (OCBS)14,15 and the Bakas Caregiving Outcomes Scale (BCOS)16 were used to assess the burden of providing care. The OCBS is a 15-item instrument that rates caregiving tasks based on time spent (1= none, 5= a great amount) and difficulty of task (1= not difficult, 5= extremely difficult). The 15 items of each subscale are then summed (range, 15–75; higher scores indicate greater caregiver burden).
The BCOS is a 15-item instrument that measures life changes as a consequence of caregiving, with each item scored on a 7-point response scale (1= changed for the worst, 7= changed for the best). Scores are summed (range, 15–105; lower scores indicate greater caregiver burden).
Work productivity and activity limitation
Work productivity was assessed using the validated Work Productivity and Activity Impairment (WPAI) questionnaire,17,18 which was tailored to focus specifically on the impact of caregiving. The WPAI items were used to generate percentages (0%–100%) that quantify absenteeism (percentage of time missed from work), presenteeism (percentage of restriction while at work), overall work restriction (percentage of total restriction due to either absenteeism or presenteeism), and overall activity limitation (percentage of limitation in daily activities) due to caregiving responsibilities, with higher values indicating greater limitation. Only those currently employed (full-time, part-time, or self-employed) were asked about work productivity, although all caregivers were asked about activity limitation.
Human capital method
Costs due to lost productivity were calculated for each caregiver using the human capital method (HCM), according to how much a disease decreases an individual’s ability to be productive (eg, as measured by rates of absenteeism and presenteeism and their related monetary costs based on lost wages).19 In this study, the 2012 median weekly income figures were obtained for full-time (US$768 per week) and part-time workers ($233 per week) in the US from the Bureau of Labor Statistics, and for self-employed workers ($538 per week) from estimates published on the Internet by a private labor market research firm.20,21 For each respondent, an hourly rate was estimated by dividing the median weekly income by 40 hours (the typical work week) for full-time and self-employed workers or 20 hours for part-time workers. Next, the number of hours missed in the last week because of one’s health (absenteeism) and the number of hours missed in the last week because of health restriction while at work (presenteeism) were each multiplied by the hourly rates then multiplied by four (average number of work weeks in a month) to obtain monthly total lost wage estimates.
Indirect costs
In general, costs due to informal caregiving were considered indirect costs in this study. Total indirect costs were calculated by including costs associated with lost work productivity, personal travel time to visit the stroke survivor, and any out-of-pocket caregiving-related expenditures. Travel time costs were calculated using $23.90 per person-hour estimate for nonbusiness travel by surface mode of transport.22 The sum of out-of-pocket expenses borne by caregivers for additional expenses such as medical care (eg, purchase of grab bars and/or shower chairs), adult day care/respite care, food delivery, caregiver support services, etc, was calculated. All cost estimates are reported in 2012 US dollars.
Statistical analyses
General caregiver and stroke survivor characteristics, levels of caregiver burden, work productivity, and activity limitation were calculated using standard descriptive statistics. DAS cut-off scores were used to create three categories of PSS disability: mild (total DAS score ≤4), moderate (score, 5–8), and severe (score, 9–12). The relationship between PSS disability scores and caregiver burden was explored using analysis of variance. Comparisons of quality-of-life scores against population norms were conducted with one-sample t-tests. P<0.05 was used to indicate statistical significance across all analyses.
The marginal effects of various caregiver and patient characteristics on absenteeism, presenteeism, and overall work restriction were estimated using generalized linear models with a logit link function and binomial distribution family (commonly referred to as “fractional logit” models). These models are well suited to handle dependent variables that are bounded within the 0–1 interval (as seen for work productivity measures evaluated in this study) along with many observed zeroes and/or one.23,24 The model predicted absenteeism, presenteeism, and overall work restriction, which were computed at mean values of the explanatory variables.
Results
Caregiver characteristics
Of 1,754 caregivers invited, 524 (30%) responded and 153 (29%) were eligible to participate in the study. Among caregivers of stroke survivors with PSS (N=153), 71% were female, 78% were white, and the mean age was 51.6 years (Table 1).
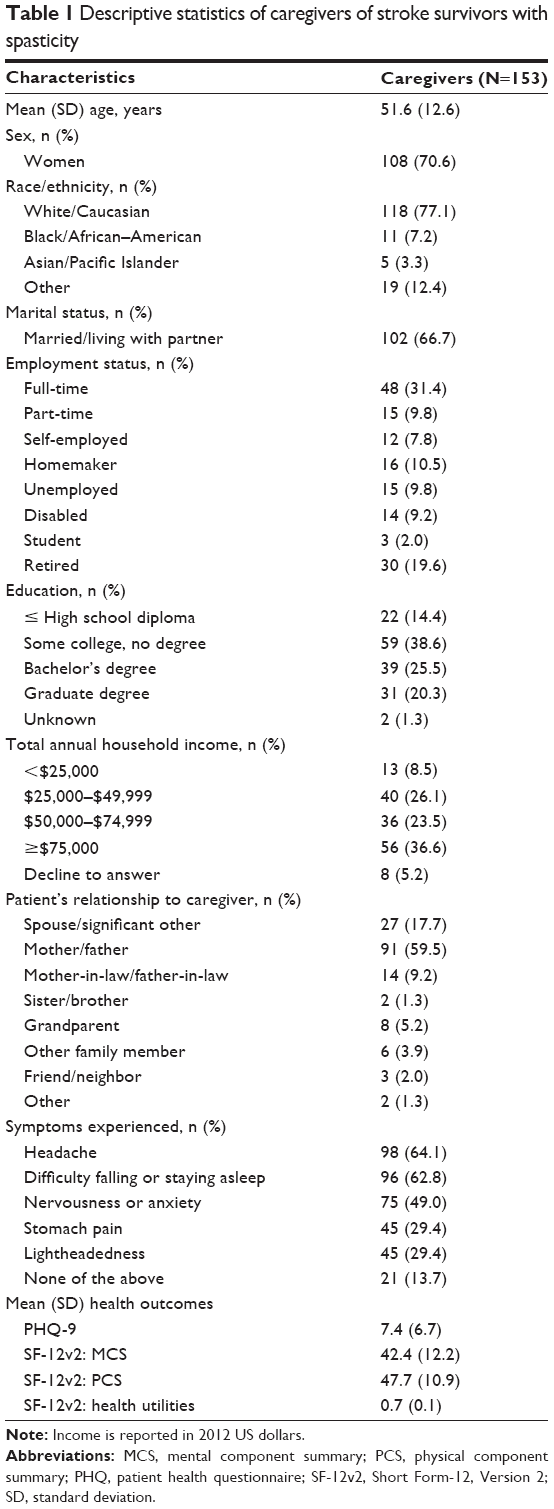 | Table 1 Descriptive statistics of caregivers of stroke survivors with spasticity |
Of the top five symptoms that caregivers experienced in the past month, 64% reported headache, 63% had sleep difficulties, 49% had anxiety/nervousness, 29% had lightheadedness, and 29% had stomach pain. Caregiving duties were reported as the cause for these aforementioned symptoms in approximately 46% of those who reported headache, 42% of those who reported sleep difficulties, 28% of those who reported anxiety/nervousness, 71% of those who reported lightheadedness, and 53% of those who reported stomach pain. High blood pressure was the most frequent diagnosis, occurring in 42% of caregivers; 41% had high cholesterol and 22% had depression. Caregiving duties were reported as the cause among approximately 31% of those who reported having high blood pressure, 10% of those who reported having high cholesterol, and 50% of those who reported having depression. MCS and PCS quality-of-life scores from the SF-12v2 were significantly below the US population norm of 50 (mean MCS =42.38, P<0.01; mean PCS =47.74, P=0.01; Table 1).
Stroke survivor characteristics
Of the 153 stroke survivors with spasticity, 57% were female, 87% were white, the mean age was 75.0 years, and 26% were reported as being disabled (Table 2). Sixty-four percent of the stroke survivors had spasticity for >2 years in the upper and/or lower limbs, 81% experienced stiffness/limited range of motion, 68% had pain, 86% had limitations with locomotion, 71% had limitations in activities of daily living, and 69% had limitations with passive transfers. The mean total DAS score was 7.5 (standard deviation [SD] =2.9), reflecting moderate disability.
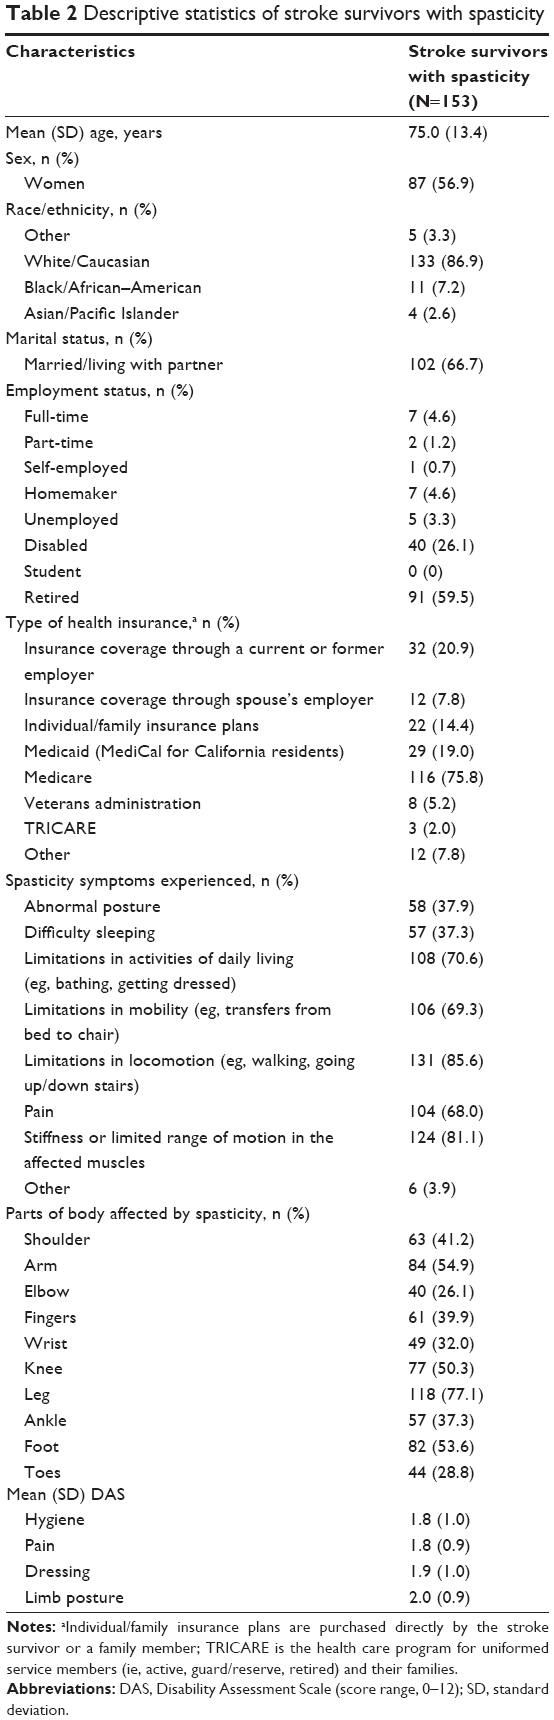 | Table 2 Descriptive statistics of stroke survivors with spasticity |
Caregiver burden
Caregivers in this study provided care to stroke survivors with PSS for a median of 5 years (interquartile range, 6.5 years). Caregivers who were employed spent an average of 27.4 hours (SD =29.4 hours) in a typical week providing care. Caregivers not in the labor force spent more time (48.8±48.6 hours) providing care to stroke survivors. DAS scores were strongly correlated with the average number of hours spent providing care. The mean number of caregiver hours spent per week caring for PSS survivors with mild, moderate, and severe disability was 19.0, 38.0, and 49.0 hours, respectively (P<0.05 for pairwise comparisons).
The caregiver burden was greater for perceived time spent than for difficulty, according to mean OCBS time (46.1) and difficulty (32.4) subscale scores. At least one-third of caregivers reported having spent a moderate to a great deal of time (3–5 on the time subscale) assisting with nursing, personal care, walking, and transfer (eg, from bed to a chair) tasks. More than two-thirds spent a moderate to a great deal of time providing emotional support, monitoring the stroke survivor’s progress, talking to health care professionals regarding the stroke survivor’s condition and treatment plan, providing transportation, helping with additional tasks at home and outside the home, and managing the stroke survivor’s finances and medical bills. Both the time and difficulty subscale scores increased significantly with poststroke survivor’s disability level. The mean time subscale scores were 39.3, 45.3, and 49.3 and difficulty subscale scores were 25, 32.5, and 35.6 for mild, moderate, and severe disability, respectively (P<0.05 for pairwise group comparisons). Additionally, caregiver burden as measured by mean BCOS score was 49.4 (SD =13.1).
Work productivity and activity limitation
Among employed caregivers (n=71), mean absenteeism was 9% (SD =15%) and presenteeism was 27% (SD =26%), leading to an overall caregiving-related work restriction of 32% (SD =29%). The mean number of work hours lost per week because of restricted productivity was 8.8 (SD =9.3) hours. The mean activity limitation caused by caregiving responsibilities for both employed and unemployed caregivers was 40% (SD =28%; Table 3).
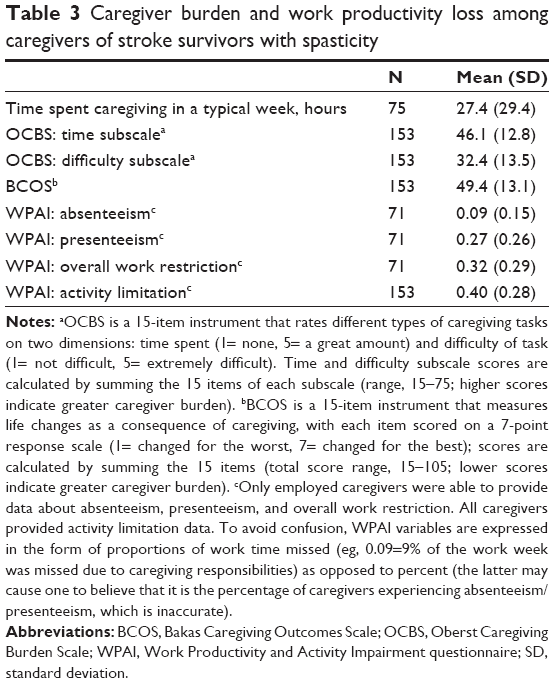 | Table 3 Caregiver burden and work productivity loss among caregivers of stroke survivors with spasticity |
Among caregiver characteristics, age and number of children <18 years of age significantly predicted absenteeism and overall work restriction. The income levels of caregivers significantly affected absenteeism (income <$25,000, P=0.02; income $25,000–$49,999, P=0.041, versus those with income ≥$75,000), but did not have a statistically significant effect on overall work restriction. Caregivers, working part-time or self-employed, reported higher productivity losses than those working full-time, although such effects were not statistically significant (Table 4).
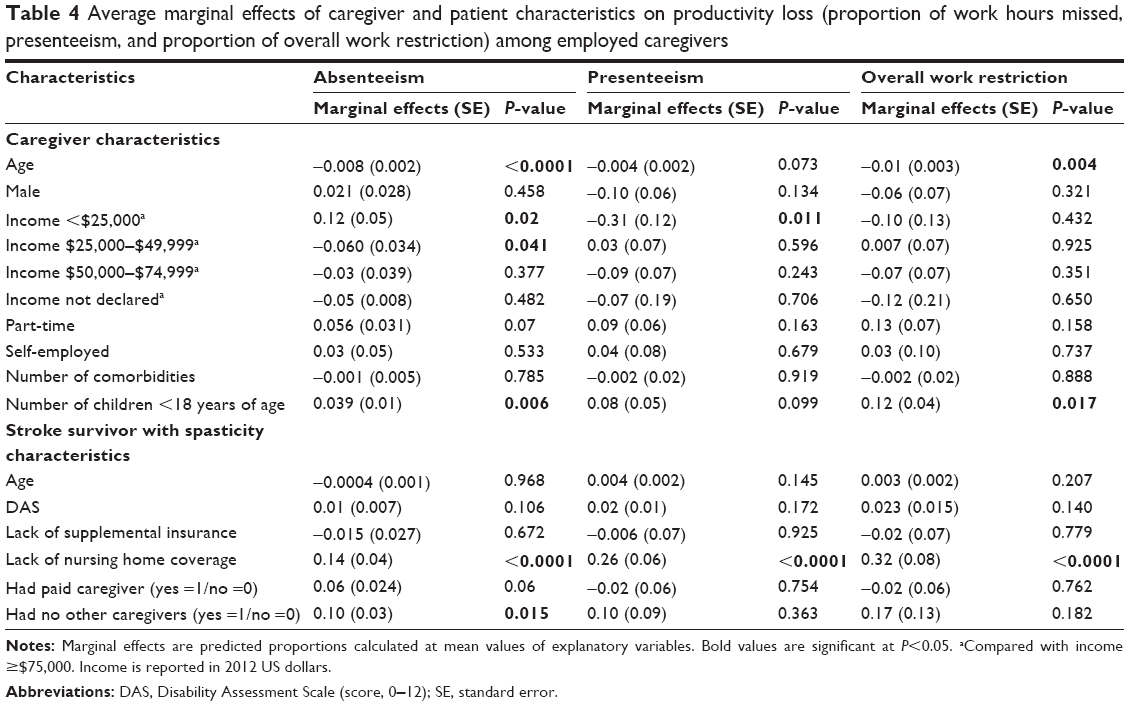 | Table 4 Average marginal effects of caregiver and patient characteristics on productivity loss (proportion of work hours missed, presenteeism, and proportion of overall work restriction) among employed caregivers |
The stroke survivor’s disability level and lack of nursing home coverage had significant associations with the caregiver’s work productivity. The predicted absenteeism, presenteeism, and overall work restriction at mean disability level (DAS score =7.0) were 15%, 30%, and 38%, respectively, which was significantly greater than the disability level at DAS score =6.0 (Figure 1). Lack of nursing home coverage on the stroke survivor’s health plan was associated with a 32% increase in the caregiver’s work restriction (P<0.001). Also, a lack of other caregivers within the family had a significant impact on work productivity with regards to absenteeism (a 10% increase in work hours lost as compared with having an additional family caregiver) but not for presenteeism or overall work restriction.
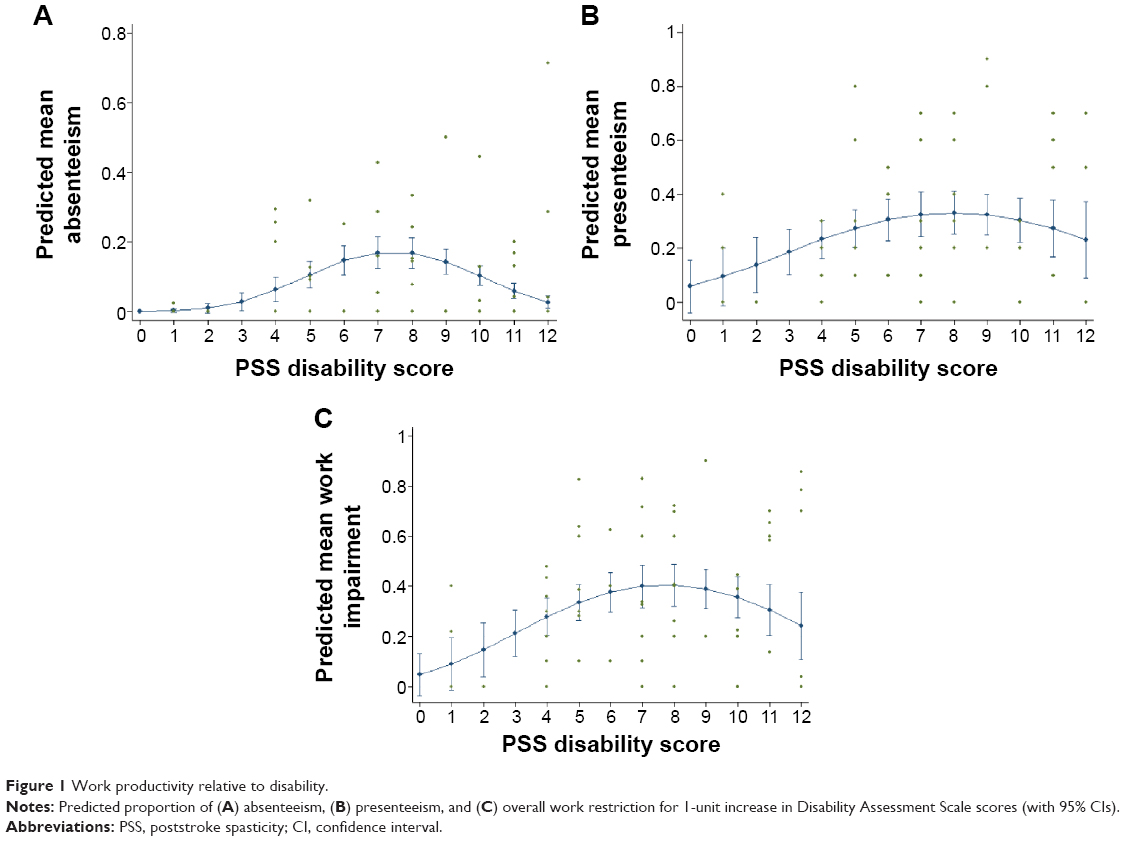 | Figure 1 Work productivity relative to disability. |
Human capital method
Using the HCM to monetize these caregiving-related work productivity figures on a per-caregiver basis, lost productivity due to absenteeism was $269 (SD =$691) per month, due to presenteeism was $598 (SD =$670) per month, and total lost productivity was $835 (SD =$1,074) per month among working caregivers (Figure 2). Annually, total lost productivity costs were >$10,000 for each employed caregiver, presenteeism contributing to 72% of these costs.
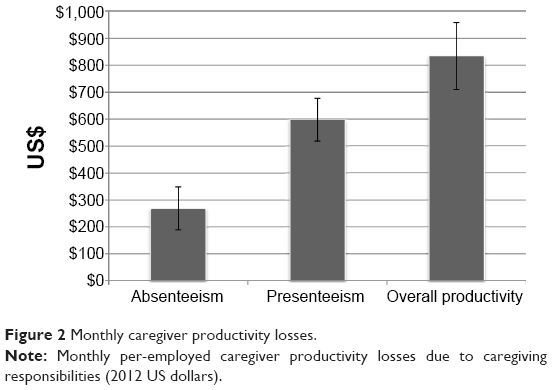 | Figure 2 Monthly caregiver productivity losses. |
Indirect costs
In addition to work-productivity costs, other significant indirect costs were incurred by the caregivers (eg, costs of travel for executing caregiving responsibilities, out-of-pocket expenditures for the stroke survivor’s health care or rehabilitation costs). Forty-one percent of PSS caregivers reported that they travel at least once weekly to visit the stroke survivor. On average, PSS caregivers spent 2.5 hours (SD =10 hours) a week in travel to visit the stroke survivor, incurring $242 (SD =$922) per month for travel. Also PSS caregivers spent, on average, $231 (SD =$655) monthly for various caregiving-related expenses. In total, personal travel time and out-of-pocket expenditures resulted in opportunity costs of $5,669 per caregiver per year.
Discussion
Spasticity is a debilitating complication of stroke, leading to increased activity limitations and participation restrictions.7 Very few studies have examined the impact of PSS on the caregiver, including burden and indirect costs associated with caregiving responsibilities.7 These results document the high burden imparted by caregiving for stroke survivors with PSS. This study found that caregivers spent a great amount of time helping stroke survivors with PSS with medical care, performing various physical tasks, and providing emotional support. Most tasks were perceived to be of mild-to-moderate difficulty by caregivers, although the amount of time spent performing these tasks was perceived as more burdensome.
The demographic characteristics of patients with PSS and their caregivers are not well characterized in the literature. To our knowledge, this is the first study to describe caregiver characteristics and quantify the economic burden of caregiving for patients with PSS. Therefore, the survey sample in this study cannot be compared with caregiver characteristics in the general PSS population. Both the NHWS Internet sample and the Lightspeed Research Internet panels, from which the study sample was derived, are representative of the US population. Based on the characteristics of stroke survivors (regardless of spasticity) reported in nationally representative US survey studies, it may be said that African–Americans could be underrepresented in our sample.3,25
The mean (SD) BCOS score in this study was 49.36 (12.84), which suggests greater burden for caregivers of stroke survivors with spasticity than the average burden reported in a study of 147 caregivers for stroke survivors who were 4 months poststroke with mild cognitive or language impairment, with or without spasticity (BCOS score, 58.4 [10.8]),16 and a study of 21 caregivers for patients with heart failure, with the majority of patients being New York Heart Association Class II and III suggesting moderate impairment (BCOS score, 54.9 [12.5]).26 However, direct comparison with these populations was not possible in the current analysis.
Caregivers experienced a high cost in productivity as measured by absenteeism, presenteeism, work productivity, and activity limitation. When monetized, the associated costs of total lost productivity were substantial, totaling >$10,000/year for each employed caregiver, with presenteeism contributing to 72% of these costs. Additionally, the number of work hours lost by PSS caregivers because of presenteeism was nearly four times that of the national average estimate (2.3 hours per week).27 The impact of PSS disability on productivity loss was found to be linear over a total DAS score range of 0–8, beyond which productivity losses were inelastic with further increase in disability, potentially because stroke survivors with higher PSS disability are more likely to avail themselves of paid caregiving or nursing home services as compared with stroke survivors with mild-to-moderate disability.
The monetary costs associated with caregiver loss of productivity were estimated using the median national wage, which likely provides a conservative estimate since the average caregiver age in this study was 51.6 years, an age likely associated with higher income than the national average. By comparison, the indirect costs (calculated using the same method) in the 2006–2008 NHWS were $9,599 for patients with type 2 diabetes plus painful peripheral diabetic neuropathy and $7,544 for patients with type 2 diabetes without neuropathy.28 Additionally, this study also suggests that opportunity costs due to caregiving tasks (eg, personal travel time, out-of-pocket expenditures) may be substantial ($5,669 per caregiver per year). In summary, the total indirect costs of PSS, which included caregiver burden, productivity losses, and opportunity costs, are considerable; therefore, the overall economic burden of PSS may be underestimated if indirect cost estimates are not considered.
This study also found that caregiver burden increased with the level of the stroke survivor’s disability. Similar findings were reported in a post hoc analysis of an open-label study of burden among caregivers of patients with upper limb PSS, which found that caregiver burden, measured by the number of hours of caregiver assistance per week, was significantly associated with increased disability in the areas of hygiene and dressing.8 Although this study lacks a direct comparison with stroke survivors without spasticity, an indirect comparison with the results for a general poststroke population observed in another study showed a moderate increase in the time component of OCBS among stroke survivors with spasticity.15
This study has several limitations. First, the main focus of this study was productivity loss among employed caregivers, who constituted only 40% of the PSS caregiver population. Compared with employed caregivers, retired caregivers spent an average of 80% more time caregiving. This suggests that the overall burden may be even greater in this population, which has societal implications despite that the economic burden may be less compared to employed caregivers.
Another study limitation can be attributed to the way in which the survey questions were asked. For example, lost productivity figures were assumed to be attributed solely to caregiving responsibilities; however, respondents may have attributed some non-caregiving-related productivity loss to caregiving responsibilities, thus inflating the perceived burden. Also, this study relied on the HCM to evaluate indirect costs, which estimates potential rather than true costs of lost productivity. In other words, the HCM does not account for the replacement of workers due to long-term absence, since adjustments would be difficult to make without job-specific data (eg, average period of vacancy within a particular profession). Alternative approaches such as the friction costs method or Washington Panel Approach (WPA) are often used to account for these types of long-term changes in employment.19 Although this study did not directly integrate productivity and quality-of-life measures (as compared to the WPA), both productivity (ie, WPAI) and quality-of-life (SF-12v2) measures provided parallel evidence of the burden associated with caregiving.
Finally, this is a descriptive study without a control arm; therefore, no comparison is made with caregivers of stroke survivors without PSS, which is a major limitation of this study. Although this study provides additional evidence for the burden associated with PSS, there are some studies that acknowledge that spasticity contributes to severe disability, including motor and activity limitations, however suggest that stroke with spasticity does not necessarily hold greater clinical relevance than stroke without spasticity.29 Hence, more research on indirect costs due to PSS is warranted.
In summary, the results of this study highlight the substantial burden of PSS caregiving responsibilities. Easing the burden for these caregivers may have a considerable societal impact, from a humanistic and economic standpoint. Employed caregivers should be encouraged to consider Family Medical Leave Act provisions for unpaid leave, and seek professional help to bolster retirement savings and investments. Also, employers should be encouraged to offer well-designed and flexible work option plans that may improve the work productivity of employed caregivers of PSS survivors.
Acknowledgment
This study was supported by Allergan, Inc. Glenn D Graham, Marco D DiBonaventura, Amir Goren, and Richard D Zorowitz consulted on this study and provided analytical, research, and editorial support. Allergan, Inc. provided funding for the data source. Assistance with the writing and development of the manuscript was provided by Kristine W Schuler, MS; Robert Axford-Gatley, MD; and Amanda Kelly, MPhil, MSHN of Complete Healthcare Communications and Jessica Deckman, PhD of Evidence Scientific Solutions, and was funded by Allergan, Inc. All authors met the ICMJE authorship criteria. Neither honoraria nor payments were made for authorship.
Vaidyanathan Ganapathy was employed by Allergan (Irvine, CA, USA) at the time of the study; and is currently an employee of Sunovion Pharmaceuticals (Marlborough, MA, USA). Richard D Zorowitz was employed by Johns Hopkins Bayview Medical Center (Baltimore, MD, USA); and is currently an employee of MedStar National Rehabilitation Network (Washington, DC, USA).
Disclosure
Vaidyanathan Ganapathy was an employee of Allergan, Inc. at the time of the study. Glenn D Graham is a consultant to Allergan, Inc. Marco D DiBonaventura was an employee of Kantar Health at the time of the study. Patrick J Gillard is an employee of Allergan, Inc. and receives stock in the company. Amir Goren was an employee of Kantar Health at the time of the study. Kantar Health received funding to carry out the research study and perform the analysis. Richard D Zorowitz is a consultant to Allergan, Inc. The authors report no other conflicts of interest in this work.
References
Go AS, Mozaffarian D, Roger VL, et al. Heart disease and stroke statistics – 2014 update: a report from the American Heart Association. Circulation. 2014;129:e28–e292. | ||
Minino AM, Xu J, Kochanek KD. Deaths: preliminary data for 2008. Natl Vital Stat Rep. 2010;59(2):1–52. | ||
Joo H, Dunet DO, Fang J, Wang G. Cost of informal caregiving associated with stroke among the elderly in the United States. Neurology. 2014;83:1831–1837. | ||
Rigby H, Gubitz G, Phillips S. A systematic review of caregiver burden following stroke. Int J Stroke. 2009;4:285–292. | ||
Cumming TB, Cadilhac DA, Rubin G, et al. Psychological distress and social support in informal caregivers of stroke survivors. Brain Impairment. 2008;9(2):152–160. | ||
Lundstrom E, Terent A, Borg J. Prevalence of disabling spasticity 1 year after first-ever stroke. Eur J Neurol. 2008;15:533–539. | ||
Zorowitz RD, Gillard PJ, Brainin M. Poststroke spasticity: sequelae and burden on stroke survivors and caregivers. Neurology. 2013;80:S45–S52. | ||
Doan QV, Brashear A, Gillard PJ, et al. Relationship between disability and health-related quality of life and caregiver burden in patients with upper limb poststroke spasticity. PM R. 2012;4:4–10. | ||
Thompson AJ, Jarrett L, Lockley L, Marsden J, Stevenson VL. Clinical management of spasticity. J Neurol Neurosurg Psychiatry. 2005;76:459–463. | ||
Denno MS, Gillard PJ, Graham GD, et al. Anxiety and depression associated with caregiver burden in caregivers of stroke survivors with spasticity. Arch Phys Med Rehabil. 2013;94:1731–1736. | ||
Ware JE. SF-12v2: How to Score Version 2 of the SF-12 Health Survey (with a Supplement Documenting Version 1). Lincoln, RI: QualityMetric Incorporated; 2002. | ||
Kroenke K, Spitzer RL. The PHQ-9: a new depression diagnostic and severity measure. Psychiatr Ann. 2002;32:509–521. | ||
Brashear A, Zafonte R, Corcoran M, et al. Inter- and intrarater reliability of the Ashworth Scale and the Disability Assessment Scale in patients with upper-limb poststroke spasticity. Arch Phys Med Rehabil. 2002;83:1349–1354. | ||
Carey PJ, Oberst MT, McCubbin MA, Hughes SH. Appraisal and caregiving burden in family members caring for patients receiving chemotherapy. Oncol Nurs Forum. 1991;18:1341–1348. | ||
Bakas T, Austin JK, Jessup SL, Williams LS, Oberst MT. Time and difficulty of tasks provided by family caregivers of stroke survivors. J Neurosci Nurs. 2004;36:95–106. | ||
Bakas T, Champion V, Perkins SM, Farran CJ, Williams LS. Psychometric testing of the revised 15-item Bakas Caregiving Outcomes Scale. Nurs Res. 2006;55:346–355. | ||
Reilly MC, Zbrozek AS, Dukes EM. The validity and reproducibility of a work productivity and activity impairment instrument. Pharmacoeconomics. 1993;4:353–365. | ||
Wolff JL, Rand-Giovannetti E, Palmer S, et al. Caregiving and chronic care: the guided care program for families and friends. J Gerontol A Biol Sci Med Sci. 2009;64:785–791. | ||
Tranmer JE, Guerriere DN, Ungar WJ, Coyte PC. Valuing patient and caregiver time: a review of the literature. Pharmacoeconomics. 2005;23:449–459. | ||
US Bureau of Labor Statistics. Highlights of women’s earnings in 2009. Report 1025. US Department of Labor, US Bureau of Labor Statistics; 2010. | ||
Wright J. Characteristics of the self-employed. Available from: http://www.economicmodeling.com/2012/07/18/characteristics-of-the-self-employed/. Accessed December 3, 2013. | ||
Belenky P. The Value of Travel Time Savings: Departmental Guidance for Conducting Economic Evaluations, Revision 2. Washington, DC: United States Department of Transportation; 2011. | ||
Papke LE, Woolridge JM. Econometric methods for fractional response variables with an application to 401 (k) plan participation rates. Journal of Applied Econometrics. 1993;11:619–632. | ||
Wooldridge JM. Inverse probability weighted M-estimators for sample selection, attrition, and stratification. Portuguese Economic Journal. 2002;1:117–139. | ||
Hickenbottom SL, Fendrick AM, Kutcher JS, et al. A national study of the quantity and cost of informal caregiving for the elderly with stroke. Neurology. 2002;58:1754–1759. | ||
Bakas T, Pressler SJ, Johnson EA, Nauser JA, Shaneyfelt T. Family caregiving in heart failure. Nurs Res. 2006;55:180–188. | ||
Levy DJ. Presenteeism: A Method for Assessing the Extent of Family Caregivers in the Workplace and their Financial Impact. Coconut Creek, FL: American Association for Caregiver Education; 2014. | ||
DiBonaventura M, Cappelleri JC, Joshi AV. A longitudinal assessment of painful diabetic peripheral neuropathy on health status, productivity, and health care utilization and cost. Pain Med. 2011;12:118–126. | ||
Sommerfeld DK, Eek EU, Svensson AK, Holmqvist LW, von Arbin MH. Spasticity after stroke: its occurrence and association with motor impairments and activity limitations. Stroke. 2004;35:134–139. |
 © 2015 The Author(s). This work is published and licensed by Dove Medical Press Limited. The
full terms of this license are available at https://www.dovepress.com/terms
and incorporate the Creative Commons Attribution
- Non Commercial (unported, 3.0) License.
By accessing the work you hereby accept the Terms. Non-commercial uses of the work are permitted
without any further permission from Dove Medical Press Limited, provided the work is properly
attributed. For permission for commercial use of this work, please see paragraphs 4.2 and 5 of our Terms.
© 2015 The Author(s). This work is published and licensed by Dove Medical Press Limited. The
full terms of this license are available at https://www.dovepress.com/terms
and incorporate the Creative Commons Attribution
- Non Commercial (unported, 3.0) License.
By accessing the work you hereby accept the Terms. Non-commercial uses of the work are permitted
without any further permission from Dove Medical Press Limited, provided the work is properly
attributed. For permission for commercial use of this work, please see paragraphs 4.2 and 5 of our Terms.