Back to Journals » Clinical Epidemiology » Volume 10
Cardiovascular medication changes over 5 years in a national data linkage study: implications for risk prediction models
Authors Mehta S, Jackson R ![]() , Wells S, Harrison J
, Wells S, Harrison J ![]() , Exeter DJ, Kerr AJ
, Exeter DJ, Kerr AJ
Received 29 March 2017
Accepted for publication 25 September 2017
Published 15 January 2018 Volume 2018:10 Pages 133—141
DOI https://doi.org/10.2147/CLEP.S138100
Checked for plagiarism Yes
Review by Single anonymous peer review
Peer reviewer comments 3
Editor who approved publication: Professor H Sorensen
Suneela Mehta,1 Rod Jackson,1 Sue Wells,1 Jeff Harrison,2 Daniel J Exeter,1 Andrew J Kerr1,3
1Section of Epidemiology and Biostatistics, 2School of Pharmacy, University of Auckland, 3Cardiology Services, Middlemore Hospital, Auckland, New Zealand
Background: Despite widespread use of cardiovascular disease (CVD) preventive medications in cohorts used to develop CVD risk prediction models, only some incorporate baseline CVD pharmacotherapy and none account for treatment changes during study follow-up. Therefore, current risk prediction scores may underestimate the true CVD event risk. We examined changes in CVD pharmacotherapy over 5 years in preparation for developing new 5-year risk prediction models.
Methods: Anonymized individual-level linkage of eight national administrative health datasets enabled identification of all New Zealanders aged 30–74 years, without prior hospitalization for CVD or heart failure, who utilized publicly funded health services during 2006. We determined proportions of participants dispensed blood pressure lowering, lipid lowering, and antiplatelet/anticoagulant pharmacotherapy at baseline in 2006, and the proportion of person years of follow-up (2007–2011) where dispensing occurred.
Results: The study population comprised of 1,766,584 individuals, representing ~85% of all New Zealanders aged 30–74 years without prior CVD or heart failure in 2006, with mean follow-up of 4.9 years (standard deviation 0.6 years; 8,589,931 total person years). CVD medications were dispensed to 21% of people at baseline, with most single or combination pharmacotherapies continuing for ≥80% of follow-up. Complete discontinuation of baseline treatment accounted for 2% of follow-up time while CVD pharmacotherapy that commenced after baseline accounted for 7% of total follow-up time.
Conclusion: In a national primary prevention cohort of 30–74 year olds, one in five received baseline CVD primary preventive pharmacotherapy and medication changes over the subsequent 5 years were modest. Baseline medication use is an important consideration when estimating CVD risk from modern cohorts. It is currently unclear how to incorporate available methods to account for treatment changes during follow-up into risk prediction scores, but this study demonstrates that baseline therapy captures most of the effect of treatment in 5-year risk models. However, the impact of treatment changes on the more common 10-year risk models requires further investigation.
Keywords: cardiovascular diseases, primary prevention, drug therapy, routine data, record linkage
Introduction
In many countries, including New Zealand, an individual’s predicted cardiovascular disease (CVD) risk is now recommended as a basis for clinical decisions regarding CVD management, rather than the historical approach of modifying high levels of single risk factors. Risk prediction models are highly influenced by the average event rates in the cohort studies used to develop them and a potential problem affecting CVD risk scores is the attenuation of CVD event rates due to treatment with medications over the course of a study.
In theory, risk prediction models for use in untreated people without a previous history of CVD would be developed in cohorts of patients who are medication-free for the study duration, to determine the actual relationship between risk factors and CVD occurrence.1 However, this approach would be both unrealistic and unethical today, since use of lipid lowering medications, blood pressure lowering agents, and platelet inhibitors for the primary prevention of CVD has increased markedly over the last 20–30 years.1–3 In New Zealand, CVD medications are all government-subsidized and comprised four of the 10 most frequently prescribed publicly funded pharmaceuticals in 2015.4 Furthermore, accurate CVD risk assessment is also desirable in those already receiving CVD pharmacotherapy to determine if additional interventions would be beneficial.
Most contemporary risk prediction scores are derived in cohorts where CVD medication use is common, but many of these models do not assess or adjust for preventive pharmacotherapy. In a review published in 2011 of models predicting risk of a CVD event among individuals without a previous history of the disease, Liew et al found that prior treatment was described in the baseline cohort characteristics for only 14 of the 21 risk algorithms identified.1 Baseline antihypertensive treatment was reported for the study populations of all 14 of these scores, considered as a risk predictor in 10 and retained in seven of the final risk scores. Prior use of lipid lowering (LL) medications was reported in two studies, and was a candidate predictor in both but was not included in either final score. Furthermore, none of the 21 risk algorithms described prior use of antiplatelet agents or new treatment with any CVD medications during follow-up. The authors suggested that failure to assess and adjust for the effect of treatment on the study cohort, and particularly medications commenced during follow-up, will result in risk algorithms that underestimate the true CVD risk, which has important implications for CVD risk management decisions.
In New Zealand, assessment of CVD risk over a 5-year period is currently undertaken using a risk score based on the Framingham Heart Study data that does not account for CVD pharmacotherapy, either at baseline or during follow-up.5 These Framingham models, like other available CVD risk scores, are intended for use in clinical settings. They cannot characterize risk across a national primary prevention population and inform population-level decision making to reduce CVD burden since they require clinical risk factor data such as blood pressure measurements, lipid levels, and smoking status that are not available countrywide. Furthermore, CVD risk prediction tools derived from local data are desirable as no available risk model encompasses the diverse ethnic composition of New Zealand, which includes high-risk Maori, Pacific, and South Asian subpopulations. Therefore, we intend to develop new 5-year risk prediction models based solely on New Zealand administrative health data that would be the first CVD risk scores that could be applied at the individual-level across a whole country. To our knowledge, no local or international studies have quantified changes in CVD pharmacotherapy over time in a contemporary primary prevention cohort, which would provide insight into whether CVD pharmacotherapy at baseline and treatment changes during follow-up are both important when predicting 5-year CVD risk. We have identified all adult New Zealanders who utilized publicly funded health services in New Zealand during 2006 and had no prior history of hospitalizations for CVD or heart failure. The objective of this study was to examine the frequency of CVD medication dispensing at baseline and over 5 years of follow-up within this national primary prevention cohort.
Methods
Study population and data sources
Data from eight New Zealand national health databases were anonymously linked at the individual-level to identify every New Zealand resident aged 30–74 years who had contact with publicly funded health services during 2006 and was still alive on December 31, 2006. The eight linked databases comprised data for demographic characteristics, hospitalizations, outpatient visits, primary care enrollment, primary care reimbursement (to capture primary care visits by non-enrolled patients), community laboratory requests, community pharmaceutical dispensing (PHARMS), and mortality. Linkage was undertaken using an encrypted version of the National Health Index (NHI) number which is assigned to everyone who has contact with the New Zealand health system, and which uniquely identifies over 98% of the New Zealand population in the national health data.6 Individuals with duplicate NHIs were identified (n=407,158) and their health records were assigned to a single personal identifier prior to linkage. Range checks of data were undertaken pre- and post-linkage to validate the quality of the linkage process.
The lower age limit for inclusion was set at 30 years as very few people below this age are treated with medications for the primary prevention of CVD. People up to 74 years were included as this corresponds to the upper age limit of recommendations for cardiovascular pharmacotherapy in the New Zealand CVD risk management guidelines; among New Zealanders aged ≥75 years, consideration of CVD medications is dependent on the clinical judgement of the health professional involved. Individuals were subsequently excluded if they had been hospitalized between January 1, 1993 and December 31, 2006 for CVD or heart failure. (The International Classification of Diseases 9 and 10 codes used are listed in the Supplementary materials.)
CVD medication dispensing data
The PHARMS national database records dispensing of all publicly funded medications by New Zealand community pharmacies. In 2006, 91% of all medication dispensing episodes nationally were identifiable by an NHI number and this increased to 96% by 2011 (R Hipkiss, New Zealand Ministry of Health, personal communication, March 2014).
Dispensing of all classes of LL, blood pressure lowering (BPL), and antiplatelet/anticoagulant (APL) medications was considered (Supplementary material details classes of medications included in the study). For LL, BPL, and APL medications, dispensing at least once between July 1, 2006 and December 31, 2006 (ie, baseline) and at least once in each 6-month period between January 1, 2007 and December 31, 2011 (ie, follow-up) was recorded. Dispensed dosages were not considered as our study involved around 90 different cardiovascular medications. We are unaware of any analytical approach that would enable the wide range of dosages across multiple medications with different potencies to be meaningfully accounted for in a descriptive study or in the development of risk prediction models. Medications are typically prescribed for 3 months in New Zealand, but we defined medication status based on 6-month periods to account for people who filled their prescriptions late. Six-month periods of follow-up were included until the date of death or hospitalization for CVD or heart failure or December 31, 2011, but we were unable to determine whether individuals left the country during the follow-up period. Incomplete 6-month periods of data, which occurred when individuals died or were hospitalized for CVD during a 6-month interval, were discarded.
Outcome measures
The outcome measures were 1) numbers and proportions of people dispensed medications at baseline, and 2) numbers and proportions of 6-month periods during follow-up where dispensing occurred, reported as person years on medication or not. For example, dispensing in four 6-month periods equals two person years of medication.
Statistical analysis
All statistical analyses were carried out using STATA version 12.1 (StataCorp LP, College Station, TX, USA).
The numbers and proportions of the study population who were 1) not dispensed baseline CVD medications, and 2) dispensed one or more baseline CVD medications were determined. Within these two baseline treatment categories, the numbers and proportions of person years of follow-up time during which no medications were dispensed (ie, untreated) or where any CVD medications were dispensed (ie, treated) were established. Similar calculations were undertaken for dispensing of LL, BPL, and APL medications at baseline and during follow-up.
Medication dispensing during follow-up was then stratified according to dispensing of each of the seven possible categories of sole or combination therapy at baseline. The seven baseline categories were LL only, BPL only, APL only, LL and BPL only, LL and APL only, BPL and APL only, and triple therapy with LL, BPL, and APL. For each baseline category, we determined the proportion of person years of follow-up time where dispensing of LL, BPL, APL, or any CVD medication was recorded.
Sensitivity analyses of medication dispensing during follow-up stratified by baseline dispensing were also undertaken within 15-year age bands.
Ethical approval
This study is part of the VIEW research programme which was approved by the Northern Region Ethics Committee Y in 2003 (AKY/03/12/314), with subsequent annual re-approval by the national Multi-Region Ethics Committee since 2007 (MEC/01/19/EXP). Individual patient consent was not required as all data were anonymized.
Results
During 2006, 1,888,078 New Zealand residents aged 30–74 years had contact with New Zealand publicly funded health services and were still alive at the end of the year (comprising 86% of the corresponding 2006 New Zealand Census Estimated Resident Population). Of these, 121,539 people (6.4%) with prior hospitalization for CVD or heart failure were excluded. The baseline characteristics of the remaining 1,766,584 individuals are shown in Table 1. Of these, 55% were women, 80% were aged between 30–59 years, and Maori, Pacific, and Asian ethnic groups comprised 21% of the cohort.
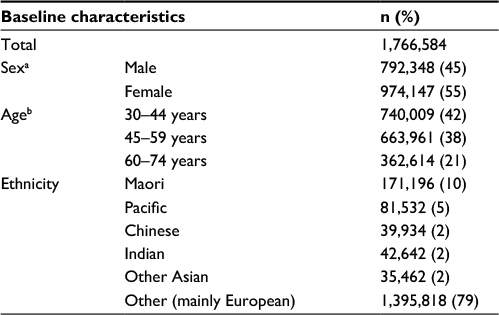 | Table 1 Baseline characteristics for New Zealand residents aged 30–74 years at December 31, 2006 without prior CVD or heart failure hospitalizations Notes: aThe male and female totals exclude 89 people included in the study population whose sex could not be identified in the available New Zealand health databases. bThe proportions of the study population corresponding to each 15-year age band do not add to 100% due to rounding. Abbreviation: CVD, cardiovascular disease. |
Figure 1 presents dispensing among the study population at baseline and during the follow-up period (8,589,931 person years; mean 4.9 years and standard deviation 0.6 years). At baseline, one or more CVD medications were dispensed to 21% (n=373,422) of the study population with dispensing of BPL medications to 17% of the study population (n=300,995), LL pharmacotherapy to 9% (n=166,640), and APL agents to 6% (n=102,051). Discontinuation of all baseline medications (ie, stopping all treatment) accounted for 2% of overall person years of follow-up. Dispensing of pharmacotherapy in the follow-up period among people untreated at baseline occurred during 7% of the total follow-up time. Taking into account medication changes during follow-up, BPL medications were dispensed in 20% of total person years of follow-up, LL pharmacotherapy in 13%, and APL agents in 9%.
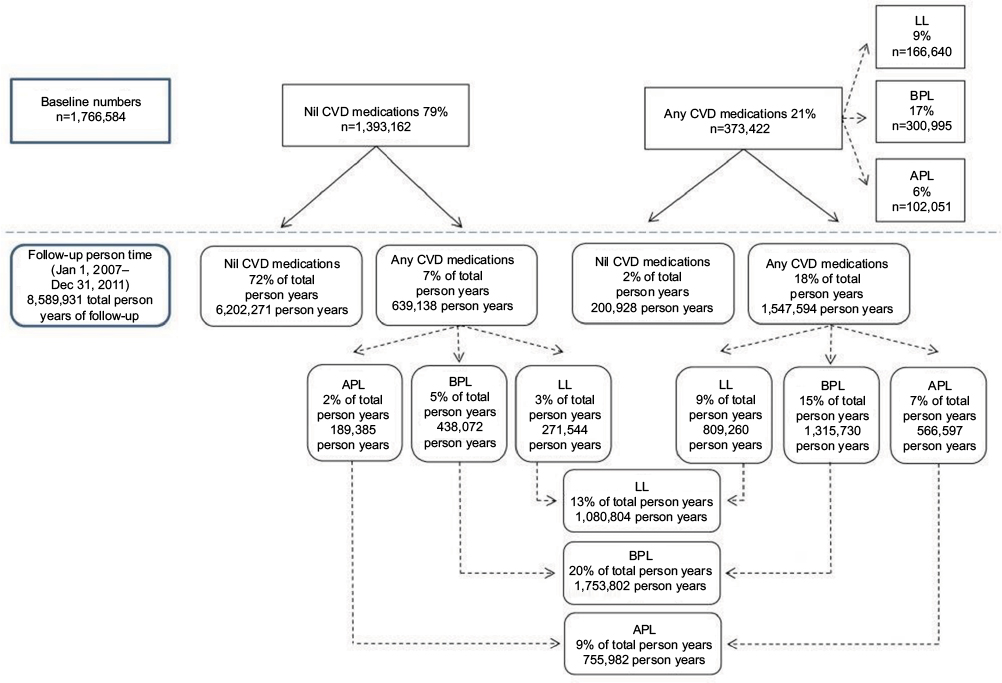 | Figure 1 CVD medications dispensed at baseline (July 1, 2006–December 31, 2006) and follow-up (January 1, 2007–December 31, 2011) among 1,766,584 New Zealand residents aged 30– 74 years on December 31, 2006 without a history of CVD or heart failure. Notes: The APL, BPL, and LL medication categories were not exclusive (eg, a person included in the LL category could also be included in the BPL and/or APL categories). For each medication category, dispensing was recorded if it occurred 1) at least once between July 1, 2006 and December 31, 2006 (ie, baseline), or 2) at least once in each 6-month period between January 1, 2007 and December 31, 2011 (ie, follow-up). During follow-up, only those 6-month periods where each New Zealand resident was alive and CVD event-free for the entire 6 months were included. The proportions of person years of follow-up where nil CVD medication or any CVD medications were dispensed do not add to 100% due to rounding. Abbreviations: APL, antiplatelet and/or anticoagulant medications; BPL, blood pressure lowering medications; LL, lipid lowering medications; CVD, cardiovascular disease. |
Table 2 presents follow-up dispensing stratified by the seven possible categories of baseline sole or combination therapy. For example, the first row of the table indicates that 48,960 individuals aged 30–74 years were dispensed LL medications only at baseline and together contributed 236,585 person years of follow-up from 2007 to 2011 inclusive (mean 4.8 years; standard deviation 0.7 years). One or more CVD medications were dispensed during 82% of these collective person years of follow-up, with LL agents dispensed during 80% and BPL and APL pharmacotherapy dispensed during 16% and 14%, respectively, of follow-up time. Across the study population, baseline combinations of CVD pharmacotherapy were maintained for ≥80% of the corresponding follow-up person years with the exception of APL agents which were continued for ≥52% of relevant follow-up time.
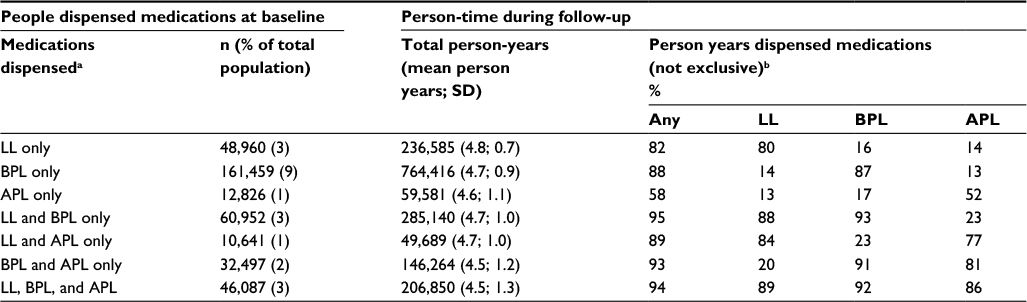 | Table 2 CVD medications dispensed during follow-up (January 1, 2007–December 31, 2011) according to baseline dispensing (July 1, 2006–December 31, 2006) among 1,766,584 New Zealand residents aged 30–74 years on December 31, 2006 without prior CVD or heart failure hospitalizations Notes: aThe medication categories considered at baseline were exclusive (eg, a person included in the LL and BPL category was not dispensed APL medications). bThe APL, BPL, and LL medication categories considered during the follow-up period were not exclusive (eg, a person included in the LL category could also be included in the BPL and/or APL categories). Abbreviations: APL, antiplatelet and/or anticoagulant medications; BPL, blood pressure lowering medications; LL, lipid lowering medications; SD, standard deviation; CVD, cardiovascular disease. |
Sensitivity analyses of dispensing among the study population stratified by 15-year age bands indicated that baseline dispensing of any CVD medication was recorded for 5% of 30–44 year olds, 23% of the 45–59 year group, and 50% of people aged 60–74 years. In each age group respectively, commencement of one or more medications in the follow-up period among people untreated at baseline occurred during 4%, 9%, and 12% of follow-up time and complete discontinuation of baseline medications during 1%, 3%, and 3% of total follow-up. When categories of sole or combination baseline therapy were considered within each 15-year age band, the proportion of corresponding follow-up time where BPL and LL medications were continued was ≥67% among people aged 30–44 years, ≥80% in the 45–59 year group, and ≥86% for 60–74 year olds. Sole or combination APL baseline therapy was continued for a lower proportion of follow-up time across the three age bands (≥36%, ≥54%, and ≥70% of person years of follow-up, respectively). Further detail is presented in the Supplementary materials.
Discussion
Principal findings
In a New Zealand-wide CVD primary prevention cohort comprising almost 1.8 million people aged 30–74 years in 2006 and followed up for 5 years, one in five individuals received cardiovascular medications at baseline. Complete discontinuation of baseline medications occurred during 2% of total follow-up time with commencement of one or more medications between 2007 and 2011 inclusive among people untreated at baseline during 7% of person years of follow-up. The seven possible sole or combination therapy categories were continued for at least 80% of the corresponding follow-up, except for APL agents which were continued for ≥52% of follow-up person years.
Strengths and limitations
Our findings address a conspicuous gap in the international literature raised by Liew et al who found that CVD preventive medications are inadequately considered as candidate predictors in current CVD risk scores and who suggested that cohort studies used to develop risk prediction models should quantify the use of CVD pharmacotherapy at baseline and over time.1 To our knowledge, this is the only study where preventive pharmacotherapy with the three main classes of cardiovascular medications has been described during a multiyear follow-up within a nationally representative CVD primary prevention population.
We identified 86% of all 30–74 year old New Zealand residents enumerated by the 2006 census in our cohort, before the exclusion criterion regarding history of hospitalizations for CVD or heart failure was applied. Furthermore, the proportion of the census population included in our cohort increased with age from 80% of 30–44 year olds up to 91% of people aged 55–64 years and 97% of 65–74 year olds. Data were sourced from comprehensive nationally administered databases, with the majority of the study population identified from the primary care enrollment database. Since 95% of New Zealanders are voluntarily enrolled with a primary care provider over a 3-year period, this database includes most New Zealanders.7 Medication data came from a national pharmaceutical claims dataset, which is generated when community pharmacists dispense medications. As all commonly prescribed CVD preventive medications are subsidized by the government in New Zealand and pharmacists must claim for the dispensed medications in order to receive this subsidy, these data are likely to be almost complete and therefore reflect patterns of CVD pharmacotherapy across the New Zealand population. The proportion of 6-month periods of follow-up time where dispensing occurred at least once was used as a simple and logical metric of dispensing as we were unable to ascertain the proportion of days within each 6-month interval of the study period where dispensing occurred.
The main limitations of our study, as with all studies involving routinely collected data, relate to issues of data reliability and availability. We excluded patients with CVD and heart failure from our study population using publicly funded hospitalization data, but disease coding undertaken primarily for administrative rather than clinical purposes may have introduced some misclassification bias. Studies conducted in European countries indicate that hospital discharge diagnoses of CVD, coronary heart disease, and heart failure have reasonable validity,8–10 but the only New Zealand validation study was published in the 1980s,11 and analyses of recent national data are required.
The New Zealand routine health databases also do not capture CVD or heart failure diagnosed through primary care interactions or in the private health care sector. However, the resultant misclassification bias is likely to be small for two reasons. Firstly, most patients aged 30–74 years with CVD or heart failure diagnosed in the private sector are likely to have had at least one publicly funded health contact between 1993 and 2006 where diagnostic data would be captured. Secondly, data from a large New Zealand primary care cohort12 (which currently comprises over 450,000 individuals) indicate that >70% of CVD diagnoses for 30–74 year olds made in the public health system are captured by national hospitalization data (R Pylypchuk, unpublished data, September 2015).
Another limitation is the lack of clinical information regarding the presence of CVD risk factors, such as a high blood pressure, which are likely to influence use of CVD medications within the study population but are not currently collected in national routine health datasets. Similarly, emigration data that would enable identification of individuals who left the country during the follow-up period were unavailable. Therefore, our study is likely to have slightly overestimated discontinuation of baseline medications during follow-up and, to a lesser extent, slightly underestimated new treatment after baseline.
Although we examined baseline treated or untreated status and commencement and discontinuation of medications during follow-up, which are the aspects of pharmacotherapy that will have the greatest effect on CVD event rates, different baseline dosages and dosage alterations after baseline will also influence CVD risk (albeit to a lesser degree). We did not incorporate medication dosages given the varied dosage ranges and differing potencies of the multiple medications included in our study. We also did not consider medication intolerance and side effects, or over-the-counter sales of aspirin when determining APL use within our study population, as these data are not available from the national pharmaceutical dispensing database. In New Zealand, however, aspirin prescriptions are heavily subsidized (with a 3-month supply costing no more than NZ$5.00) and are therefore the preferred method of obtaining the medication among regular users.13
Comparison to other studies
Among the cohorts identified by Liew et al where baseline use of BPL medications was reported (and from which 14 primary prevention risk scores resulted), treatment levels ranged from 5% for men and 7% for women in the QRISK2 2008 study14 to 24% for men and 32% for women included in the Personal Heart 2007 cohort.15 In the study population used to derive the American Heart Association and the American College of Cardiology risk score that was published in 2013, baseline use of BPL medications was recorded for 31% of men and 41% of women of African American ethnicity, and 17% of men and 19% of women in the “White” sub-cohort.16 We chose not to disaggregate baseline and follow-up medication use by sex as dispensing of pharmacotherapy was similar for men and women. For example, BPL medications were dispensed at baseline to 17% of our total study population and 17% of men and women separately. The two published risk prediction studies that considered prior treatment with LL agents reported baseline LL therapy in 3% of a US cohort of 25,000 women recruited from 1992 to 199517 and among 17% of 10,700 men in a US cohort recruited from 1995 to 1997,18 compared to 9% of our total study population. The differences between the BPL and LL treatment levels in our study population and these other cohorts likely reflect a number of factors including marked heterogeneity in selection criteria (such as age range), differences in risk factor distributions between populations, and changes over time in the rationale for initiating treatment from single risk factor management to treating global CVD risk.
As far as we are aware, no other cohort studies used to develop risk prediction models or nationally representative cohort analyses have examined baseline use of APL medications or treatment changes over time. We are therefore unable to make meaningful international comparisons for these aspects of CVD preventive pharmacotherapy. However, our results indicate that in a New Zealand primary prevention context, only 6% of 30–74 year olds were dispensed APL medications in 2006 and initiation of pharmacotherapy over a 5-year period among people untreated at baseline was modest, although it increased with age.
Across the spectrum of age and CVD medication categories, our study also suggests that most New Zealanders receiving primary preventive pharmacotherapy at a particular point in time continue medications for the majority of the following 5 years, and few discontinue medications completely. The steady maintenance of CVD treatment in our cohort is supported by some studies,19–21 but is in contrast to a number of other longitudinal studies that have demonstrated waning treatment rates over time.22–25 In New Zealand, all cardiovascular medications are heavily subsidized and the reduced financial barriers to treatment are likely to facilitate maintenance of CVD pharmacotherapy.
Implications of the study
Our results have important implications for clinicians using CVD risk scores to guide patient management, and also for those considering how best to address the effect of treatment when developing models that predict future risk of CVD events. Firstly, risk prediction scores derived from modern cohort studies should consider baseline medication use, unless all members of the cohort are untreated at study commencement. An individual receiving preventive pharmacotherapy will have a higher CVD risk than another individual who has similar risk factors but is untreated, since the initiation of medication at some point prior to the study period reflects a longstanding exposure to elevated risk factors.26 From a clinical perspective, therefore, treatment decisions should be based on CVD risk scores that incorporate baseline medication status as the use of risk tools that do not account for pharmacotherapy may compromise the accuracy of risk estimates.
Secondly, our results suggest that 5-year risk models that include baseline pharmacotherapy will account for the majority of the effect of treatment during follow-up among people up to 75 years of age without a history of CVD. This is a valuable insight for those developing new 5-year risk prediction models, since methodologies involving time varying covariates can capture the relationship between pharmacotherapy changes during study follow-up and CVD event occurrence but it is unclear how to integrate these methods into CVD risk scores that rely solely on baseline data. By contrast, it is relatively easy to include additional variables in risk models to account for baseline treatment. However, new treatment is likely to be initiated more frequently after study commencement among those at greater risk, so the degree to which baseline therapy captures the effect of treatment during follow-up will be less among high-risk groups. These inferences in relation to a 5-year time period for risk prediction are likely to be applicable in other high income countries, since treatment levels are liable to be similar to those in New Zealand.
Unanswered questions and future research
The majority of CVD risk prediction models estimate risk over 10 years and the frequency of new treatment will be greater over this period, particularly in older people, than observed in our 5-year study. Therefore, studies quantifying use of CVD pharmacotherapy over 10-year follow-up periods are required.
Conclusion
In a New Zealand-wide CVD primary prevention cohort comprising almost 1.8 million people aged 30–74 years, one in five patients received cardiovascular medications at baseline and commencement of new treatment over 5 years of follow-up was modest. Baseline use of medications should be considered when estimating CVD risk. Further research is required to determine how to incorporate available methodologies for modeling changes in CVD pharmacotherapy over time into CVD risk prediction scores. In the meantime, 5-year risk prediction models that include baseline treatment will account for the majority of the follow-up treatment effect in people up to 74 years of age. However, the impact of treatment changes over time on the more common 10-year models requires further investigation.
Data access and data sharing
All authors had access to the data (including the national administrative health databases used to construct the study population and statistical reports and tables) and take responsibility for the integrity of the data and the accuracy of the data analysis. All data were obtained from the New Zealand Ministry of Health. Access to the dataset and the programming code used in this study can be requested by contacting the corresponding author, and would be subject to approval by the Vascular Informatics Using Epidemiology and the Web (VIEW) research programme steering group and the New Zealand Ministry of Health and ethical approval by the New Zealand Multi-Region Ethics Committee if required.
Acknowledgments
The authors wish to thank Grant Hanham for assistance with data management, and Dr Katrina Poppe (University of Auckland) for reviewing the draft manuscript.
Disclosure
All authors, except JH, were supported by the Health Research Council of New Zealand, and SW was supported by the Stephenson Foundation for this study. SW has received a grant from Roche Diagnostics Ltd for research outside the submitted work.
The authors report no other conflicts of interest in this work.
References
Liew SM, Doust J, Glasziou P. Cardiovascular risk scores do not account for the effect of treatment: a review. Heart. 2011;97:689–697. | ||
Piepho RW, Beal J. An overview of hypertensive therapy in the 20th century. J Clin Pharmacol. 2000;40:967–977. | ||
Endo A. The discovery and development of HMG-CoA reductase inhibitors. J Lipid Res. 1992;33:1569–1582. | ||
Pharmaceutical Management Agency. Annual Review 2014. Wellington: Pharmaceutical Management Agency; 2014. | ||
Ministry of Health (New Zealand). Cardiovascular Disease Risk Assessment, Updated 2013 (New Zealand Primary Care Handbook 2012). Wellington: Ministry of Health (New Zealand); 2013. | ||
Ministry of Health (New Zealand). National Health Index Data Dictionary (version 5.3). Wellington: Ministry of Health (New Zealand); 2009. | ||
Ministry of Health (New Zealand). Primary care data and stats. Wellington: Ministry of Health (New Zealand); 2015 [cited February 10, 2016]. Available from: http://www.health.govt.nz/nz-health-statistics/health-statistics-and-data-sets/primary-care-data-and-stats. Accessed February 10, 2016. | ||
Payne RA, Abel GA, Simpson CR. A retrospective cohort study assessing patient characteristics and the incidence of cardiovascular disease using linked routine primary and secondary care data. BMJ Open. 2012;2(2):e000723. | ||
Merry AHH, Boer JMA, Schouten LJ, et al. Validity of coronary heart diseases and heart failure based on hospital discharge and mortality data in the Netherlands using the cardiovascular registry Maastricht cohort study. Eur J Epidemiol. 2009;24:237–247. | ||
Pajunen P, Koukkunen H, Ketonen M, et al. The validity of the Finnish Hospital Discharge Register and Causes of Death Register data on coronary heart disease. Eur J Cardiovasc Prev Rehabil. 2005;12(2):132–137. | ||
Beaglehole R, Stewart A, Walker P. Validation of coronary heart disease hospital discharge data. Aust N Z J Med. 1987;17:43–46. | ||
Wells L, Riddell T, Kerr A, et al. Cohort profile: the PREDICT cardiovascular disease cohort in New Zealand primary care (PREDICT-CVD 19). Int J Epidemiol. 2017;46(1):22. | ||
Selak V, Gu Y, Rafter N, Crengle S, Kerr A, Bullen C. Dispensing data captures individual-level use of aspirin for cardiovascular disease prevention, despite availability over-the-counter. N Z Med J. 2016; 129(1435):21–28. | ||
Hippisley-Cox J, Coupland C, Vinogradova Y, et al. Predicting cardiovascular risk in England and Wales: prospective derivation and validation of QRISK2. Br Med J. 2008;336(7659):1475–1482. | ||
Mainous A, Koopman R, Diaz VA, et al. A coronary heart disease risk score based on patient-reported information. Am J Cardiol. 2007; 99:1236–1241. | ||
Goff D, Lloyd-Jones DM, Bennett G, et al. 2013 ACC/AHA guideline on the assessment of cardiovascular risk: a report of the American College of Cardiology/American Heart Association Task Force on Practice Guidelines. Circulation. 2014;129:S49–S73. | ||
Ridker P, Buring J, Rifai N, Cook NR. Development and validation of improved algorithms for the assessment of global cardiovascular risk in women: the Reynolds risk score. JAMA. 2007;297:611–619. | ||
Ridker P, Paynter N, Rifai N, Gaziano JM, Cook NR. C-reactive protein and parental history improve global cardiovascular risk prediction: the Reynolds risk score for men. Circulation. 2008;118:2243–2251. | ||
Heart Protection Study Collaborative Group. MRC/BHF heart protection study of cholesterol lowering with simvastatin in 20,536 high-risk individuals: a randomised placebo-controlled trial. Lancet. 2002;360:7–22. | ||
Mehta S, Wells S, Grey C, et al. Initiation and maintenance of cardiovascular medications following cardiovascular risk assessment in a large primary care cohort: PREDICT CVD-16. Eur J Prev Cardiol. 2014;21(2):192–202. | ||
Vinogradova Y, Coupland C, Brindle P, Hippisley-Cox J. Discontinuation and restarting in patients on statin treatment: prospective open cohort study using a primary care database. BMJ. 2016;353:i3305. | ||
Simons LA, Levis G, Simons J. Apparent discontinuation rates in patients prescribed lipid-lowering drugs. Med J Aust. 1996;164(4):208–211. | ||
Chapman RH, Benner JS, Petrilla AA, et al. Predictors of adherence with antihypertensive and lipid-lowering therapy. Arch Intern Med. 2005;165:1147–1152. | ||
Benner JS, Glynn RJ, Mogun H, Neumann PJ, Weinstein MC, Avorn J. Long-term persistence in statin therapy in the elderly. JAMA. 2002;288:455–461. | ||
Andrade SE, Kahler KH, Frech F, Chan KA. Methods for evaluation of medication adherence and persistence using automated databases. Pharmacoepidemiol Drug Saf. 2006;15:565–574. | ||
Liu K, Colangelo LA, Daviglus ML, et al. Can antihypertensive treatment restore the risk of cardiovascular disease to ideal levels? The Coronary Artery Development in Young Adults (CARDIA) study and the Multi-Ethnic Study of Atherosclerosis (MESA). J Am Heart Assoc. 2015;4(9):e002275. |
 © 2018 The Author(s). This work is published and licensed by Dove Medical Press Limited. The
full terms of this license are available at https://www.dovepress.com/terms
and incorporate the Creative Commons Attribution
- Non Commercial (unported, 3.0) License.
By accessing the work you hereby accept the Terms. Non-commercial uses of the work are permitted
without any further permission from Dove Medical Press Limited, provided the work is properly
attributed. For permission for commercial use of this work, please see paragraphs 4.2 and 5 of our Terms.
© 2018 The Author(s). This work is published and licensed by Dove Medical Press Limited. The
full terms of this license are available at https://www.dovepress.com/terms
and incorporate the Creative Commons Attribution
- Non Commercial (unported, 3.0) License.
By accessing the work you hereby accept the Terms. Non-commercial uses of the work are permitted
without any further permission from Dove Medical Press Limited, provided the work is properly
attributed. For permission for commercial use of this work, please see paragraphs 4.2 and 5 of our Terms.