Back to Journals » Drug Design, Development and Therapy » Volume 11
Cardiovascular, liver, and renal toxicity associated with an intravenous ferric carboxymaltose similar versus the originator compound
Authors Toblli JE, Cao G, Rico L ![]() , Angerosa M
, Angerosa M
Received 8 September 2017
Accepted for publication 25 October 2017
Published 30 November 2017 Volume 2017:11 Pages 3401—3412
DOI https://doi.org/10.2147/DDDT.S151162
Checked for plagiarism Yes
Review by Single anonymous peer review
Peer reviewer comments 2
Editor who approved publication: Dr Tuo Deng
Jorge E Toblli, Gabriel Cao, Luis Rico, Margarita Angerosa
Laboratory of Experimental Medicine, Hospital Alemán, School of Medicine, University of Buenos Aires, Buenos Aires, Argentina
Background: Ferric carboxymaltose (FCM) is a stable, non-dextran-based intravenous iron complex used to treat iron deficiency of various etiologies. As FCM is a nonbiological complex drug and cannot be fully characterized by physicochemical analyses, it is important to demonstrate in nonclinical models that FCM similars (FCMS) have similar biodistribution.
Materials and methods: A total of 30 nonanemic rats were treated weekly with 40 mg iron/kg body weight intravenous FCM, FCMS, or isotonic saline (controls) for 4 weeks. Blood pressure, liver enzymes, and renal function were evaluated. In liver, heart, and kidney tissue, markers for oxidative stress (malondialdehyde to assess lipid peroxidation and antioxidant enzymes) and inflammation (TNFα and IL6) were measured. Iron deposits were localized.
Results: The FCMS-treated group had significantly lower blood pressure, higher liver enzymes, increased proteinuria, and reduced creatinine clearance versus the FCM and control groups by day 29. Serum iron and transferrin saturation were significantly higher with FCMS versus FCM or controls. Iron deposition was altered in FCMS-treated animals, with decreased ferritin deposits and iron deposition outside the physiological storage compartments. Markers for lipid peroxidation and antioxidant-enzyme activity were significantly increased after FCMS administration versus FCM and controls, as were inflammatory markers.
Conclusion: Results from this blinded nonclinical study demonstrated significant differences between the originator FCM and this FCMS.
Keywords: ferric carboxymaltose, Ferinject, Orofer, follow-ons, nonbiological complex drugs, oxidative stress
Introduction
Iron deficiency is a common health-related condition in which iron availability is insufficient to meet the body’s needs. It occurs when dietary iron intake is insufficient, when iron absorption or metabolism is disrupted, or when there is excess blood loss. In many cases, oral iron therapy is prescribed, since it is convenient and inexpensive, but absorption of iron from oral preparations can be low, while the high pill burden and frequent gastrointestinal adverse events can limit adherence.1,2 Intravenous (IV) iron therapy replenishes iron stores more rapidly, and is generally associated with fewer side effects and improved tolerability than oral iron therapy.3–7
IV iron complexes vary widely in their physicochemical properties and pharmacokinetic parameters, which are largely influenced by the structure of the polynuclear iron core and the chemical composition of the carbohydrate ligand.8,9 IV iron complexes belong to the class of nonbiological complex drugs (NBCDs), for which the physicochemical and pharmacological properties are strongly dependent on their manufacturing process.10 Regulatory pathways are in place for the authorization of small-molecule follow-ons, which receive marketing authorization once therapeutic equivalence has been established on the basis of pharmaceutical equivalence and bioequivalence. However, demonstrating pharmaceutical equivalence and bioequivalence for follow-on versions of NBCDs remains challenging, since the critical quality attributes that ensure efficacy and safety in humans have not yet been established.11 Therefore, for these IV iron complexes, referred to as “IV iron-based nanocolloidal products”, the European Medicines Agency has stated that quality, nonclinical, and human pharmacokinetic studies are required to show equivalence of follow-on products (or better “similars”).12 A particular emphasis in terms of pharmacokinetics should be placed on distribution, accumulation, and retention in plasma, the reticuloendothelial system (RES), and target tissues/organs.12 The US Food and Drugs Administration (FDA) has issued draft guidance asking for a stepwise approach, comparable to requirements for biosimilars.13–16 Moreover, IV iron products are listed by the FDA as products that might not be eligible for generic approval, because of potential legal, regulatory, or scientific issues. These issues should be addressed with the agency prior to submission of an abbreviated new drug application.17
Ferric carboxymaltose (FCM) is a stable, non-dextran-based IV iron complex containing a minimal amount of labile iron.18,19 Its physicochemical properties allow for administration of a single high dose (up to 1,000 mg iron in Europe) over 15 minutes, facilitating rapid iron repletion in patients with severe iron deficiency.20 Randomized clinical trials have confirmed the efficacy of FCM for improving iron status and hemoglobin (Hb) levels in a variety of clinical settings.21 The aim of the current study was to evaluate potential differences in cardiovascular, liver, and renal toxicity between FCM and the Indian FCM similar (FCMS) product Orofer, and in particular to compare patterns of iron deposition, oxidative stress, and inflammatory response. The nonanemic rat model used in this study has previously been widely used to detect differences between the originator IV iron-complex iron sucrose and iron sucrose similars.22–25
Materials and methods
Molecular weight distribution
Molecular weight distribution was measured by gel-permeation chromatography8 by the quality-control laboratory of Vifor International (Bern, Switzerland).
Elemental impurities
Elemental impurities (ICH Q3D guideline)26 were measured by the analytical development laboratory of Vifor with high-resolution inductively coupled plasma mass spectrometry (Element 2; Thermo Fisher Scientific, Waltham, MA, USA). The samples were measured with an external calibration approach against calibration solutions (different standard-solution mixes; Inorganic Ventures, Christiansburg, VA, USA) prepared in the same diluent as the samples (1.7% HNO3 and 3% HCl).
Study design and treatment
A total of 30 Sprague Dawley rats aged 2 months and weighing 220–250 g were randomized into one of three groups, each comprising ten animals: FCM (Ferinject; Vifor), FCMS (Orofer; Emcure Pharmaceuticals, Pune, India); and a control group (isotonic saline solution). Investigators were blinded to treatments. There were equal proportions of male and female animals in each group. Rats were housed in a temperature-controlled room (mean 22°C±2°C) with free access to tap water and fed standard rat chow (Cooperación, Buenos Aires, Argentina) ad libitum throughout the study. Food intake was recorded.
During the 4-week study, animals in the FCM and FCMS groups received a total of five weekly IV doses (on days 0, 7, 14, 21, and 28) by tail-vein injection. Each dose contained 40 mg iron/kg body weight as FCM or FCMS diluted in saline. The dose was adjusted on each occasion according to the animal’s body weight. Both compounds were provided by Vifor. The control group received an equivalent volume of isotonic saline solution (0.5–1 mL).
On day 29 (24 hours after the final IV administration), blood samples were obtained for biochemical analysis and the animals were sacrificed by subtotal exsanguination under anesthesia (intraperitoneal sodium thiopental 40 mg/kg), according to institutional guidelines for animal care and use. Liver, heart, and kidneys were perfused with ice-cold saline through the abdominal aorta until they were free of blood, and removed for evaluation of oxidative stress markers, microscopy, and immunohistochemical examination.
Blood-pressure measurement
At baseline (day 0) and 24 hours after each IV administration, systolic and diastolic blood pressure were measured by noninvasive tail-cuff plethysmography using volume-pressure recording (Coda 2; Kent Scientific, Torrington, CT, USA), on unanesthetized rats restrained in a thermal plastic chamber. A minimum of three measurements were made on each occasion and mean values calculated.
Biochemical procedures
At 24 hours after the first, second, and fifth IV iron administration (ie, on days 1, 8, and 29), blood samples were collected from the tail vein in capillary tubes following 14 hours’ fasting. Hb levels were determined with a Sysmex XT-1800i (Hoffman-La Roche, Basel, Switzerland). Levels of serum iron and liver enzymes (AST, ALT, and ALP) were measured by colorimetric and ultraviolet methods, respectively, using a Modular P800 autoanalyzer (Hoffman-La Roche) with the corresponding reagents (Hoffman-La Roche). Aliquots of sera and urine were assayed for creatinine with the enzymatic ultraviolet method (Randox Laboratories, Crumlin, UK). Creatinine clearance was calculated as urine volume × urine creatinine/serum creatinine. Proteinuria was determined by the sulfosalicylic acid method. Transferrin saturation (TSAT) was calculated as serum iron concentration (μg/L)/total iron-binding capacity (μg/L) ×100.27,28
Oxidative stress evaluation
A fraction of whole liver, heart, and kidney from each animal was homogenized (1:3 w:v) in ice-cold 0.25 M sucrose. Glutathione (GSH) levels were determined in 10,000 g supernatant following methods as previously described,29,30 and the ratio of GSH to oxidized GSH (GSSG) was calculated. Another fraction of each organ was homogenized (1:10 w:v) in 0.05 M sodium phosphate buffer (pH 7.4) and used for the determination of malondialdehyde (MDA), in order to evaluate lipoperoxidation by thiobarbituric reactive species, or was centrifuged for 15 minutes at 9,500× g at 4°C. The resulting supernatant was used to measure catalase activity. Finally, another fraction of each organ was homogenized (1:3 w:v) in ice-cold sucrose (0.25 M). The supernatant obtained after centrifugation at 105,000× g for 90 minutes was used to measure CuZn SOD and GSH peroxidase (GPx) activity.31–33 Enzyme units were defined as the amount of enzymes producing 1 nmol of product or consuming 1 nmol of substrate (catalase) under standard incubation conditions. Specific activity was expressed as U/mg protein. One unit of CuZn SOD was defined as the amount of CuZn SOD capable of inhibiting the rate of NADH oxidation measured in the control by 50%.
Light microscopy
Portions of liver, heart, and kidney tissue were cut and fixed in phosphate-buffered 10% formaldehyde (pH 7.2) and embedded in paraffin. Sections (3 μm) were cut and processed for immunohistochemical study. All observations were performed using light microscopy (E400; Nikon Instruments, Melville, NY, USA).
Immunohistochemistry
Immunolabeling of specimens was carried out with a modified avidin–biotin–peroxidase complex technique using a Vectastain ABC kit (Universal Elite; Vector Laboratories, Burlingame, CA, USA). Following deparaffinization and rehydration, sections were washed in PBS for 5 minutes. Quenching of endogenous peroxidase activity was achieved by incubating the sections for 30 minutes in 1% hydrogen peroxide in methanol. After being washed in PBS (pH 7.2) for 20 minutes, they were incubated with blocking serum for 20 minutes. The sections were then incubated with the primary antibody, rinsed in PBS, and incubated with biotinylated universal antibody for 30 minutes. After being washed in PBS, the specimens were incubated for 40 minutes with Vectastain Elite ABC reagent (Vector Laboratories) and exposed for 5 minutes to 0.1% diaminobenzidine (Polysciences, Warrington, PA, USA) and 0.2% hydrogen peroxide in 50 mM Tris buffer, pH 8. Tissue ferritin was quantified using a rabbit polyclonal antiferritin light-chain antibody (ab69090; Abcam, Cambridge, UK). Antibody against rat TNFα (antibody x107 13021; R&D Systems, Minneapolis, MN, USA) was used at a dilution of 1:50, and antibody against IL6 (L1611; Santa Cruz Biotechnology, Dallas, TX, USA) was used at a dilution of 1:100. Immunostaining was visualized on the Nikon E400, and images were captured with a digital camera and processed.
Morphometry
Histological sections were studied in each animal with an image analyzer (Image-Pro Plus 4.5 for Windows; Media Cybernetics, Silver Spring, MD, USA). Morphological analyses were performed at a magnification of 100× or 400×, depending on the tissue. In all cases, two independent observers performed a blinded evaluation, and the mean percentage value was then calculated. Immunolocalization was calculated by computer for liver, heart, and kidney tissue in each rat using the image analyzer and expressed as percentage of the area (per mm2) with positive staining for iron deposits based on Prussian blue staining, intracellular light-chain ferritin, TNFα, and IL6.
Statistical analysis
For parameters with Gaussian distribution (ie, all nonhistological data), between-group comparisons were carried out using analysis of variance (ANOVA). For parameters with non-Gaussian distribution (ie, histological data), comparisons were performed by the Kruskal–Wallis test (nonparametric ANOVA) and Dunn’s multiple-comparison test. Values are expressed as mean and SDs. P<0.05 was considered significant. All statistical analyses were performed using GraphPad Prism (version 6.02 for Windows; GraphPad Software, San Diego, CA, USA).
Study conduct
All experiments were approved by the ethics committee and the teaching and research committee of Hospital Alemán, and were conducted according to the National Institutes for Health Guide for the Care and Use of Laboratory Animals.
Results
Molecular weight distribution of FCMS
Weight-average molecular weight, number-average molecular weight, and polydispersity of the FCMS lot used (BVB15008) were 131 kDa, 99.6 kDa, and 1.3, respectively.
Elemental impurities
The quantity of 26 elements in the FCMS was measured, including 24 specified in the ICH Q3D guideline26 plus aluminum and manganese. The amount of most elements was within the limits recommended by the guideline (data not shown). However, as shown in Table 1, three elements in the guideline (vanadium, cobalt, and nickel), as well as aluminum and manganese, were present in amounts significantly higher than recommended. Routine analysis was performed for the same 26 elements in FCM, and the data were consistently within the limits of the ICH Q3D guideline.
 | Table 1 Quantity of elements in ferric carboxymaltose similars exceeding recommended levels |
Body weight
Mean body weight at day 29 was significantly lower in rats treated with FCMS than in the FCM or control groups (Tables 2 and S1). This was consistent with the significantly lower food intake recorded in the FCMS group (mean [SD] at day 29, FCMS, 30 [2] g/day, FCM 34 [2] g/day, controls 36 [2] g/day; P<0.01 for FCMS versus FCM and versus controls).
 | Table 2 Body weight, Hb, and blood iron parameters |
Blood pressure
Blood pressure was similar in all three groups at baseline. By day 1, however, mean systolic and diastolic blood pressure were both significantly lower in the FCMS group versus the FCM group and controls, a difference that persisted throughout the study (Figure 1). At day 29, mean blood pressure was 111/66 mmHg in the FCMS group compared to 123/72 mmHg in the FCM group (P<0.01 versus FCMS) and 122/72 mmHg in the control group (P<0.01 versus FCMS). Animals in the FCM and control groups had similar blood pressure throughout the study (Figure 1).
 | Figure 1 (A) Systolic blood pressure and (B) diastolic blood pressure over a 4-week period. |
Liver and kidney function
Mean AST, ALT, and ALP levels were all substantially and significantly higher in the FCMS group versus both the FCM and control groups (Table 3). A significant difference was observed as early as day 1, and did not diminish over time (Table S2). Levels of all three liver enzymes were similar in the FCM and control groups throughout the study (Tables 3 and S2).
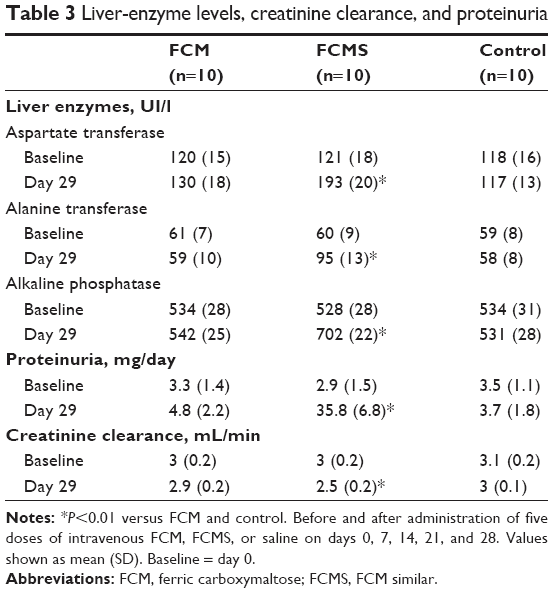 | Table 3 Liver-enzyme levels, creatinine clearance, and proteinuria |
Animals in the FCMS group exhibited a striking increase in proteinuria by day 1, when mean (SD) proteinuria was 25.7 (7.4) mg/day compared to 4.0 (0.8) mg/day with FCM and 3.4 (0.9 mg/day) in the control group (both P<0.01 versus FCMS). This profound proteinuria continued in FCMS-treated animals until day 29 (Figure 2). In contrast, proteinuria remained stable in the FCM and control groups throughout the study, with no significant between-group differences (Figure 2, Table S2).
 | Figure 2 (A) Proteinuria and (B) creatinine clearance over a 4-week period. |
Creatinine clearance declined gradually in the FCMS group, with the difference compared to the FCM and control groups becoming significant on day 22 and day 29 (both P<0.01; Figure 2, Table S2). At day 29, mean (SD) creatinine clearance was 2.5 (0.2) mL/min in the FCMS group versus 2.9 (0.2) mL/min with FCM and 3 (0.1) mL/min in control animals (both P<0.01 versus FCMS; Figure 2).
Hemoglobin and iron parameters
In these nonanemic animals, mean Hb remained unchanged throughout the study in the groups treated with FCM and FCMS, as well as in the control group (Table 2). Mean levels of serum iron in both the IV iron groups increased significantly versus the control group, a difference that was apparent from day 1 onward (Table S1). However, the increase was significantly greater in animals treated with FCMS versus FCM at all postbaseline time points (P<0.01 on days 1, 8, and 29). At day 29, mean (SD) serum iron was 583 (36) μg/dL in the FCMS group, 428 (19) μg/dL in the FCM group (P<0.01 versus FCMS), and 305 (22) μg/dL in the control group (P<0.01 versus both FCM and FCMS; Table 2). Consistent with these observations, TSAT was significantly higher in both the FCM and FCMS groups versus controls from day 1 onward, but was significantly higher in the FCMS group versus FCM-treated animals at all postbaseline time points (Tables 2 and S1).
Iron deposition
After the animals were sacrificed on day 29, the area of iron deposits in liver tissue, as indicated by staining for Prussian blue, was significantly higher in the FCM and FCMS groups than in controls (both P<0.01). Iron deposits in the liver were significantly less extensive in the FCM group than in FCMS-treated animals (P<0.01), and in the FCM group deposits were detected exclusively in RES macrophages (Kupffer cells, Figure 3A). In contrast, animals in the FCMS group showed positive staining for iron in hepatocytes, as well as in Kupffer cells (Figure 3A). Ferritin immunostaining in liver tissue was significantly higher in the FCM group versus both FCMS-treated animals and controls (both P<0.01; Figure 3B).
 | Figure 3 (A) Prussian blue staining and (B) ferritin immunostaining for iron deposits in liver, heart, and kidney tissue on day 29. |
In heart tissue, the FCMS group showed a substantially larger area with positive staining for iron deposits (Prussian blue) compared to the FCM and control groups (both P<0.01 versus FCMS). There was no significant difference in iron deposits between the FCM and control groups (Figure 3A). Both IV iron groups exhibited more extensive immunostaining for ferritin in heart tissues versus control animals, but the increase was more pronounced in the FCM group (P<0.01 versus FCMS; Figure 3B). A similar pattern was observed in kidney tissue: positive staining for iron (Prussian blue) was substantially higher with FCMS than with FCM or in the control group (both P<0.01), while ferritin immunostaining was much more extensive in FCM-treated animals than in the FCMS and control groups (both P<0.01; Figure 3B). In the kidneys, iron deposits in FCMS-treated animals were predominantly found in the cortex and proximal tubular epithelial cells (Figure 3B).
Oxidative stress markers
Levels of MDA, as a marker for lipid peroxidation by thiobarbituric reactive species, were significantly increased in liver, heart, and kidney tissue from animals treated with FCMS versus FCM or controls (all P<0.01; Table 4). MDA levels were similar in the FCM and control groups in all three organs (Table 4). The antioxidant enzymes GPx, catalase, and CuZn SOD were also significantly increased, with a corresponding reduction in GSH:GSSG ratio, in liver, heart, and kidney tissue from FCMS-treated animals compared to either FCM-treated animals or controls (all P<0.01; Table 4). Levels of antioxidant enzymes did not differ significantly in any organ between the FCM and control groups.
 | Table 4 Oxidative stress parameters in liver, heart and kidney tissue at day 29 |
Proinflammatory markers
TNFα levels were increased in the FCMS group versus the FCM and control groups in liver, heart, and kidney tissue (all P<0.01; Figure 4A). A significant difference between the FCM group and the control group was seen only in heart tissue, and the increase versus control was far smaller than for FCMS-treated animals. In the liver, animals in the FCMS group principally expressed TNFα in the Kupffer cells, with lower expression in hepatocytes. In hearts, FCMS-treated animals expressed TNFα in cardiomyocytes, while in the kidneys TNFα was predominantly expressed in the cytoplasm of tubular epithelial cells (proximal and distal tubules, and loop of Henle) and to a lesser extent in mesangial cells and podocytes (Figure 4A).
 | Figure 4 (A) TNFα immunostaining and (B) IL6 immunostaining in liver, heart, and kidney tissue on day 29. |
Similarly, IL6 expression was significantly higher in liver, heart, and kidney tissue in the FCMS group versus both the FCM and control groups (all P<0.01). In liver and heart (but not kidney) tissue, IL6 was significantly higher in FCM-treated animals than in controls, but to a lesser extent than the FCMS group (Figure 4B). In animals from the FCMS group, IL6 in the liver was primarily localized in hepatocytes, with a lower proportion in Kupffer cells (Figure 4B). In hearts from FCMS-treated animals, IL6 was found predominantly in cardiomyocytes, while in the kidneys IL6 was present in tubular epithelial cells (mainly proximal tubular cells), mesangial cells, and podocytes (Figure 4B).
Discussion
The originator FCM (Ferinject) is a stable, non-dextran-based IV iron complex.20 Previously, studies using our rat model have shown FCM to have a favorable safety profile in terms of hemodynamics, liver and kidney function, levels of oxidative and nitrosative stress, and inflammatory responses, with appropriate deposition of iron in the RES cells of the liver.24,35,36 Recently, the FCMS product Orofer has become commercially available in India, but comparative studies versus FCM are lacking. Results from this blinded nonclinical model demonstrated significant differences between the originator FCM and this FCMS in terms of blood pressure, kidney and liver function, pattern of iron distribution, storage in the examined tissues, and markers for oxidative stress and inflammation.
The molecular weight distribution of the tested FCMS was similar to another FCMS (Encicarb) produced by the same manufacturer, based on data we published previously using the same methodology.37 It was slightly lower, however, than for the original FCM.37 In that analysis, the average molecular weight, number-average molecular weight, and polydispersity for two original FCM lots were 157/141 kDa, 94.7/89.5 kDa, and 1.66/1.57, respectively, compared to 131 kDa, 99.6 kDa, and 1.3 for the FCMS tested here. The potential clinical significance of the finding that elemental impurities were higher than recommended in the FCMS, and the possible increase in risk for oxidative stress, cannot be assessed here, but merits investigation.
We and others have previously shown in nonclinical studies that iron sucrose-similar preparations are associated with more oxidative stress and inflammation, coupled with renal and hepatic damage, compared to the originator iron sucrose (Venofer).22,23,25,38 Consistent with this, the literature contains reports of adverse events39,40 and diminished efficacy41 after switching from the originator iron sucrose to an iron sucrose similar.
In the current study, both the FCM and FCMS groups showed increased levels of serum iron and TSAT versus controls, as would be expected. However, both parameters were significantly higher in the FCMS group, indicating less controlled release of iron upon FCMS administration. This is compatible with the observed pattern of ferritin deposits (ie, iron storage), which were far higher in the FCM group than with FCMS, indicating appropriate deposition in the RES (Kupffer) cells, where oxidative damage is less likely.42 Iron deposits visualized with Prussian blue staining were also restricted to RES cells in the FCM group. A different picture emerged for FCMS, where despite the same dose of IV iron, far less deposition of storage iron (ferritin) was observed, and ferritin was detected in non-RES hepatocytes within the liver. Iron deposits (Prussian blue), furthermore, were more extensive in FCMS-treated animals, including unphysiological deposits within liver parenchymal cells and sinusoidal epithelial cells. These observations suggest that the distribution and storage of iron after release from FCMS might not follow the same pathways as iron from FCM.
Evidence for an increased level of oxidative stress with FCMS compared to either FCM or controls was remarkably consistent across all markers. In contrast, no marker was elevated in the FCM group compared to controls. Lipid peroxidation, as indicated by levels of MDA, was significantly higher in the FCMS group versus both FCM and controls in all three organs examined. A study performed in renal tissue homogenates has previously shown that more stable IV iron products induce less lipid peroxidatic damage, based on measurements of MDA.43 In our model, antioxidant-enzyme activity (CuZn SOD, catalase, and GPx) were also significantly higher in the FCMS group across all three organs, while the reduced ratio of GSH:GSSG pointed to a higher consumption of antioxidants. Our previous comparative analyses have demonstrated increased levels of oxidative stress markers in rats treated with less stable IV iron compounds.24,35,44 Oxidative stress promotes an inflammatory response, and here the inflammatory markers TNFα and IL6 were significantly higher with FCMS than in the FCM group and controls in all organs tested, and expression was detected in various non-RES cells.
The changes in blood pressure and kidney and liver function in the FCMS group may indicate that FCMS contains larger amounts of labile iron. Marked hypotension was seen in the FCMS group compared to controls and FCM-treated animals. Hypotension is a recognized adverse event associated with IV iron therapy,6 but is restricted to rapid infusions or high doses of less stable IV preparations.45 The observed increase in liver-enzyme activity suggests hepatic injury, compatible with excess levels of ROS, which are known to induce inflammation, necrosis, apoptosis, and other pathological changes in hepatocytes, Kupffer cells, stellate cells, and endothelial cells in the liver.46 In rats, elevated AST levels have been demonstrated to occur only with relatively advanced liver necrosis.47 For the kidneys, increased proteinuria in the FCMS group suggested disruption of normal podocyte and epithelial cell function, with progression to impaired renal output (ie, reduced creatinine clearance) later in the study. The kidney filters substantial amounts of iron, with high levels of iron transporters and receptors in the nephrons, and thus has a propensity toward iron toxicity.48 Iron overload in rats has been shown to cause iron deposition in the kidneys with subsequent damage to the proximal tubular epithelial cells,49 and increased levels of oxidative stress markers have been associated with development of lipid-induced glomerulosclerosis in rats.50 Consistent with this evidence of organ damage, the FCMS-treated animals gained less weight, as shown elsewhere in a rat model of colloidal iron overload.49
Findings from this preclinical study cannot necessarily be extrapolated to the clinical setting. We also recognize that this model, which aimed to assess the toxicity of the FCMS compared to the originator FCM, is based on iron-replete animals, whereas IV iron therapy is given exclusively to iron-deficient individuals. The study dose of 40 mg iron/kg body weight was higher than that used clinically (maximum 15-20 mg iron/kg body weight),51 and the study duration was 4 weeks, which may not have captured longer-term adverse effects. However, this model proved suitable to detect differences between the original iron sucrose complex and follow-on products (so-called iron sucrose similars), which had very similar physicochemical properties. In the absence of any published clinical data on FCMS products, it is relevant to examine the potential toxic effects of these complex preparations, and our results demonstrate the need for careful testing before their wider adoption for the management of iron deficiency.
In conclusion, these findings from a rat model indicate that FCMS (Orofer) differs significantly from the originator FCM, incurring liver, heart, and renal toxicity, with adverse effects on blood pressure and liver and kidney function. These effects appear to arise from inappropriate deposition of iron consistent with less controlled iron release and saturation of the physiological pathways for iron transport and storage, leading to increased oxidative stress and inflammation. Deposition in the wrong cellular compartments also means that iron may not be completely available for incorporation into iron-containing enzymes and proteins. These observations are consistent with those of a previous study we have undertaken, in which another FCMS (Encicarb) adversely affected iron deposition and markers of oxidative stress and inflammation, with impaired liver and kidney function, compared to iron sucrose.37 Although these preclinical findings cannot be extrapolated directly to the clinical setting, these deleterious effects raise concerns. Such NBCDs as FCMS preparations cannot be fully characterized by physicochemical analysis alone, and consistent, tightly controlled manufacturing is fundamental for reproducibility.51 The regulatory framework for ensuring equivalence of NBCDs, while still in development,11 has highlighted the need for quality analyses and both nonclinical and human pharmacokinetic studies.12 The evidence for differences in iron metabolism and iron-related toxicity seen in the current model underscores the need for further studies before this FCMS could be considered bioequivalent to the originator FCM.
Acknowledgment
Vifor International Ltd funded the study and medical writing support for this manuscript.
Disclosure
JET has received research grants and consultancy fees from Vifor International. The authors report no other conflicts of interest in this work.
References
Lewis GD, Malhotra R, Hernandez AF, et al. Effect of oral iron repletion on exercise capacity in patients with heart failure with reduced ejection fraction and iron deficiency: the IRONOUT HF randomized clinical trial. JAMA. 2017;317(19):1958–1966. | ||
Martin ER, Smith MT, Maroni BJ, Zuraw QC, de Goma EM. Clinical trial of vadadustat in patients with anemia secondary to stage 3 or 4 chronic kidney disease. Am J Nephrol. 2017;45(5):380–388. | ||
Avni T, Bieber A, Grossman A, Green H, Leibovici L, Gafter-Gvili A. The safety of intravenous iron preparations: systematic review and meta-analysis. Mayo Clin Proc. 2015;90(1):12–23. | ||
Bonovas S, Fiorino G, Allocca M, et al. Intravenous versus oral iron for the treatment of anemia in inflammatory bowel disease: a systematic review and meta-analysis of randomized controlled trials. Medicine (Baltimore). 2016;95(2):e2308. | ||
McDonagh T, Macdougall IC. Iron therapy for the treatment of iron deficiency in chronic heart failure: intravenous or oral? Eur J Heart Fail. 2015;17(3):248–262. | ||
Shepshelovich D, Rozen-Zvi B, Avni T, Gafter U, Gafter-Gvili A. Intravenous versus oral iron supplementation for the treatment of anemia in CKD: an updated systematic review and meta-analysis. Am J Kidney Dis. 2016;68(5):677–690. | ||
Shi Q, Leng W, Wazir R, et al. Intravenous iron sucrose versus oral iron in the treatment of pregnancy with iron deficiency anaemia: a systematic review. Gynecol Obstet Invest. 2015;80(3):170–178. | ||
Geisser P, Baer M, Schaub E. Structure/histotoxicity relationship of parenteral iron preparations. Arzneimittelforschung. 1992;42(12):1439–1452. | ||
Neiser S, Rentsch D, Dippon U, et al. Physico-chemical properties of the new generation IV iron preparations ferumoxytol, iron isomaltoside 1000 and ferric carboxymaltose. Biometals. 2015;28(4):615–635. | ||
Crommelin DJ, de Vlieger JS, Weinstein V, Mühlebach S, Shah VP, Schellekens H. Different pharmaceutical products need similar terminology. AAPS J. 2014;16(1):11–14. | ||
Hussaarts L, Mühlebach S, Shah VP, et al. Equivalence of complex drug products: advances in and challenges for current regulatory frameworks. Ann N Y Acad Sci. Epub 2017 Apr 26. | ||
European Medicines Agency. Reflection paper on the data requirements for intravenous iron-based nano-colloidal products developed with reference to an innovator medicinal product. 2015. Available from: http://www.ema.europa.eu/docs/en_GB/document_library/Scientific_guideline/2015/03/WC500184922.pdf. Accessed July 5, 2017. | ||
US Food and Drug Administration, 2012. Draft guidance on ferumoxytol. 2012. Available from: https://www.fda.gov/downloads/drugs/guidancecomplianceregulatoryinformation/guidances/UCM333051.pdf. Accessed July 5, 2017. | ||
US Food and Drug Administration. Draft guidance on iron sucrose. 2013. Available from: https://www.fda.gov/downloads/drugs/guidancecomplianceregulatoryinformation/guidances/UCM297630.pdf. Accessed July 5, 2017. | ||
US Food and Drug Administration. Draft guidance on ferric carboxymaltose. 2016. Available from: https://www.fda.gov/downloads/drugs/guidancecomplianceregulatoryinformation/guidances/UCM495022.pdf. Accessed July 5, 2017. | ||
US Food and Drug Administration. Draft guidance on iron dextran. 2016. Available from: https://www.fda.gov/downloads/drugs/guidancecomplianceregulatoryinformation/guidances/UCM520240.pdf. Accessed July 5, 2017. | ||
US Food and Drug Administration. FDA tackles drug competition to improve patient access. 2017. Available from: https://www.fda.gov/newsevents/newsroom/pressannouncements/ucm564725.htm. Accessed July 5, 2017. | ||
Funk F, Ryle C, Canclini C, Neiser S, Geisser P. The new generation of intravenous iron: chemistry, pharmacology, and toxicology of ferric carboxymaltose. Arzneimittelforschung. 2010;60(6A):345–353. | ||
Jahn MR, Andreasen HB, Fütterer S, et al. A comparative study of the physiochemical properties of iron isomaltoside 1000 (Monofer), a new intravenous iron preparation and its clinical implications. Eur J Pharm Biopharm. 2011;78(3):480–491. | ||
Keating GM. Ferric carboxymaltose: a review of its use in iron deficiency. Drugs. 2015;75(1):101–127. | ||
Rognoni C, Venturini S, Meregaglia M, Marmifero M, Tarricone R. Efficacy and safety of ferric carboxymaltose and other formulations in iron-deficient patients: a systematic review and network meta-analysis of randomised controlled trials. Clin Drug Invest. 2016;36(3):177–194. | ||
Toblli JE, Cao G, Oliveri L, Angerosa M. Differences between original intravenous iron sucrose and iron sucrose similar preparations. Arzneimittelforschung. 2009;59(4):176–190. | ||
Toblli JE, Cao G, Oliveri L, Angerosa M. Differences between the original iron sucrose complex Venofer and the iron sucrose similar Generis, and potential implications. Port J Nephrol Hypertens. 2009;23(1):53–63. | ||
Toblli JE, Cao G, Olivieri L, Angerosa M. Comparison of the renal, cardiovascular and hepatic toxicity data of original intravenous iron compounds. Nephrol Dial Transplant. 2010;25(11):3631–3640. | ||
Toblli JE, Cao G, Oliveri L, Angerosa M. Comparison of oxidative stress and inflammation induced by different intravenous iron sucrose similar preparations in a rat model. Inflamm Allergy Drug Targets. 2012;11(1):66–78. | ||
International Conference on Harmonisation of Technical Requirements for Registration of Pharmaceuticals for Human Use. Guideline for elemental impurities: Q3D. 2014. Available from: http://www.ich.org/fileadmin/Public_Web_Site/ICH_Products/Guidelines/Quality/Q3D/Q3D_Step_4.pdf. Accessed July 5, 2017. | ||
Fergelot P, Ropert-Bouchet M, Abgueguen E, et al. Iron overload in mice expressing HFE exclusively in the intestinal villi provides evidence that HFE regulates a functional cross-talk between crypt and villi enterocytes. Blood Cells Mol Dis. 2002;28(3):348–360. | ||
Youn P, Kim S, Ahn JH, Kim Y, Park JD, Ryu DY. Regulation of iron metabolism-related genes in diethylnitrosamine-induced mouse liver tumors. Toxicol Lett. 2009;184(3):151–158. | ||
Akerboom TP, Sies H. Assay of glutathione, glutathione disulfide, and glutathione mixed disulfides in biological samples. Methods Enzymol. 1981;77:373–382. | ||
Rossi R, Cardaioli E, Scaloni A, Amiconi G, Di Simplicio P. Thiol groups in proteins as endogenous reductants to determine glutathione-protein mixed disulphides in biological systems. Biochim Biophys Acta. 1995;1243(2):230–238. | ||
de Cavanagh EM, Inserra F, Toblli J, Stella I, Fraga CG, Ferder L. Enalapril attenuates oxidative stress in diabetic rats. Hypertension. 2001;38(5):1130–1136. | ||
Niehaus WG Jr, Samuelsson B. Formation of malonaldehyde from phospholipid arachidonate during microsomal lipid peroxidation. Eur J Biochem. 1968;6(1):126–130. | ||
Toblli JE, Cao G, Olivieri L, Angerosa M. Comparative study of gastrointestinal tract and liver toxicity of ferrous sulfate, iron amino chelate and iron polymaltose complex in normal rats. Pharmacology. 2008;82(2):127–137. | ||
European Medicines Agency. Guideline on the specification limited for residues of metal catalysts or metal reagents. 2008. Available from: http://www.ema.europa.eu/docs/en_GB/document_library/Scientific_guideline/2009/09/WC500003586.pdf. Accessed July 5, 2017. | ||
Toblli JE, Cao G, Oliveri L, Angerosa M. Assessment of the extent of oxidative stress induced by intravenous ferumoxytol, ferric carboxymaltose, iron sucrose and iron dextran in a nonclinical model. Arzneimittelforschung. 2011;61(7):399–410. | ||
Toblli JE, Cao G, Giani JF, Dominici FP, Angerosa M. Nitrosative stress and apoptosis by intravenous ferumoxytol, iron isomaltoside 1000, iron dextran, iron sucrose, and ferric carboxymaltose in a nonclinical model. Drug Res. 2015;65(7):354–360. | ||
Toblli JE, Cao G, Angerosa M. The induction of oxidative/nitrosative stress, inflammation, and apoptosis by a ferric carboxymaltose copy compared to iron sucrose in a non-clinical model. J Clin Diagn Res. 2015;9(12):FF8–FF12. | ||
Martin-Malo A, Merino A, Carracedo J, et al. Effects of intravenous iron on mononuclear cells during the haemodialysis session. Nephrol Dial Transplant. 2012;27(6):2465–2471. | ||
Lee ES, Park BR, Kim JS, Choi GY, Lee JJ, Lee IS. Comparison of adverse event profile of intravenous iron sucrose and iron sucrose similar in postpartum and gynecologic operative patients. Curr Med Res Opin. 2013;29(2):141–147. | ||
Stein J, Dignass A, Chow KU. Clinical case reports raise doubts about the therapeutic equivalence of an iron sucrose similar preparation compared with iron sucrose originator. Curr Med Res Opin. 2012;28(2):241–243. | ||
Rottembourg J, Kadri A, Leonard E, Dansaert A, Lafuma A. Do two intravenous iron sucrose preparations have the same efficacy? Nephrol Dial Transplant. 2011;26(1):3262–3267. | ||
Muñoz M, Garcia-Erce JA, Remacha AF. Disorders of iron metabolism – part I: molecular basis of iron homeostasis. J Clin Pathol. 2011;64(4):281–286. | ||
Zager RA. Parenteral iron compounds: potent oxidants but mainstays of anemia management in chronic renal disease. Clin J Am Soc Nephrol. 2006;1 Suppl 1:S24–S31. | ||
Toblli JE, Cao G, Oliveri L, Angerosa M. Evaluation of toxicity and oxidative stress induced by intravenous iron isomaltoside 1000 in a nonclinical model. Arzneimittelforschung. 2011;61(1):553–565. | ||
Preusser LC, Fryer RM, Gerhardt A, et al. Effects of intravenous ABT-870 (iron (III)-hydroxide oligosaccharide) on mean arterial pressure and heart rate in the anaesthetized beagle: comparison with other iron-containing haematinic agents. Clin Exp Pharmacol Physiol. 2005;32(12):1020–1026. | ||
Diesen DL, Kuo PC. Nitric oxide and redox regulation in the liver – part II: redox biology in pathologic hepatocytes and implications for intervention. J Surg Res. 2011;167(1):96–112. | ||
Ramaiah SK. A toxicologist guide to the diagnostic interpretation of hepatic biochemical parameters. Food Chem Toxicol. 2007;45(9):1551–1557. | ||
Thévenod F, Wolff NA. Iron transport in the kidney: implications for physiology and cadmium nephrotoxicity. Metallomics. 2016;8(1):17–42. | ||
Kudo H, Suzuki S, Watanabe A, Kikuchi H, Sassa S, Sakamoto S. Effects of colloidal iron overload on renal and hepatic siderosis and the femur in female rats. Toxicology. 2008;246(2–3):143–147. | ||
Ishiyama A, Atarashi K, Minami M, et al. Role of free radicals in the pathogenesis of lipid-induced glomerulosclerosis in rats. Kidney Int. 1999;55(4):1348–1358. | ||
Ferinject [summary of product characteristics]. Bern: Vifor Pharma; 2017. |
Supplementary materials
 | Table S1 Body-weight, Hb, and blood-iron parameters |
 | Table S2 Liver-enzyme levels, creatinine clearance, and proteinuria |
 © 2017 The Author(s). This work is published and licensed by Dove Medical Press Limited. The
full terms of this license are available at https://www.dovepress.com/terms
and incorporate the Creative Commons Attribution
- Non Commercial (unported, 3.0) License.
By accessing the work you hereby accept the Terms. Non-commercial uses of the work are permitted
without any further permission from Dove Medical Press Limited, provided the work is properly
attributed. For permission for commercial use of this work, please see paragraphs 4.2 and 5 of our Terms.
© 2017 The Author(s). This work is published and licensed by Dove Medical Press Limited. The
full terms of this license are available at https://www.dovepress.com/terms
and incorporate the Creative Commons Attribution
- Non Commercial (unported, 3.0) License.
By accessing the work you hereby accept the Terms. Non-commercial uses of the work are permitted
without any further permission from Dove Medical Press Limited, provided the work is properly
attributed. For permission for commercial use of this work, please see paragraphs 4.2 and 5 of our Terms.