Back to Journals » Clinical Epidemiology » Volume 10
Cardiovascular health status among Australian adults
Received 1 November 2017
Accepted for publication 28 December 2017
Published 24 January 2018 Volume 2018:10 Pages 167—178
DOI https://doi.org/10.2147/CLEP.S155783
Checked for plagiarism Yes
Review by Single anonymous peer review
Peer reviewer comments 2
Editor who approved publication: Professor Vera Ehrenstein
Yang Peng, Zhiqiang Wang
Centre for Chronic Disease, Faculty of Medicine, The University of Queensland, Brisbane, QLD, Australia
Background: The American Heart Association (AHA) committee recently set a guideline to define and monitor the cardiovascular health status. This study aimed to estimate cardiovascular health status among Australian adults using the guideline.
Methods: We used data from a nationally representative sample of 7499 adults (age ≥18 years) from 2011 to 2012 Australian Health Survey. We applied the modified AHA’s definition to estimate the ideal proportions of the seven metrics and the overall cardiovascular health status.
Results: Ideal status was most prevalent for fasting plasma glucose (83.6%) and least observed for dietary pattern (4.8%). The estimated percentage of ideal cardiovascular health was 0.15% in Australian adults. An estimated 0.52% of Australian adults had all four ideal cardiovascular health factors, and 16.38% had all four ideal cardiovascular health behaviors. There exist some age and sex variations for the ideal status of individual metric and the overall cardiovascular health.
Conclusion: The percentage of ideal cardiovascular health in Australian adults is extremely low. Public health policies should be implemented to improve the population-wide cardiovascular health status in Australia.
Keywords: cardiovascular health, Australian adults, cross-sectional study, risk factors
Introduction
Although a recent report has indicated the cardiovascular disease (CVD) mortality has declined,1 CVD is still a leading cause of deaths over time.2 In 2013, CVD contributed to >17 million deaths globally, with an age-standardized death rate of 293.2 per 100000.2 Previous studies have identified the substantial role of modifiable factors in CVD prevention. Among 42847 men aged 40–75 years, Chiuve et al3 defined five healthy lifestyle factors, including being a nonsmoker, having a body mass index (BMI) of <25 kg/m2, taking moderate-to-vigorous physical activity for at least 30 min daily, consuming 5–30 g of alcohol daily, and having a healthy diet. After 16 years of follow-up, each of the five factors was associated with substantially lower risk of coronary heart disease incidence. In addition, 62% of coronary events may have been prevented by better adherence to these lifestyle factors.3 In the National Health and Nutrition Examination Survey, participants with untreated blood pressure <120/<80 mmHg and untreated glycated hemoglobin <5.7% had 36% and 29% lower risk of CVD mortality, respectively.4 In this context, the American Heart Association (AHA) has set the following goals for 2020: “by 2020, to improve the cardiovascular health of all Americans by 20% while reducing deaths from CVDs and stroke by 20%”.5 In the meanwhile, the AHA identified seven modifiable metrics, called Life’s Simple 7, to define and monitor cardiovascular health status and prompt the achievement of the 2020 goals. Life’s Simple 7 consisted of BMI, physical activity and dietary pattern as health behaviors, total cholesterol, blood pressure and fasting plasma glucose (FPG) as health factors, and smoking as both a health behavior and a health factor.5 Several recent studies have observed the separate and combined effects of Life’s Simple 7 on the reductions of CVD mortality,4,6 incidence,7 and presence.8 There are also several reports on cardiovascular health status in different populations.9–12
Australians have experienced an enormous burden of CVD in terms of death, hospitalization, and incidence. CVD attributed to 46106 deaths, nearly one-third of the total deaths, among Australians in the year of 2009.13 From 2009 to 2010, there were almost 0.5 million hospitalizations with a principal diagnosis of CVD.13 It has reported that one in five Australians aged 45–74 years had a high risk of CVD event in the subsequent 5 years.14 Another large-scale study based on Australians aged 45 years or older observed that 22% participants have a prior history of CVD.15 Therefore, the national survey data are crucial for understanding the current cardiovascular health status in Australia. In the current study, we used data from a nationally representative survey, 2011–2012 Australian Health Survey (AHS), to evaluate the status of cardiovascular health in Australian adults.
Methods
Study design and subjects
The current study was based on the core sample of the 2011–2012 AHS, which was a nationwide and population-based combined sample of the following three surveys: National Health Survey (NHS), National Nutrition and Physical Activity Survey (NNPAS), and National Health Measures Survey (NHMS). The Australian Bureau of Statistics (ABS) organized the three surveys. NHS and NNPAS used complex, multistage, and probability sampling design to select usual residents from private dwellings in urban and rural areas of all states and territories in Australia, covering ~97% of the people living in Australia. Overseas visitors staying or intending to stay in Australia for ≥12 months were also included. Households in very remote areas of Australia and discrete Aboriginal and Torres Strait Islander Communities were excluded. All participants aged 12 years or older and aged 5 years or older in both NHS and NNPAS were asked to voluntarily provide fasting blood samples and urine samples, which constituted the NHMS. The 2011–2012 AHS core sample combined subjects from NHS and NNPAS and contained variables that co-existed in the two surveys. Biomedical results from NHMS were also included. The core sample consisted of 24910 adults (≥18 years) and the present study restricted those who voluntarily participated in both total cholesterol and FPG tests (n=7499), yielding an overall response rate of 30.1%.
All participants provided written informed consent, and our study was approved by The School of Medicine Low Risk Ethical Review Committee at the University of Queensland (approval number 2016-SOMILRE-0161).
Data collection
Trained interviewers obtained the NHS and NNPAS information through face-to-face computer-assisted personal interview. For the 24 h dietary recall collection, computer-assisted telephone interview was used. Participants provided their biomedical samples to the convenient collection centers, and Sonic Healthcare processed those samples.
Smoking status was based on participants’ self-reported currently, ever, or never smoke. Height and weight were measured during the interview, and BMI was computed as weight in kilograms divided by height in meters squared. ABS staff used a series of questions to obtain the physical activity that the subjects undertook in the last week and calculated the total minutes of moderate and vigorous physical activity. To assess the fruits and vegetables consumption, participants were asked to report the number of vegetables and fruits serves that they usually ate each day. For blood pressure, interviewers undertook two blood pressure readings using an automated blood pressure monitor in which systolic and diastolic pressures were displayed. If the difference between the readings was >10 mmHg, for either the diastolic or the systolic, a third reading was taken. If there were three readings, the average of the second and third readings was used for the analysis. For those with one and two readings, the first and second readings were utilized, respectively. Serum total cholesterol was measured by the cholesterol oxidase method and analyzer ARCHITECT ci16200. Additionally, participants were asked whether they were taking lipid-lowing medications or not. FPG was assessed by using hexokinase method and analyzer Integra 800.
Life’s Simple 7
We adopted the AHA’s definition of Life’s Simple 7 based on our dataset structure, and the modified definition is detailed in Table 1.
 | Table 1 The modified definition of cardiovascular health metrics in the present study Abbreviations: BMI, body mass index; FPG, fasting plasma glucose. |
Ideal cardiovascular health was defined by the presence of all seven metrics. Ideal health behaviors and factors were defined by the presence of all four cardiovascular health behaviors and factors, respectively.5
Statistical analysis
Ideal proportions and corresponding confidence intervals (CIs) for each metric were calculated in the total population as well as by sex and age, categorized as young adults (ages 18–39 years), middle-aged adults (ages 40–59 years), and older adults (ages ≥60 years), subgroups. Proportions and CIs of the number of ideal cardiovascular health metrics from 0 to 7 and the numbers of ideal cardiovascular health behaviors and factors from 0 to 4 were also computed in the overall population and subgroups. Participants with available cardiovascular health metrics were included in ideal proportion estimates for specific metrics. Participants with complete information on all cardiovascular health metrics, behaviors, and factors were included for proportion estimates of the numbers of ideal cardiovascular health metrics, behaviors, and factors, respectively. Survey-based chi-square tests were conducted to compare subgroups.
Weights were applied to account for the sampling strategy and represent the overall Australian adult population. Since our study was based on those with biomedical samples, we used biomedical weights as recommended by ABS. In addition, we used jackknife method to estimate the sampling error.
All the analyses were performed in the ABS Remote Access Data Laboratory (RADL), and we used Stata Version 10.0, which is the available software of RADL. A two-tailed P-value of <0.05 was considered statistically significant.
Results
The distributions of the seven cardiovascular health metrics in the total population and subgroups are displayed in Table 2. In the overall population, the weighted proportions of ideal cardiovascular health metrics were as follows: FPG, 83.6%; smoking, 55.6%; total cholesterol, 45.5%; blood pressure, 44.2%; BMI, 39.2%; physical activity, 26.7%; dietary pattern, 4.8%. Men and women have similar ideal proportions regarding the total cholesterol (P=0.70). A significantly higher proportion of males had ideal physical activity compared to females (P<0.01). More women than men met favorable status of the other five metrics (P<0.01). The differences in the ideal proportions of these metrics were also noted across the three age groups. There is an increasing trend regarding the ideal proportion of dietary pattern with aging (P=0.01), whereas the tendency was reversed for the other six metrics (P<0.01).
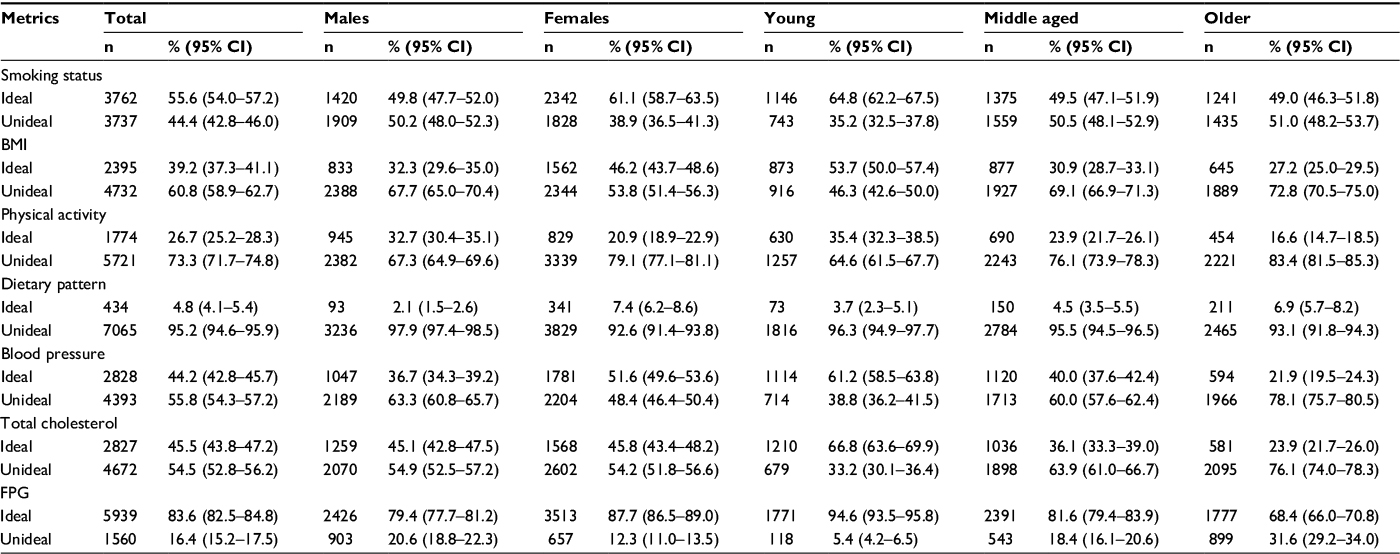 | Table 2 Weighted proportions of cardiovascular health metrics in Australian adults Abbreviations: CI, confidence interval; BMI, body mass index; FPG, fasting plasma glucose. |
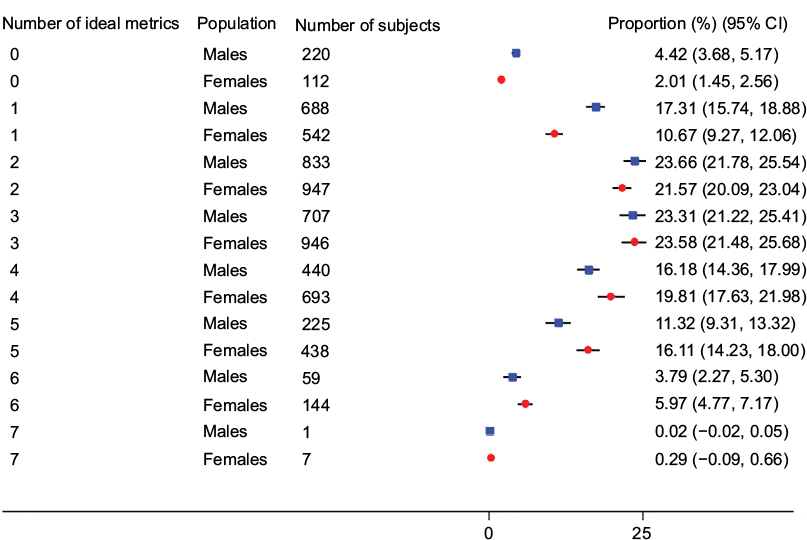
Only 0.15% of the total adults had all seven ideal cardiovascular health metrics, and the percentages are low across all the subgroups (Figures 1, S1, and S2). A total of 18.72% of participants had 5–7 ideal cardiovascular metrics, and the proportions varied by sex and age. It was 22.37% for women, 15.12% for men, 36.14% for young adults, 9.20% for middle-aged population, and 3.36% for older adults. Both males and females most commonly had 2–3 ideal components. Young adult subjects most frequently had 4–5 ideal metrics, whereas middle-aged and older subjects most frequently had 2–3 and 1–2 ideal metrics, respectively.
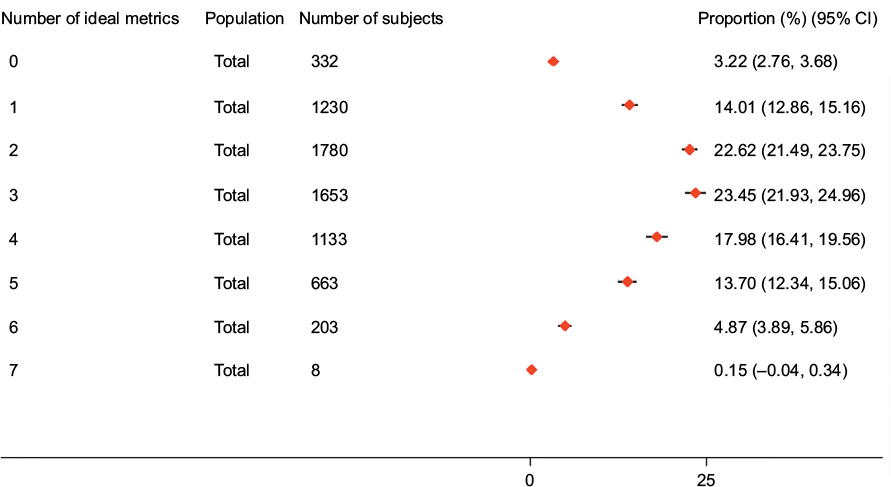 | Figure 1 Weighted proportions of subjects with different numbers of ideal cardiovascular health metrics in the overall population. Note: Error bars indicate 95% CIs. Abbreviation: CIs, confidence intervals. |
In the overall population, 0.52% participants had all four ideal behaviors and 16.38% had all four ideal factors (Figures 2 and 3). For cardiovascular health behaviors, women and young adult subjects most frequently had 1–2 ideal behaviors, while men, middle-aged, and older subjects most frequently had 0–1 ideal behaviors (Figures S3 and S4). For cardiovascular factors, men and women most commonly had 2–3 ideal factors. Young adult subjects most frequently had 3–4 ideal factors, whereas middle-aged and older subjects most commonly had 1–2 ideal factors (Figures S5 and S6).
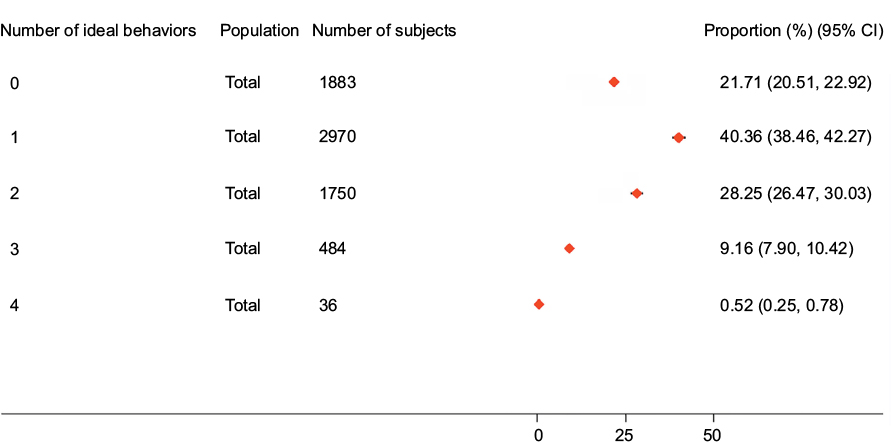 | Figure 2 Weighted proportions of subjects with different numbers of ideal cardiovascular health behaviors in the overall population. Note: Error bars indicate 95% CIs. Abbreviation: CIs, confidence intervals. |
 | Figure 3 Weighted proportions of subjects with different numbers of ideal cardiovascular health factors in the overall population. Note: Error bars indicate 95% CIs. Abbreviation: CIs, confidence intervals. |
Discussion
To the best of our knowledge, the current study is the first to assess cardiovascular health status, defined by the guidelines of AHA, in Australian adults using a nationally representative sample. There is a substantial difference between the ideal percentages of the seven metrics. Additionally, we observed the very low percentage of ideal cardiovascular health.
Among the seven metrics, FPG (83.6%) and smoking (55.6%) were with the highest proportions of ideal status. In contrast, very few participants have the ideal dietary pattern (4.8%) and physical activity (26.7%) status. Generally, the ranking in our study is consistent with the findings of a systematic review, which summarized the prevalence estimates from ~30 US and non-US studies.16 The AHA Committee has reported the estimated ideal percentages of the following seven metrics among American adults: smoking status, 73%; BMI, 33%; physical activity, 45%; dietary pattern, <0.5%; total cholesterol, 45%; blood pressure, 42%; FPG, 58%.5 In comparison, Australians displayed higher ideal percentages of BMI, dietary pattern, and FPG and lower ideal percentages of smoking and physical activity. Both populations have similar ideal proportions of total cholesterol and blood pressure.
We estimated that only 0.15% of Australian adults have ideal status on all of the seven metrics, and a number of studies from the USA,11,17–19 China,10,20 and Korea21 also reported a proportion of <1% for all the seven metrics. A large proportion, ~40%, of subjects have ideal status for ≤2 metrics, and it is generally consistent with two studies.18,19 However, several investigations reported higher11,22 or lower4,6 rates, indicating the possibilities of regional differences. Only 0.52 and 15.38% participants met the indices of ideal health behaviors and factors, respectively. The higher ideal percentages in factors other than behaviors are in agreement with two studies,12,23 while a US study displayed a 2.0% ideal health behaviors’ index and a 1.4% ideal health factors’ index.17 Given the current severe situation, the AHA’s goal to improve overall cardiovascular health by 20% by 2020 is tricky.
Another interesting phenomenon is the age and sex distinctions in cardiovascular health status. Middle-aged and older adults were more likely to consume sufficient fruits and vegetables when compared with the younger adults. A possible explanation is participants in those two groups tend to have higher income, which was positively associated with fruits’ and vegetables’ consumption.24 Younger adults demonstrated better status in other six metrics as well as overall cardiovascular health status. Thus, it is urgent to promote cardiovascular health status in middle- and older-aged individuals as adhering to and maintaining a healthy lifestyle has dramatic effects on CVD risk reduction among those age groups.3,25 Females tend to take fewer physical activities than males do, and a relatively longer duration of TV viewing time among women may be partly responsible for the sex difference.26 We observed larger proportions for the other ideal metrics, as well as larger number of ideal metrics, among females when compared with males. Given the situation, the policy makers should pay more attention to the alarming cardiovascular health status of Australian males in order to close the sex gap.
To our delight, some Australian research institutions have also recognized the significance of CVD prevention. The Australian National Heart Foundation has updated the guidelines for the management of absolute CVD risk in 2012 and extended the age range, from 45–74 years to 45 years or older, of eligible participants for CVD risk assessment.27 The Australian Diabetes, Obesity and Lifestyle Study has explored the relationships between several risk factors, such as longer television viewing time26 and diabetes,28 with CVD mortality in a large national cohort. Our findings have extended their efforts by including all adults, aged 18 years or older, and analyzing the combined effects of multiple CVD contributors. Given the fact that only a small proportion of subjects, <40% for all age and sex subgroups, were with 5–7 ideal cardiovascular health metrics, the population-wide strategy should be promoted to shift the entire distribution of CVD risk. The low ideal prevalence of dietary pattern and physical activity suggests that we should put in more effort to improve the status of these two metrics. Public awareness of CVD modifiable factors, promotion of laws and regulations to restrict unhealthy food, as well as improvement of access to fitness facilities could be effective measures to enhance the overall cardiovascular health status among Australian adults.
Several limitations of the current study should be considered. First, although our study was based on a nationally representative sample and used sampling weights, our study may still have selection bias. Second, the current study was a cross-sectional study and, thus, we could not explore the temporal trend of cardiovascular health status as well as Life’s Simple 7 and future CVD risk. Third, we were unable to take some other CVD influencing factors, such as menopause, into consideration due to limited variables and sample size. Fourth, our study only used one recall to measure dietary intake. Finally, we modified the AHA’s definition of cardiovascular health due to the data structures and it may lead to some misclassifications.
Conclusion
Our study demonstrates that the prevalence of ideal cardiovascular health is very low among Australian adults. The ideal status is less prevalent for some metrics, such as the dietary pattern and physical activity. Public health policies should be implemented to promote overall cardiovascular health status.
Acknowledgments
The authors thank the staff and participants of the Australian Health Survey for their contributions. This study was supported by 44078179 from the University of Queensland to YP and APP1042343 from National Health and Medical Research Council of Australia to ZW. The funders had no role in the design and conduct of the study, in the collection, analysis, and interpretation of the data, and in the preparation, review, or approval of the article.
Disclosure
The authors report no conflicts of interest in this work.
References
Sidney S, Quesenberry CP Jr, Jaffe MG, et al. Recent trends in cardiovascular mortality in the United States and public health goals. JAMA Cardiol. 2016;1(5):594–599. | ||
GBD 2013 Mortality and Causes of Death Collaborators. Global, regional, and national age-sex specific all-cause and cause-specific mortality for 240 causes of death, 1990–2013: a systematic analysis for the Global Burden of Disease Study 2013. Lancet. 2015;385(9963):117–171. | ||
Chiuve SE, McCullough ML, Sacks FM, Rimm EB. Healthy lifestyle factors in the primary prevention of coronary heart disease among men: benefits among users and nonusers of lipid-lowering and antihypertensive medications. Circulation. 2006;114(2):160–167. | ||
Yang Q, Cogswell ME, Flanders WD, et al. Trends in cardiovascular health metrics and associations with all-cause and CVD mortality among US adults. JAMA. 2012;307(12):1273–1283. | ||
Lloyd-Jones DM, Hong Y, Labarthe D, et al. Defining and setting national goals for cardiovascular health promotion and disease reduction: the American Heart Association’s strategic impact goal through 2020 and beyond. Circulation. 2010;121(4):586–613. | ||
Ford ES, Greenlund KJ, Hong Y. Ideal cardiovascular health and mortality from all causes and diseases of the circulatory system among adults in the United States. Circulation. 2012;125(8):987–995. | ||
Ommerborn MJ, Blackshear CT, Hickson DA, et al. Ideal cardiovascular health and incident cardiovascular events: the Jackson Heart Study. Am J Prev Med. 2016;51(4):502–506. | ||
Saleem Y, DeFina LF, Radford NB, et al. Association of a favorable cardiovascular health profile with the presence of coronary artery calcification. Circ Cardiovasc Imaging. 2015;8(1):e001851. | ||
Shay CM, Ning H, Allen NB, et al. Status of cardiovascular health in US adults: prevalence estimates from the National Health and Nutrition Examination Surveys (NHANES) 2003–2008. Circulation. 2012;125(1):45–56. | ||
Bi Y, Jiang Y, He J, et al. Status of cardiovascular health in Chinese adults. J Am Coll Cardiol. 2015;65(10):1013–1025. | ||
Djousse L, Petrone AB, Blackshear C, et al. Prevalence and changes over time of ideal cardiovascular health metrics among African-Americans: the Jackson Heart Study. Prev Med. 2015;74:111–116. | ||
Janković S, Stojisavljević D, Janković J, Erić M, Marinković J. Status of cardiovascular health in a transition European country: findings from a population-based cross-sectional study. Int J Public Health. 2014;59(5):769–778. | ||
Waters AM, Trinh L, Chau T, Bourchier M, Moon L. Latest statistics on cardiovascular disease in Australia. Clin Exp Pharmacol Physiol. 2013;40(6):347–356. | ||
Banks E, Crouch SR, Korda RJ, et al. Absolute risk of cardiovascular disease events, and blood pressure- and lipid-lowering therapy in Australia. Med J Aust. 2016;204(8):320. | ||
Korda RJ, Soga K, Joshy G, et al. Socioeconomic variation in incidence of primary and secondary major cardiovascular disease events: an Australian population-based prospective cohort study. Int J Equity Health. 2016;15(1):189. | ||
Younus A, Aneni EC, Spatz ES, et al. A systematic review of the prevalence and outcomes of ideal cardiovascular health in US and Non-US populations. Mayo Clin Proc. 2016;91(5):649–670. | ||
Bambs C, Kip KE, Dinga A, et al. Low prevalence of “ideal cardiovascular health” in a community-based population: the heart strategies concentrating on risk evaluation (Heart SCORE) study. Circulation. 2011;123(8):850–857. | ||
Folsom AR, Yatsuya H, Nettleton JA, et al. Community prevalence of ideal cardiovascular health, by the American Heart Association definition, and relationship with cardiovascular disease incidence. J Am Coll Cardiol. 2011;57(16):1690–1696. | ||
Artero EG, Espana-Romero V, Lee DC, et al. Ideal cardiovascular health and mortality: Aerobics Center Longitudinal Study. Mayo Clin Proc. 2012;87(10):944–952. | ||
Zhao Y, Yan H, Yang R, et al. Status of cardiovascular health among adults in a rural area of Northwest China: results from a cross-sectional study. Medicine (Baltimore). 2016;95(28):e4245. | ||
Kim JY, Ko YJ, Rhee CW, et al. Cardiovascular health metrics and all-cause and cardiovascular disease mortality among middle-aged men in Korea: the Seoul male cohort study. J Prev Med Public Health. 2013;46(6):319–328. | ||
Dong C, Rundek T, Wright CB, Anwar Z, Elkind MS, Sacco RL. Ideal cardiovascular health predicts lower risks of myocardial infarction, stroke, and vascular death across whites, blacks, and Hispanics: the Northern Manhattan Study. Circulation. 2012;125(24):2975–2984. | ||
Moghaddam MM, Mohebi R, Hosseini F, et al. Distribution of ideal cardiovascular health in a community-based cohort of Middle East population. Ann Saudi Med. 2014;34(2):134–142. | ||
Miller V, Yusuf S, Chow CK, et al. Availability, affordability, and consumption of fruits and vegetables in 18 countries across income levels: findings from the Prospective Urban Rural Epidemiology (PURE) study. Lancet Glob Health. 2016;4(10):e695–e703. | ||
Larsson SC, Akesson A, Wolk A. Healthy diet and lifestyle and risk of stroke in a prospective cohort of women. Neurology. 2014;83(19):1699–1704. | ||
Rogerson MC, Le Grande MR, Dunstan DW, et al. Television viewing time and 13-year mortality in adults with cardiovascular disease: data from the Australian diabetes, obesity and lifestyle study (AusDiab). Heart Lung Circ. 2016;25(8):829–836. | ||
Australian National Heart Foundation. Guidelines for the Management of Absolute Cardiovascular Disease Risk. Available from: https://www.heartfoundation.org.au/images/uploads/publications/Absolute-CVD-Risk-Full-Guidelines.pdf. Accessed December 19, 2017. | ||
Barr EL, Zimmet PZ, Welborn TA, et al. Risk of cardiovascular and all-cause mortality in individuals with diabetes mellitus, impaired fasting glucose, and impaired glucose tolerance: the Australian Diabetes, Obesity, and Lifestyle study (AusDiab). Circulation. 2007;116(2):151–157. |
Supplementary materials
 | Figure S1 Weighted proportions of subjects with different numbers of ideal cardiovascular health metrics, stratified by sex. Note: Error bars indicate 95% CIs. Abbreviation: CIs, confidence intervals. |
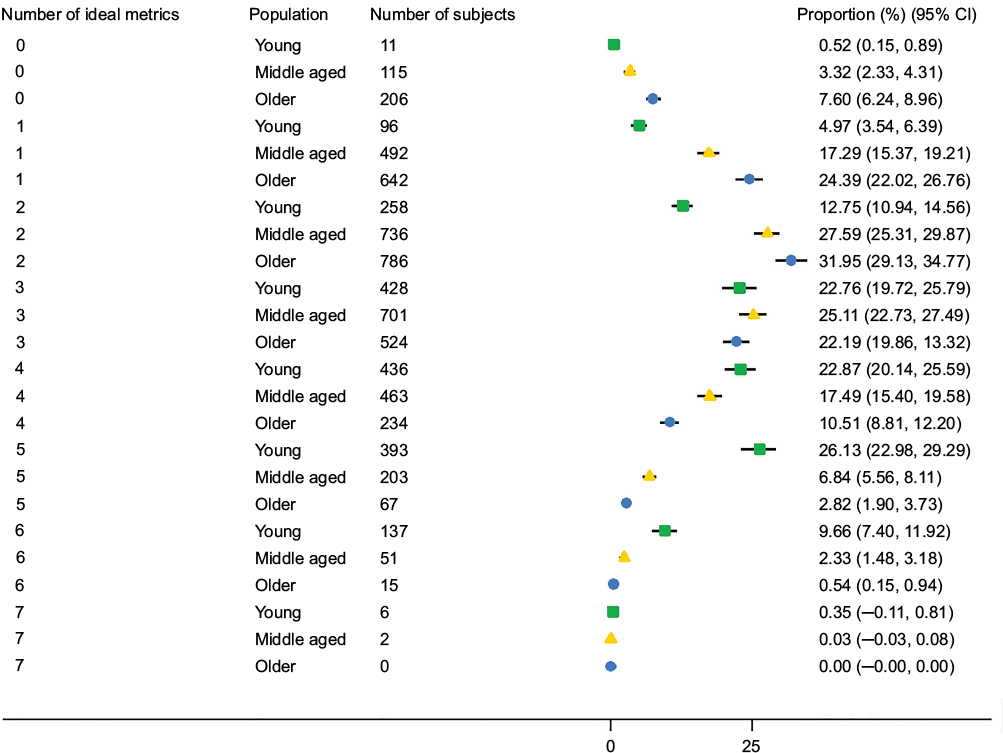 | Figure S2 Weighted proportions of subjects with different numbers of ideal cardiovascular health metrics, stratified by age. Note: Error bars indicate 95% CIs. Abbreviation: CIs, confidence intervals. |
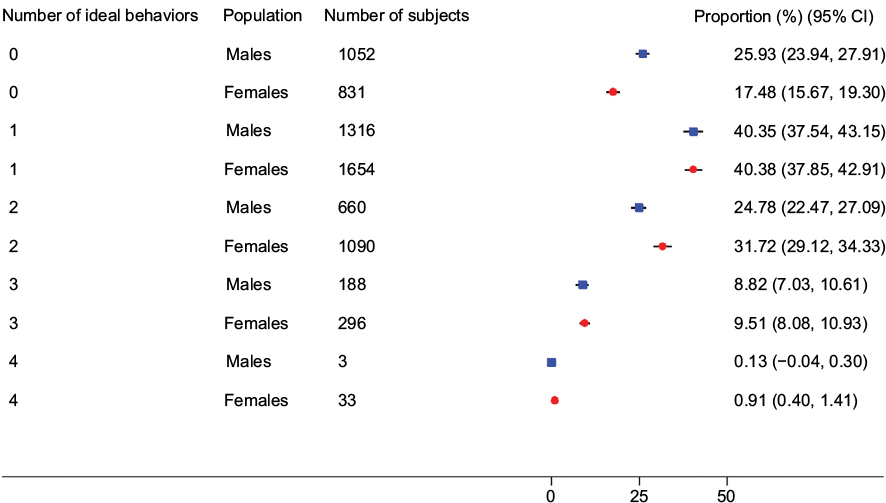 | Figure S3 Weighted proportions of subjects with different numbers of ideal cardiovascular health behaviors, stratified by sex. Note: Error bars indicate 95% CIs. Abbreviation: CIs, confidence intervals. |
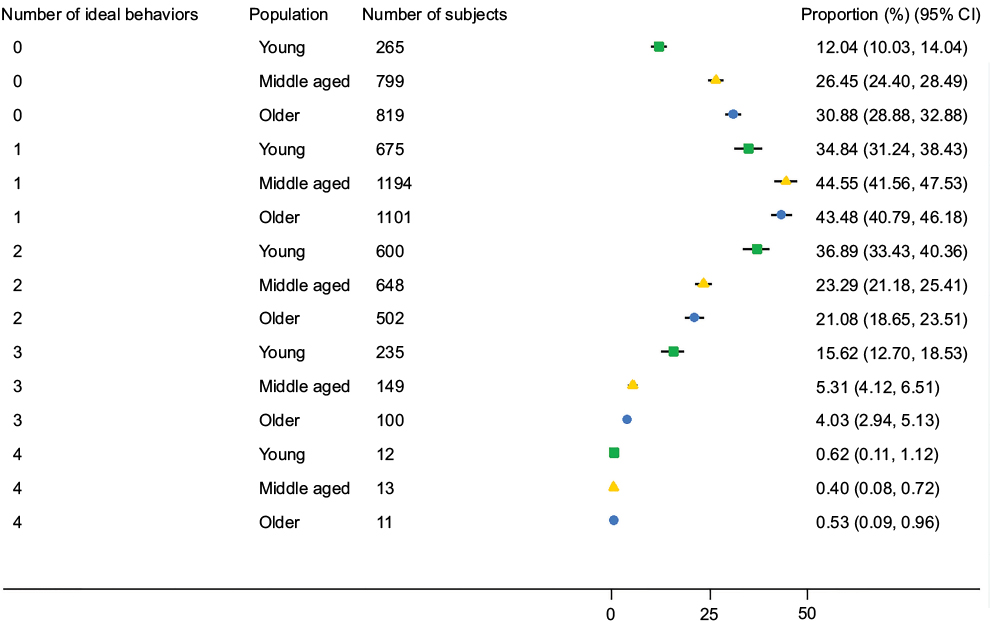 | Figure S4 Weighted proportions of subjects with different numbers of ideal cardiovascular health behaviors, stratified by age. Note: Error bars indicate 95% CIs. Abbreviation: CIs, confidence intervals. |
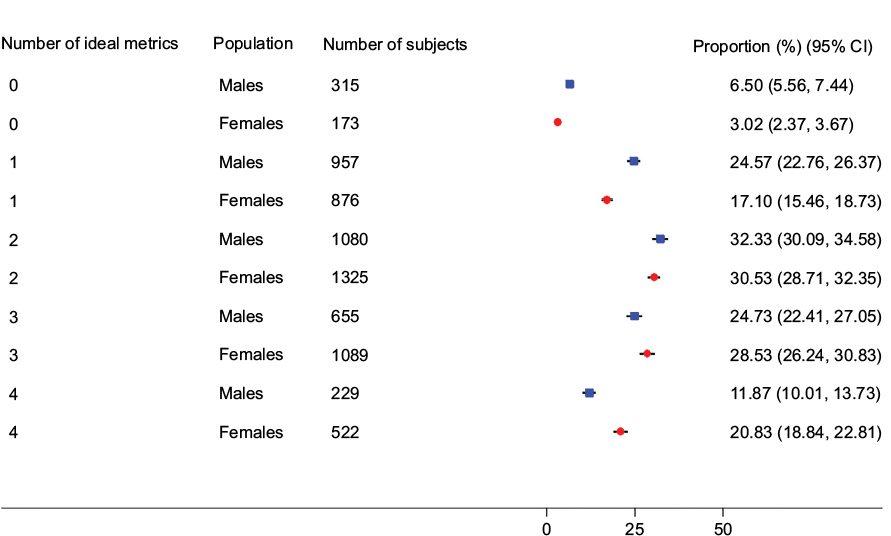 | Figure S5 Weighted proportions of subjects with different numbers of ideal cardiovascular health factors, stratified by sex. Note: Error bars indicate 95% CIs. Abbreviation: CIs, confidence intervals. |
 | Figure S6 Weighted proportions of subjects with different numbers of ideal cardiovascular health factors, stratified by age. Note: Error bars indicate 95% CIs. Abbreviation: CIs, confidence intervals. |
 © 2018 The Author(s). This work is published and licensed by Dove Medical Press Limited. The
full terms of this license are available at https://www.dovepress.com/terms
and incorporate the Creative Commons Attribution
- Non Commercial (unported, 3.0) License.
By accessing the work you hereby accept the Terms. Non-commercial uses of the work are permitted
without any further permission from Dove Medical Press Limited, provided the work is properly
attributed. For permission for commercial use of this work, please see paragraphs 4.2 and 5 of our Terms.
© 2018 The Author(s). This work is published and licensed by Dove Medical Press Limited. The
full terms of this license are available at https://www.dovepress.com/terms
and incorporate the Creative Commons Attribution
- Non Commercial (unported, 3.0) License.
By accessing the work you hereby accept the Terms. Non-commercial uses of the work are permitted
without any further permission from Dove Medical Press Limited, provided the work is properly
attributed. For permission for commercial use of this work, please see paragraphs 4.2 and 5 of our Terms.