Back to Journals » Veterinary Medicine: Research and Reports » Volume 5
Canine cerebrospinal fluid total nucleated cell counts and cytology associations with the prevalence of magnetic resonance imaging abnormalities
Authors Hugo T, Heading K, Labuc R
Received 9 March 2014
Accepted for publication 23 May 2014
Published 18 August 2014 Volume 2014:5 Pages 75—84
DOI https://doi.org/10.2147/VMRR.S63805
Checked for plagiarism Yes
Review by Single anonymous peer review
Peer reviewer comments 3
Timothy B Hugo, Kathryn L Heading, Robert H Labuc
Melbourne Veterinary Specialist Centre, Glen Waverley, Vic, Australia
Introduction: The combination of cerebrospinal fluid (CSF) analysis and magnetic resonance imaging (MRI) are often used to investigate intracranial disease in dogs. The aim of this retrospective study was to determine if the total nucleated cell count (TNCC) or cytology findings in abnormal CSF are associated with the prevalence of MRI abnormalities.
Materials and methods: For each case, the TNCC was categorized into one of three groups: A (<25×106/L); B (25–100×106/L); and C (>100×106/L). Cytology findings were categorized by the predominant cell type as lymphocytic, monocytoid, neutrophilic, or eosinopilic. MRI descriptions were classified as either normal or abnormal, and abnormal studies were further evaluated for the presence of specific characteristics (multifocal or diffuse disease versus focal disease, positive T2-weighted hyperintensity, positive FLAIR hyperintensity, contrast enhancement, mass effect, and the presence of poorly or well-defined lesion margins).
Results: Forty-five dogs met the inclusion criteria and MRI abnormalities were found in 29/45 (64%) dogs. TNCCs were not associated with the prevalence of MRI abnormalities or specific characteristics. Cytology categories were significantly associated with the prevalence of MRI abnormalities (P<0.001). Specifically, monocytoid cytology was 22.8 times more likely to have an abnormal MRI than lymphocytic cytology. CSF cytology was not significantly associated with specific abnormal MRI characteristics.
Conclusion: There are minimal associations between CSF abnormalities and the prevalence of MRI abnormalities. These results support the continued importance of utilizing both tests when investigating intracranial disease. When CSF analysis must be performed initially, this study has demonstrated that an abnormal CSF with a monocytoid cytology supports the value of performing a brain MRI in dogs with evidence of intracranial neurological disease.
Keywords: cerebrospinal fluid, magnetic resonance imaging, canine, total nucleated cell counts, cytology
Introduction
A variety of central nervous system diseases result in an increase in the total nucleated cell count (TNCC) of the cerebrospinal fluid (CSF), known as a pleocytosis.1,2 Prior to the advent of advanced diagnostic imaging procedures, such as magnetic resonance imaging (MRI), the detection of a pleocytosis was historically a principal means for confirming central nervous system disease antemortem.3 Pleocytosis can be induced by primary inflammation of the central nervous system, such as that seen with infectious diseases caused by bacterial, viral, fungal, or protozoal etiological agents; suspected immune-mediated etiology; or those of unknown etiology.1,4–6 CSF pleocytosis is also reported in association with a secondary inflammatory response or a breakdown of the blood–brain barrier induced by trauma, neoplasia, infarction, hemorrhage, or certain degenerative conditions.1–4 These changes have also been observed in some neoplastic processes due to direct shedding of neoplastic cells into the CSF, such as in cases of lymphoma and malignant histiocytosis.7,8 Seizure activity in humans has also been found to induce CSF pleocytosis and is suspected to also occur in dogs.9
With the increasing availability of advanced diagnostic imaging modalities, particularly MRI, the investigation of CNS disease in companion animals has been revolutionized. MRI is a noninvasive imaging modality that constructs images of the brain using the magnetic resonance of protons under the influence of various radio wave pulses.10,11 It is currently the imaging modality of choice for examining the intracranial anatomic characteristics antemortem, and it provides superior etiologic information when compared to CSF for most central nervous system disease processes.3,11,12 Additional advantages of MRI are its ability to identify contraindications to CSF collection, such as atlantoaxial subluxation, Chiari-like malformation and mass lesions that increase the risk of brain herniation.2
A recent study by Wolff et al13 that investigated 77 dogs with histopathologically confirmed brain disease demonstrated that MRI had an overall sensitivity and specificity of 95.7% and 96.2%, respectively. Similar results were also reflected by another study of 256 dogs with central nervous system disease, of which 89% (170/192) of cases demonstrated abnormalities on MRI for clinical diagnoses in which abnormalities were expected.3 In comparison, the same study found that CSF was abnormal in only 75% (144/192) of cases. These findings have anecdotally led to questions regarding the value or need for the continued collection of CSF for analysis in the investigation of dogs with central nervous system disease, particularly given its added risk of complications, such as brainstem or spinal cord trauma, herniation, and iatrogenic infection.2,5
One area in which CSF continues to remain advantageous with respect to MRI is in the context of inflammatory disease of the central nervous system. Specifically, in the study by Bohn et al,3 85% (44/52) of dogs with inflammatory disease had CSF abnormalities, whereas only 62% (31/52) had abnormal findings on MRI. Also, in Wolff et al’s study,13 18 patients had confirmed inflammatory CNS disease, for which MRI had a sensitivity and specificity of 80.7% and 95.4%, respectively. These studies and others investigating patients with inflammatory CSF have identified an incidence of concurrent MRI abnormalities ranging from 74%–92%.3,14,15 Thus, certainly with regards to inflammatory CNS disease, CSF analysis still appears to have diagnostic value in identifying affected dogs and prioritizing differential diagnoses based on MRI abnormalities.
Apart from these studies, there is limited information in the veterinary literature relating to whether patterns of CSF abnormalities may account for enhanced associations with the prevalence of MRI abnormalities. As stated earlier, primary inflammation or breakdown of the blood–brain barrier is associated with a pleocytosis.1–6 Consequently, we hypothesized that a greater TNCC would reflect more severe central nervous system pathology and perhaps be associated with an increased prevalence of MRI abnormalities despite the underlying etiology. With regards to CSF cytology, one previous study16 identified that patients with a low CSF TNCC (<5×10⁹ cells/L) and the presence of activated macrophages on cytology were significantly more likely to have MRI abnormalities. This particular study only included patients with low TNCCs. We therefore also hypothesized that other associations may exist for all TNCCs and other CSF leukocytes. To our knowledge, further investigation into the presence of associations between CSF TNCCs or cytology categories and MRI findings has not been investigated. Thus, the primary aim of this study was to determine if CSF TNCCs or cytology findings were associated with the prevalence of abnormal MRI studies. In addition, it also aimed to determine whether specific abnormal MRI characteristics were associated with specific TNCC values or cytology.
Materials and methods
Case selection
Dogs that were referred for investigation of a neurological disease and that were undergoing MRI of the brain and CSF analysis at Veterinary Specialist Services in Brisbane, Australia from 2008–2012 were eligible for inclusion in this study. Patient breed, age, sex, neutering status, and clinical signs were recorded. Dogs with a history of receiving corticosteroids in the preceding month were excluded from the study.
Cerebrospinal fluid analysis
All CSF samples were collected from the cerebromedullary cistern and analyzed within 4–8 hours of collection at commercial veterinary laboratories. For each CSF sample, the protein concentration, TNCC, and differential cell count were recorded. Protein concentrations were determined by micro protein assays and values <0.3 g/L were considered normal. The TNCC was determined using a hemacytometer. In cases with blood contamination of the fluid, a corrected estimate of the TNCC was made by subtracting one total nucleated cell for every 500 red blood cells.5,17 Differential cell counts were based on a 100 cell count from slides prepared from cytocentrifugation when possible, or the documented predominant cell type when reported. All samples were assessed by a clinical pathologist and only patients with an abnormal CSF analysis, as will be defined, were included in the study.
Abnormal CSF was defined by the presence of a pleocytosis, an abnormal CSF differential cell count as determined by a pathologist, or comments by the pathologist that the cytology was compatible with inflammation. The cut-off value for a pleocytosis was fluid with a TNCC >6×10⁶ cells/L, with this value based on the laboratory’s reference range. Each TNCC was then categorized into one of three groups based on previous published data for reported mild, moderate, and marked pleocytoses.2 Group A (mild) consisted of patients with CSF characterized by either abnormal cytology with a TNCC <6×10⁶ cells/L, or a pleocytosis of <25×106 cells/L. Group B (moderate) contained patients with a pleocytosis of 25–100×106 cells/L. Group C (marked) contained patients with a pleocytosis of >100×106 cells/L. Each sample was also separately categorized based on the cytology findings as lymphocytic, monocytoid, neutrophilic, or eosinopilic based on the predominant cell type. Samples for which a differential cell count or the predominant cell type was not available were excluded from the statistical analysis of the CSF cytology.
Image analysis
All MRI studies were performed using a machine with a field strength of 0.25 Tesla (Vet-MR Grande; Esaote SpA, Genoa, Italy). Different solenoid coils were used depending on the head size. All studies included T1- and T2-weighted transverse, sagittal, and dorsal images. Fluid-attenuated inversion–recovery (FLAIR) images were assessed when performed. T1-weighted images in all planes post-contrast administration were also assessed when available. For contrast studies, dimeglumine gadopentetate (Magnevist®; Bayer AG, Leverkusen, Germany) was administered at a dose rate of 0.09 mg/kg (intravenously) immediately prior to performing the necessary T1-weighted scans. All MRI studies were interpreted by a specialist veterinary radiologist (Dr N Lester or Dr Z Lenard at the Veterinary Imaging Centre in Perth, Australia). All MRI reports were assessed by the author (TBH) and then classified as either abnormal or normal, based on the presence or absence of reported intracranial abnormalities, respectively. Mild ventricular asymmetry or ventriculomegaly was considered normal. Extra-axial abnormalities that did not have direct communication with the cranial vault were not defined as MRI abnormalities. Normal MRI examinations that had not received FLAIR imaging or contrast were excluded from the study. Abnormal MRI reports were subsequently evaluated for the presence of the following specific characteristics: multifocal or diffuse disease versus focal disease; positive T2-weighted hyperintensity; positive FLAIR hyperintensity; contrast enhancement; a mass effect; and the presence of poorly or well-defined lesion margins.
Statistical analysis
Statistical analysis of the results was performed using Fisher’s exact tests for all variables with respect to groups A, B, and C, and the cytology categories. Odds ratios were subsequently calculated for all significant variables. To eliminate the effect of the TNCC groupings, TNCCs were also analyzed individually using two-sample Student’s t-tests. These analyses were performed on the log of TNCCs for both the incidence of abnormal MRI studies and for each specific characteristic analyzed. Geometric means for each log TNCC variable were calculated. The differences between the mean log TNCC complementary variables were determined, along with the confidence intervals and P-values. The exponentiation of these mean log TNCC differences was used to generate odds ratios. All analyses were performed using a statistical computer program (R statistical package, version 2.14.1; R Foundation for Statistical Computing, Institute for Statistics and Mathematics, Wirtschafts Universitat Wein, Vienna, Austria), and statistical significance was determined by a P-value <0.05.
Results
Approximately 300 dogs had concurrent CSF analysis and MRI performed at the Veterinary Specialist Services in Brisbane, Australia between 2008 and 2012. Sixty-five dogs had an abnormal CSF, but due to recent administration of corticosteroids, incomplete records, lost images for review, or the absence of MRI interpretation by a specialist veterinary radiologist, only 45 met the inclusion criteria for this study. Of these 45 dogs, crossbreds were most common (number [n]=8), followed by Maltese (n=5), Staffordshire Bull Terriers (n=5), Boxers (n=3), Golden Retrievers (n=2), Cavalier King Charles Spaniels (n=2), Cocker Spaniels (n=2), as well as single cases in the following breeds: a Beagle; Labrador Retriever; Pug; Greyhound; Keeshond; West Highland White Terrier; Shar-Pei; Miniature Fox Terrier; Border Collie; Welsh Corgi; Weimaraner; Rottweiler; Silky Terrier; Dalmatian; Australian Bulldog; German Coolie; Japanese Spitz; and Rhodesian Ridgeback. The mean and median ages of the dogs in the study were 7.4 years and 7 years, respectively (range: 11 months to 14 years). Twenty-three were male, of which seven were entire, and 22 were female, of which three were entire.
The most common clinical signs recorded included ataxia (n=18), seizures (n=16), head tilt (n=15), postural reaction deficits (n=14), and circling (n=12). Less commonly recorded clinical signs included behavioral changes (n=8), neck pain (n=7), nystagmus (n=7), facial nerve paralysis (n=6), paresis (n=6), inappetance (n=5), tremors (n=5), altered mentation (n=5), imbalance (n=5), and abnormal menace response (n=5). Uncommon clinical signs included trigeminal nerve defects (n=3), abnormal pupillary light reflex (n=2), a head bob (n=2), lethargy (n=2), and vomiting (n=2). There were single reports of the following clinical signs: blindness; dysmetria; Horner’s syndrome; pacing; head pressing; crab walking; weakness; muscle wastage; nasal discharge; and stertor.
CSF protein concentrations were available for 44/45 (98%) dogs (Table S1-S2). In one sample, a result was not available due to an insufficient volume of fluid. The median protein concentration was 0.49 g/L and ranged from <0.10–4.56 g/L. In 14 dogs, the CSF protein concentration was normal. Seven of these had abnormal MRI findings.
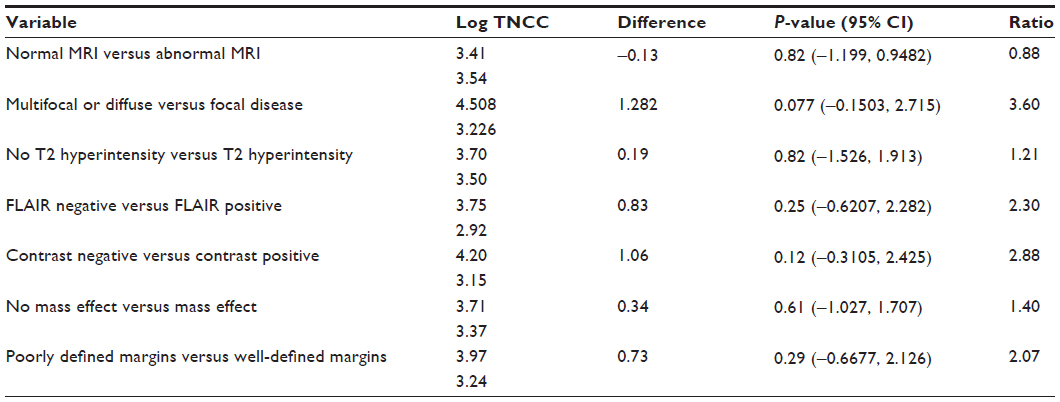
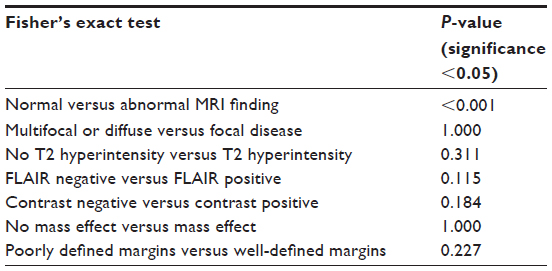
In total, MRI abnormalities were found in 29/45 (64%) dogs (Table S1-S4). There were 20 dogs in group A, of which 12 (60%) had abnormal MRI findings. Fourteen dogs were placed in group B, of which ten (71%) had abnormal MRI findings. Thirteen dogs were placed in group C, of which seven (54%) had abnormal MRI findings. No statistically significant difference was detected between groups A, B, and C, and the prevalence of MRI abnormalities (P=0.921). Of the abnormal MRI studies, T1- and T2-weighted images were available for all cases. FLAIR images were available for 23/29 abnormal MRI studies. Contrast was administered in 27/29 abnormal MRI studies. When further comparisons of groups A, B, and C were made against specific abnormal MRI characteristics, no significant findings were identified (Table 1). When TNCCs were analyzed individually, no significant findings were identified in either the prevalence of abnormal MRIs or the specific characteristics (Table 2).
 | Table 1 Fisher’s exact test results for total nucleated cell count groups and the prevalence of MRI abnormalities |
 | Table 2 Two-sample Student’s t-test results for log individual total nucleated cell counts and the prevalence of MRI abnormalities |
Of the 45 dogs included in this study, differential cell counts or a reported predominant cell type were only available for 37. Of these, MRI abnormalities were identified in 25/37 (68%) dogs (Table S1–S2, S5–S6). The statistical analysis demonstrated a significant difference between cytology categories and the prevalence of MRI abnormalities (P<0.001). Twenty dogs had their CSF cytology categorized as monocytoid, of which 19 (95%) had abnormal MRI findings. The cytology was categorized as lymphocytic in eleven dogs, of which five (45%) had abnormal MRI findings. Six dogs had CSF cytology categorized as neutrophilic, of which one (17%) had abnormal MRI findings. No cytology samples were categorized as eosinophilic.
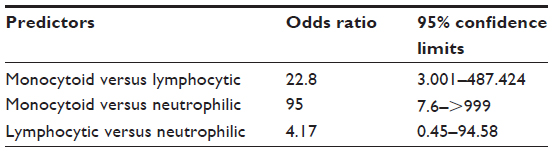
The odds ratio for the monocytoid versus lymphocytic cytology in the presence of an abnormal MRI study was 22.8 (95% confidence interval =3.001–487.424). The odds ratio for the monocytoid versus neutrophilic cytology was 95 (95% confidence interval =7.6−>999). Other odds ratio calculations are outlined in Table 3. Statistical significance was not identified for either lymphocytic or monocytoid cytology groups when compared against the specific abnormal MRI characteristics (Table 4). Statistical comparisons of neutrophilic cytology and specific abnormal MRI characteristics were not performed due to an inadequate number of cases.
 | Table 3 Odds ratios for pleocytosis categories and the prevalence of MRI abnormalities |
 | Table 4 Fisher’s exact test results for pleocytosis category and the prevalence of MRI abnormalities |
Discussion
This study has identified a significant association between abnormal CSF cytology and the prevalence of MRI abnormalities. Specifically, the finding of monocytoid cytology was 22.8 times more likely to have an abnormal MRI than lymphocytic cytology. The odds ratios also found that monocytoid cytology was 95 times more likely to have an abnormal MRI than neutrophilic cytology, although the reliability of this value may be limited due to the small population size of the cases classified as neutrophilic. To the authors’ knowledge, this is the first study to report this particular relationship between CSF cytology and the prevalence of MRI abnormalities. As previously mentioned, another study16 found that dogs with abnormal brain MRI examinations were significantly more likely to have activated macrophages within their CSF. The activated macrophages were considered present when reported separately from the monocytoid cells within the differential cell count, or when larger mononuclear cells were described as phagocytic or having foamy cytoplasm. That study did not identify whether all patients with activated macrophages had a predominance of monocytoid cells, as has been identified by the present study. It also only assessed patients with a low TNCC of <5×10⁹ cells/L.16
No patients in this study had eosinophilic cytology, and only 1/6 patients had neutrophilic cytology with a concurrent abnormal MRI. Therefore, the association of these cytology categories with specific abnormal MRI characteristics was not possible in the present study, nor was it possible to investigate for an association between an eosinophilic cytology and the prevalence of abnormal MRI studies.
This study did not find significant associations between groups A, B, and C, and the prevalence of MRI abnormalities or specific abnormal MRI characteristics. There were also no significant associations when comparisons were made by comparing individual TNCC values with the prevalence of MRI abnormalities or specific abnormal MRI characteristics. These results indicate that contrary to our initial hypothesis, a greater pleocytosis is not associated with a greater prevalence of MRI abnormalities. This finding has not been previously reported in the literature. The results also suggest that the results of an MRI cannot be relied upon to determine the severity of TNCC changes.
As previously mentioned, a pleocytosis can be induced by either primary inflammatory disease of the central nervous system, or by other pathological processes that induce secondary inflammation or destruction of the blood–brain barrier. Unfortunately, due to the poor availability of histopathological diagnoses in this study, we were unable to further subcategorize cases according to their underlying primary disease. Consequently, the mixed etiology of cases within each TNCC group may have hindered our ability to identify associations that may otherwise exist. For instance, an inverse (or a lack of) an association for certain etiologies may exist. Ideally, further investigations utilizing histopathology results would be required to investigate for correlations between TNCCs and the incidence of MRI abnormalities, more thoroughly. Alternatively, it would also be beneficial to further subcategorize TNCC groups by their cytology category. This would reduce the mixed etiology of cases in each group and more accurately define the relationships between CSF and MRI abnormalities, where histopathology is not available. Unfortunately, this was not possible in the present study due to the limited case numbers.
In this study, only 64% of patients with intracranial disease, as determined by abnormal CSF, had structural changes identified on MRI. This is slightly lower than the rate quoted previously in the literature (74%–92%).3,14,15 In one study of 65 dogs with abnormal CSF analysis,14 74% had MRI abnormalities. Similar results were also found in another study of 25 dogs with abnormal CSF, where 76% were found to have MRI changes.15 Another study of 256 dogs found that 92% of 160 dogs with abnormal CSF had changes on MRI of either the brain or spine.3 It is important to note that inflammatory central nervous system disease was present in 52 dogs in this study. Of these, CSF was abnormal in 44 dogs, with 26/44 (59%) exhibiting concurrent MRI abnormalities. This is in contrast to the first two studies that included only dogs with intracranial disease.14,15
Reasons for the lower incidence of MRI abnormalities in the current study may relate to differences in the populations assessed between studies, and thus to the frequency and patterns of the diseases encountered. Another consideration is inherent bias due to the retrospective nature of the study. MRI of the brain, followed by CSF analysis, was offered as the standard approach to investigating all patients with suspected intracranial disease. Unfortunately, due to a number of factors, including fiscal constraints, clinician preference based on the most likely diagnosis predicted, and the identification of contraindications to CSF collection, not all patients with suspected intracranial disease underwent both an MRI of the brain and CSF analysis. This resulted in the exclusion of some patients from the study and may have led to case selection bias. Prospective studies in which both MRI of the brain and CSF analysis are performed in all patients are necessary to avoid these limitations and definitively identify all correlations between abnormal CSF and MRI abnormalities.
It is commonly recommended that CSF analysis be performed as soon as possible following collection to avoid sample deterioration.4,10 In the present study, as analysis was performed at commercial veterinary laboratories distant to the site of collection, it was often delayed by 4–8 hours. A previous study has demonstrated that the TNCC is not significantly altered if analyzed within 48 hours of collection when stored at 4°C.18 All TNCCs obtained in the present study are therefore considered to be accurate. The previous study, however, also found that 33% of cells were unrecognizable on cytology in samples with protein concentration <0.5 g/L if analyzed at 12 hours post-collection. If protein concentration was ≥0.5g/L, only 6% of cells were unrecognizable at 12 hours.18 Large mononuclear cells were most likely to be altered in morphology (significantly decreased by 2 hours post-collection), followed by small mononuclear cells (significantly decreased by 12 hours post-collection), neutrophils (significantly decreased by 24 hours post-collection), and eosinophils (significantly decreased by 48 hours post-collection).18 In the present study, 23/44 (50%) patients had CSF protein concentrations <0.5 g/L. Nineteen of these had cytology results available, of which 9/19 (47%) were categorized by their cytology as either having a lymphocytic or neutrophilic pleocytosis. Therefore, there may be underestimation of a large mononuclear cell presence. This phenomenon may have influenced the statistical findings and should be considered with any future prospective studies.
Postictal alterations in CSF TNCCs and cytology have been widely reported to occur in humans.19 Some studies have reported an incidence as high as 30% based on anecdotal reports and case series.19 In a more recent study that investigated postictal CSF abnormalities in children,20 only 5% of cases were found to have a postictal pleocytosis in samples collected <24 hours after a seizure, where no other cause for pleocytosis could be identified. Interestingly, that study excluded samples with an erythrocyte count of ≥1,000×106 erythrocytes/L. Had they been included, 33% of cases would have been reported as having a postictal pleocytosis.20 In our study, 16/45 (36%) patients were reported to have had seizures (generalized or partial) in their records; however, none of these cases had erythrocyte counts ≥1,000×106 erythrocytes/L (data not shown). Therefore, while this factor is a consideration, due to the lack of significant blood contamination in samples collected from patients with a history of seizures, its influence on the results is considered negligible.
Conclusion
In conclusion, contrary to our initial hypothesis, this study has demonstrated that in a group of patients with a variety of central nervous system disease etiologies, both CSF TNCC groups and individual CSF TNCCs are not significantly associated with the prevalence of MRI abnormalities or specific abnormal MRI characteristics. Further studies based on histopathological diagnosis or further subcategorizing of the TNCC groups based on their cytology may identify associations that could not be identified in this study. Until then, these results emphasize that in clinical practice, both CSF analysis and MRI should continue to be performed in combination, as results of either test alone cannot be utilized to predict the results of the other.
A statistically significant association was identified between abnormal CSF cytology and the prevalence of MRI abnormalities. Specifically, monocytoid cytology is 22.8 times more likely to be associated with an abnormal MRI than lymphocytic cytology. It is also suggested to be even more likely associated with an abnormal MRI than neutrophilic cytology. This relationship has not been previously reported in the veterinary literature. In veterinary practice, both MRI and CSF collection to investigate intracranial disease are typically performed during the same general anesthetic for logistical reasons. When this is not the case and CSF analysis must be performed initially, this study has demonstrated that cytology results can be clinically utilized to support the value of performing a brain MRI in dogs with evidence of intracranial neurological disease. Future studies utilizing larger group sizes may identify other associations between cytology and MRI abnormalities.
Acknowledgments
Thank you to the Medicine Department of Veterinary Specialist Services in Brisbane, Australia, and to Dr Navneet Dhand of Sydney University for performing the statistical calculations.
Disclosure
The authors report no conflicts of interest in this work.
References
Freeman RA, Raskin RE. Cytology of the central nervous system. In: Raskin RE, Meyer DJ, editors. Atlas of Canine and Feline Cytology. Philadelphia, PA: Saunders; 2001:325–365. | |
Di Terlizzi R, Platt SR. The function, composition and analysis of cerebrospinal fluid in companion animals: part II – analysis. Vet J. 2009;180(1):15–32. | |
Bohn AA, Wills TB, West CL, Tucker RL, Bagley RS. Cerebrospinal fluid analysis and magnetic resonance imaging in the diagnosis of neurologic disease in dogs: a retrospective study. Vet Clin Pathol. 2006;35(3):315–320. | |
Chrisman CL. Cerebrospinal fluid analysis. Vet Clin North Am Small Anim Pract. 1992;22(4):781–810. | |
Rusbridge C. Collection and interpretation of cerebrospinal fluid in cats and dogs. In Pract. 1997;19:322–331. | |
Durcoté JM, Dewey CW. Neurodiagnostics. In: Dewey CW, editor. A Practical Guide to Canine and Feline Neurology. Ames, IA: Iowa State University Press; 2003:57–98. | |
Long SN, Johnston PE, Anderson TJ. Primary T-cell lymphoma of the central nervous system in a dog. J Am Vet Med Assoc. 2001;218(5):719–722. | |
Zimmerman K, Almy F, Carter L, et al. Cerebrospinal fluid from a 10-year-old dog with a single seizure episode. Vet Clin Pathol. 2006;35(1):127–131. | |
Barry E, Hauser WA. Pleocytosis after status epilepticus. Arch Neurol. 1994;51(2):190–193. | |
Thomson CE, Kornegay JN, Stevens JB. Analysis of cerebrospinal fluid from the cerebellomedullary and lumbar cisterns of dogs with focal neurologic disease: 145 cases (1985–1987). J Am Vet Med Assoc. 1990;196(11):1841–1844. | |
Hecht S, Adams WH. MRI of brain disease in veterinary patients part 1: Basic principles and congenital brain disorders. Vet Clin North Am Small Anim Pract. 2010;40(1):21–38. | |
LeCouteur RA. Current concepts in the diagnosis and treatment of brain tumours in dogs and cats. J Small Anim Pract. 1999;40(9):411–416. | |
Wolff CA, Holmes SP, Young BD, et al. Magnetic resonance imaging for the differentiation of neoplastic, inflammatory, and cerebrovascular brain disease in dogs. J Vet Intern Med. 2012;26(3):589–597. | |
Bush WW, Barr CS, Darrin EW, Shofer FS, Vite CH, Steinberg SA. Results of cerebrospinal fluid analysis, neurologic examination findings, and age at the onset of seizures as predictors for results of magnetic resonance imaging of the brain in dogs examined because of seizures: 115 cases (1992–2000). J Am Vet Med Assoc. 2002;220(6):781–784. | |
Lamb CR, Croson PJ, Cappello R, Cherubini GB. Magnetic resonance imaging findings in 25 dogs with inflammatory cerebrospinal fluid. Vet Radiol Ultrasound. 2005;46(1):17–22. | |
Doyle C, Solano-Gallego L. Cytologic interpretation of canine cerebrospinal fluid samples with low total nucleated cell concentration, with and without blood contamination. Vet Clin Pathol. 2009;38(3):392–396. | |
Taylor SM. Diagnostic tests for the neuromuscular system. In: Nelson RW, Couto CG, editors. Small Animal Internal Medicine. 4th ed. St Louis, MO: Mosby Elsevier; 2009:1007–1018. | |
Fry MM, Vernau W, Kass PH, Vernau KM. Effects of time, initial composition, and stabilizing agents on the results of canine cerebrospinal fluid analysis. Vet Clin Pathol. 2006;35(1):72–77. | |
Prokesch RC, Rimland D, Petrini JL, Fein AB. Cerebrospinal fluid pleocytosis after seizures. South Med J. 1983;76(3):322–327. | |
Wong M, Schlaggar BL, Landt M. Postictal cerebrospinal fluid abnormalities in children. J Pediatr. 2001;138(3):373–377. |
Supplementary materials
 | Table S1 Summary of CSF TNCC, cytology, and protein concentrations for all patients with normal MRI studies |
 | Table S2 Summary of CSF TNCC, cytology, protein concentration, and MRI findings for all patients with abnormal MRI studies |
 | Table S3 MRI findings for each total nucleated cell count group |
 | Table S4 Incidence of specific abnormal MRI characteristics for each total nucleated cell count group |
 | Table S5 MRI findings for each pleocytosis category |
 | Table S6 Incidence of specific abnormal MRI characteristics for each pleocytosis category |
 © 2014 The Author(s). This work is published and licensed by Dove Medical Press Limited. The
full terms of this license are available at https://www.dovepress.com/terms
and incorporate the Creative Commons Attribution
- Non Commercial (unported, 3.0) License.
By accessing the work you hereby accept the Terms. Non-commercial uses of the work are permitted
without any further permission from Dove Medical Press Limited, provided the work is properly
attributed. For permission for commercial use of this work, please see paragraphs 4.2 and 5 of our Terms.
© 2014 The Author(s). This work is published and licensed by Dove Medical Press Limited. The
full terms of this license are available at https://www.dovepress.com/terms
and incorporate the Creative Commons Attribution
- Non Commercial (unported, 3.0) License.
By accessing the work you hereby accept the Terms. Non-commercial uses of the work are permitted
without any further permission from Dove Medical Press Limited, provided the work is properly
attributed. For permission for commercial use of this work, please see paragraphs 4.2 and 5 of our Terms.