Back to Journals » ClinicoEconomics and Outcomes Research » Volume 11
Canadian Medication Cost Savings Associated with Combinatorial Pharmacogenomic Guidance for Psychiatric Medications
Authors Tanner JA ![]() , Brown LC
, Brown LC ![]() , Yu K
, Yu K ![]() , Li J
, Li J ![]() , Dechairo BM
, Dechairo BM
Received 3 August 2019
Accepted for publication 22 November 2019
Published 9 December 2019 Volume 2019:11 Pages 779—787
DOI https://doi.org/10.2147/CEOR.S224277
Checked for plagiarism Yes
Review by Single anonymous peer review
Peer reviewer comments 2
Editor who approved publication: Professor Samer Hamidi
Julie-Anne Tanner,1,2 Lisa C Brown,3 Kunbo Yu,3 James Li,3 Bryan M Dechairo4
1Neurogenetics Section, Campbell Family Mental Health Research Institute, Centre for Addiction and Mental Health, University of Toronto, Department of Psychiatry, Toronto, ON, Canada; 2Assurex Health Ltd., Toronto, ON, Canada; 3Assurex Health, Inc., Mason, OH, USA; 4Myriad Genetics, Inc., Salt Lake City, UT, USA
Correspondence: Julie-Anne Tanner
Neurogenetics Section, Campbell Family Mental Health Research Institute, Centre for Addiction and Mental Health, Department of Psychiatry, Assurex Health, Ltd., 250 College, Room R38, Toronto, ON M5T 1L8, Canada
Tel +1 416 813-2745
Email [email protected]
Objective: To estimate Canadian pharmacy cost savings associated with psychiatric medication prescribing that is guided by combinatorial pharmacogenomic testing in patients switching or augmenting their psychiatric medication.
Methods: Pharmacy claims data from a United States (US) pharmacy benefit manager were analyzed for 1662 patients who recently augmented or switched to a different antidepressant or antipsychotic medication and underwent combinatorial pharmacogenomic testing. Costs of prescription medications were translated to the Canadian healthcare system by matching drug names and doses using the Ontario Drug Benefit Formulary. One-year costs (2017 CAD) were compared between patients whose clinician prescribed antidepressants or antipsychotics that were consistent (congruent) or inconsistent (incongruent) with the combinatorial pharmacogenomic test recommendations.
Results: Patients whose psychiatric medication treatment was congruent with the combinatorial pharmacogenomic test report saved $1061 CAD per member per year (PMPY) on prescription medication costs relative to patients whose medications were incongruent with their test report (p<0.0001). For patients ages 99% matched at the therapeutic chapter.
Conclusions: Antidepressant and antipsychotic prescribing that was congruent with combinatorial pharmacogenomic test guidance was associated with significant cost savings on Canadian prescription medications according to the Ontario Drug Benefit Formulary.
Keywords: pharmacogenomics, genetic test, genesight, psychiatry, mental health, prescription, pharmacy spend
Introduction
Mental illness is a leading burden of disease globally. As the most common mental illness, depression impacts more than 300 million people worldwide.1 Depression is a top contributor to non-fatal health loss globally and is a risk factor for other chronic illnesses, including heart disease, arthritis, asthma, back pain, chronic bronchitis, hypertension, migraines, and diabetes.1–3 The United States (US) and Canada have a similar prevalence of depression (approximately 8–9%) and frequency of antidepressant use; antidepressants are the third most commonly prescribed drug class in physician offices in the US and one of the top five prescription medications used in the 25–64 age group in Canada.4–6 Antipsychotics also are utilized frequently for patients with depression who have failed one or more antidepressants, and some are second-line treatment options, according to the Canadian Network for Mood and Anxiety Treatments.7
There is also a significant economic burden of mental illness, with depression and anxiety resulting in an estimated cost of $1 trillion to the global economy.1 In the US, the economic burden of major depressive disorder was more than $210 billion in 2010, and according to a 2016 report by the Conference Board of Canada’s Canadian Alliance for Sustainable Health Care, depression costs the Canadian economy more than $32 billion per year.7,8
The treatment of depression and other mental illness is challenging and often unsuccessful, necessitating more efficacious and cost-effective treatment strategies. For example, the traditional approach of prescribing medications through trial and error often leads to nonresponse, low remission rates, and adverse effects, with more than half of patients with depression who receive antidepressant therapy not responding to their first line of treatment.9 As the number of failed medication trials increases, the probability of a patient achieving response or remission decreases, highlighting the clinical importance of appropriate treatment selection early in the patient’s treatment process.10,11
One approach to improving the management of mental illness is pharmacogenomic testing. Several pharmacogenomic tests have been developed in which pharmacokinetic and/or pharmacodynamic genes are evaluated. The field of pharmacogenomics has evolved from first-generation testing of single cytochrome P450 genes to second-generation tests of multiple gene–drug interactions, and third-generation combinatorial tests weighting and counterbalancing the gene–drug interactions for multiple genetic variants. Third-generation combinatorial tests differ from single-gene panels in that they simultaneously weight the effects of multiple genetic interactions on a medication rather than reporting separately on single gene–drug interactions. Different commercial pharmacogenomic testing approaches, each of which evaluates unique groupings of drugs, genes, and variants, have been reviewed.11–13 Two recent meta-analyses concluded that evidence supports improved response and remission rates when depression treatment is guided by pharmacogenomic testing compared with treatment as usual.14,15 Specifically, the use of third-generation combinatorial pharmacogenomic testing to guide medication selection is associated with decreased depressive symptoms and improved response and remission rates compared with treatment as usual.16–19 The utility of this combinatorial pharmacogenomic testing approach also has been demonstrated in Canada through the large naturalistic IMPACT study, wherein all patients received testing, and outcomes significantly improved over 8–12 weeks, especially when treated in the primary care setting.20
In the US, combinatorial pharmacogenomic testing to guide depression treatment has been associated with reimbursement savings, reduced polypharmacy and healthcare utilization, and it is cost-effective in patients with treatment-resistant depression.21–26 In a 2015 study conducted in the US, patients with psychiatric disorders including depression, who had combinatorial pharmacogenomic testing, saved more than $1000 USD in annual drug spend following testing, compared with patients undergoing treatment as usual.23 In the same study, patients whose medications were consistent (congruent) with the recommendations of their combinatorial pharmacogenomic test report saved more than $2700 USD per member per year (PMPY) on total medication costs, compared with patients taking medications that were not consistent (incongruent) with their report. When savings were assessed according to healthcare provider type, patients whose medications were consistent with their test report saved $3988, $1308, and $2296 USD PMPY, respectively, when treated by primary care providers, psychiatrists, and obstetrician/gynecologists.24
Although there is a body of evidence describing the economic utility of combinatorial pharmacogenomic testing in the US, to date there are no economic, cost savings, or cost-effectiveness studies of combinatorial pharmacogenomic testing in Canada. Furthermore, approved medications and the costs of medications differ between Canada and the US. We hypothesized that prescription medication cost savings in Canada would be higher among patients whose clinicians’ prescription decisions were consistent with the guidance of a prospective combinatorial pharmacogenomic test compared with patients whose clinicians were not consistent with test guidance. To evaluate the magnitude of potential savings in Canada, we applied the Ontario Drug Benefit Formulary to the pharmacy claims from the previously published US pharmacy benefits utilization study, and compared medication costs between patients whose medications were consistent versus inconsistent with their pharmacogenomic test report.23
Methods
Study Design and Population
Pharmacy claims data from a US pharmacy benefit manager, Medco Health Solutions (Franklin Lakes, NJ, US), were prospectively analyzed for a subset of patients with a psychiatric diagnosis. A detailed description of the original Medco study and study population has been described and published previously.23 In brief, the study population consisted of patients who had newly started an antidepressant or antipsychotic medication, or who had augmented or switched their antidepressant or antipsychotic medication within the last 90 days. Using data from the Medco database, claims and costs of prescription medications were assessed for the 180 days before and the 365 days after testing in order to determine cost savings PMPY. The 180-day pre-test period costs were annualized for comparison with the 365-day post-test period costs. The analyses described in this manuscript were performed using de-identified, aggregated data. Therefore, this study did not require Institutional Review Board or ethics committee approval. Data supporting the findings of this study are available on request from the corresponding author [JAT]. The data are not publicly available due to their containing information that could compromise the privacy of research participants.
In the original study, case patients underwent GeneSight® Psychotropic combinatorial pharmacogenomic testing (Assurex Health Inc., Mason, OH, US) and were propensity-matched 1:5 with patients from the Medco database who received treatment as usual (TAU) without combinatorial pharmacogenomic testing.23 However, the current study was limited to patients who received combinatorial pharmacogenomic testing, since the pharmacy claims data from the TAU arm were not available for additional analyses beyond the original study. As such, costs were compared between patients whose medications were congruent or incongruent with their combinatorial pharmacogenomic test report recommendations. The pharmacogenomic testing approach and congruence are described in the next section.
Combinatorial Pharmacogenomic Testing
The GeneSight® Psychotropic test is a combinatorial pharmacogenomic test that integrated the genotyping results for several pharmacokinetic and pharmacodynamics genes (CYP2D6, CYP2C19, CYP2C9, CYP1A2, SLC6A4, HTR2A) and the pharmacological profile of 26 antidepressant and antipsychotic medications into an interpretive report using a clinically validated combinatorial pharmacogenomic algorithm. Based on the severity of gene–drug interactions, medications were assigned to one of the three categories: “use as directed” (green), “use with caution” (yellow), and “use with increased caution and more frequent monitoring” (red). The components used to determine gene–drug interactions in the combinatorial pharmacogenomic algorithm included: FDA approved drug labels, published literature, patents, and proprietary research. The test is based on licensed technology disclosed in issued patents (US patent no. 8,401,801 and US patent no. 8,688,385). Detailed information on the combinatorial pharmacogenomic test, including genes, genetic variants, and medications tested, has been reported previously,16,23 and also is provided on the combinatorial pharmacogenomic test report.
Congruence with the test report was achieved when the patient’s most severely categorized medication during the last 90 days of the post-test period was categorized in the green (“use as directed”) or yellow (“use with caution”) bins of their test report. Patients were included in the incongruent group when one or more of their medications during the last 90 days were classified in the red bin (“use with increased caution and more frequent monitoring”) of their test report. This is in line with the US study.23
Prescription Medication Cost Translation
Prescription drug names and dose strengths from the US were matched to those in Ontario, Canada using the Ministry of Health and Long-Term Care (MOHLTC) Ontario Drug Benefit (ODB) Formulary. Matching was conducted as follows: if the US drug name and dose strength could be found in the Canadian Formulary, the Formulary price was used. However, when only the drug name matched, the price was imputed by multiplying the US drug price by the ratio of Canadian drug unit price to the US drug unit price. When the drug name also did not match, the price was imputed by multiplying the US drug price by the average therapeutic chapter drug unit cost ratio. When the drug therapeutic chapter did not match or was missing, the price was calculated by multiplying the US drug price by the average overall drug unit cost ratio. This process is depicted in Supplementary Figure 1.
For brand drugs, the Formulary price was used if both drug name and dose strength matched; the mean generic drug cost was used if only the drug name matched. If only the drug name matched and no generic drug was found in the US study, the mean of the Canadian Formulary prices for that drug was used, but otherwise, the above approach of average drug, chapter, or ratio was used. All costs have been reported in 2017 Canadian dollars (CAD).
Statistical Analyses
The analyses described here were pre-planned. Demographics and descriptive statistics were determined for the full cohort of patients receiving combinatorial pharmacogenomic testing, and according to congruence with the combinatorial pharmacogenomic test. Prescription drug cost savings were evaluated according to congruence, patient age (<65, ≥65 years), and medication therapeutic chapter [(all medications), central nervous system (CNS) chapter medications, and non-CNS medications (all other therapeutic chapters)]. Total medication cost was not normally distributed, violating the T-test assumption of normality; therefore, the prescription medication cost difference between the congruent and incongruent groups was analyzed using the non-parametric Wilcoxon test. For the analysis of covariance, total medication cost was log-transformed for modeling and the estimated cost for each group was back-transformed to dollars for cost-saving calculation. In this analysis, the explanatory variables included congruent group, age, gender, pre-period total medication fills, pre-period total CNS medication fills, and pre-period total medication cost (log). Furthermore, the total medication cost PMPY was compared using a propensity score-matched cohort to remove the potential impact of confounders. Using Proc Match (SAS 9.4) and applying the same matching criteria as in Winner et al (2015), age, gender, diagnoses, and drug class, 352 subjects in the incongruent group were matched with 989 subjects in the congruent group. The matching statistics are summarized in Supplementary Table 2. All analyses were conducted using SAS 9.4 and JMP 13, and p-values ≤0.05 were considered significant.
Results
Demographics
A total of 1662 patients who were taking medications on the combinatorial pharmacogenomic test panel were included in this analysis. 506 patients who were not taking medications on the combinatorial pharmacogenomic panel during the year post-testing were excluded. 1301 (78.3%) patients were taking congruent medications during the last 90 days of the 365-day post-test period (ie, at follow-up), compared with 361 (21.7%) patients who were taking incongruent medications (Table 1). Of the full cohort, 30.7% of patients were male. There was no difference in the proportion of male/female patients whose medications were congruent or incongruent with the combinatorial pharmacogenomic test at follow-up (p=0.680; Table 1). The mean age of the cohort was 53.3 years, and 76.8% of patients were younger than 65 years. Patients who were taking congruent medications at follow-up were younger than those taking incongruent medications, with mean ages of 52.6 and 55.6 years, respectively (p=0.003; Table 1). The study consisted of patients with the following psychiatric diagnoses: 27.6% major depressive disorder, 19.1% generalized anxiety disorder, 5.4% bipolar disorder, and 66.4% with non-mental health diagnoses or no available diagnostic code (Table 1). For more information on the patient population, refer to the original study.23
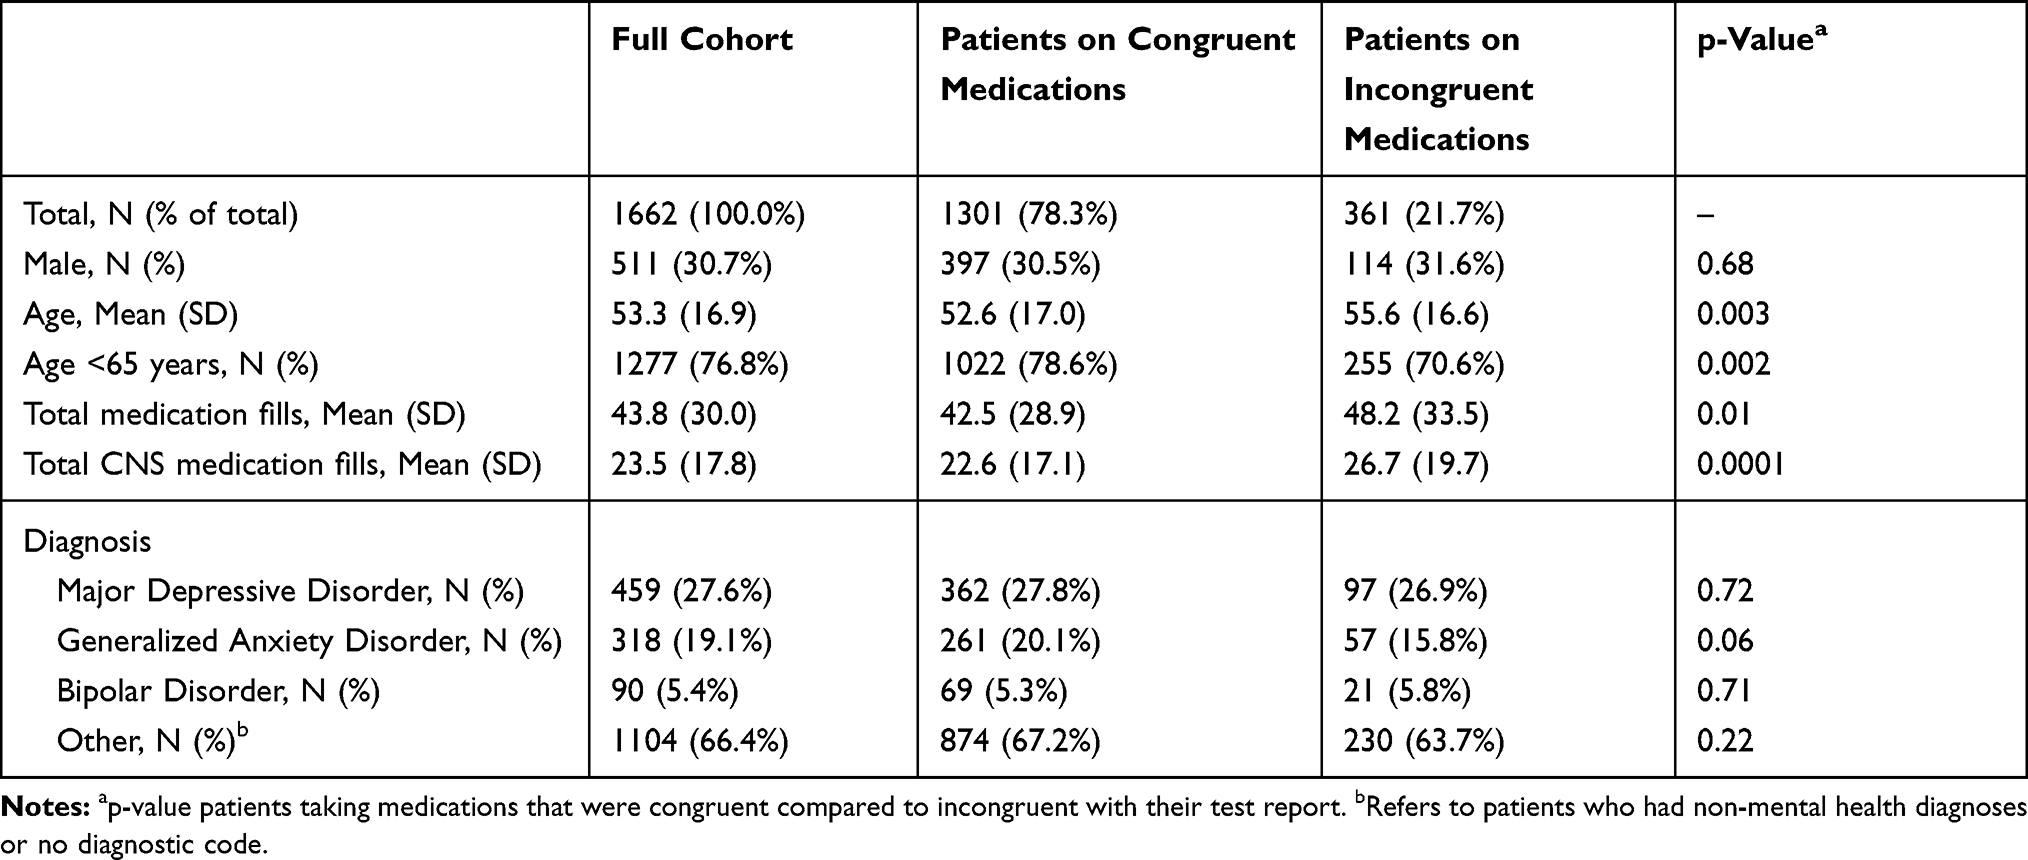 |
Table 1 Demographics of the Patient Sample, Based on Congruence with the Combinatorial Pharmacogenomic Test at Follow-Up |
Concordance and Availability of Medications in the Ontario Formulary
When matching prescription drugs from the previously published US study to the ODB Formulary, 62.3% (102,996/165,394) of prescription drug refills were matched at both the drug name and dose strength, and 81.3% (134,396/165,394) of prescription drug refills were matched at the drug name.23 For the generic drugs, 68.2% (85,539/125,465) of prescription drug refills were matched at both the drug name and dose strength, and 85.2% (106,934/125,465) of prescription drug refills were matched at the drug name. For brand drugs, 43.7% (17,457/39,929) of prescription drug refills were matched at drug name and strength, and 68.8% (27,462/39,929) were matched at the drug name. 93.8% (15/16) of the therapeutic chapters were matched, and 18.6% (30,841/165,394) of prescription refills were matched at only the therapeutic chapter level. Less than 0.1% (157/165,394) of prescription drug refills were not matched at the therapeutic chapter level (Supplementary Table 1).
Prescription Medication Cost Savings
In the overall cohort, patients whose medication treatment was congruent with the combinatorial pharmacogenomic test report saved $1061 CAD PMPY on prescription medication costs relative to patients whose treatment was incongruent with the report recommendations (p<0.0001; Figure 1A). When adjusting for age, gender, pre-period total number of medication refills, pre-period total number of CNS medication refills, and pre-period total medication cost (log), the congruent group saved $726 more than the incongruent group (p=0.0078). When matching on age, gender, diagnoses, and drug class and comparing total medication costs PMPY post-testing between congruent and incongruent groups, the incongruent group spent $5278 (n=352) on total medications, while the congruent group spent $4512 (n=989), resulting in a cost difference of $766 (p=0.017). When separated by therapeutic drug chapter, patients in the congruent group saved $213 CAD PMPY on CNS medications compared with patients in the incongruent group (p<0.0001; Figure 1B), and cost savings were $847 CAD PMPY for non-CNS medications among the congruent versus incongruent groups of patients (p<0.008; Figure 1C). Similar patterns were observed when splitting by age subgroup; for patients ages <65 and ≥65 whose medications were congruent with the combinatorial pharmacogenomic test report, prescription medication costs were $979 and $1178 CAD PMPY lower, respectively, relative to patients who did not follow the report recommendations (p=0.0004 and p=0.13, respectively; Figure 2A). In congruent versus incongruent groups, patients aged 65 and older saved more than double on CNS medication costs compared with patients younger than 65 ($387 versus $171 CAD PMPY; Figure 2B). With regard to non-CNS medications, cost savings were slightly higher in the younger group of patients ($808 versus $791 CAD PMPY; Figure 2C). In the overall cohort, the therapeutic chapters associated with the greatest cost savings were antineoplastic, diabetes, and CNS medications (Supplementary Figure 2A). Among patients ages 65 and older, allergy and rheumatology medications were also among the chapters with the highest cost savings, whereas medications for diabetes were not (Supplementary Figure 2B).
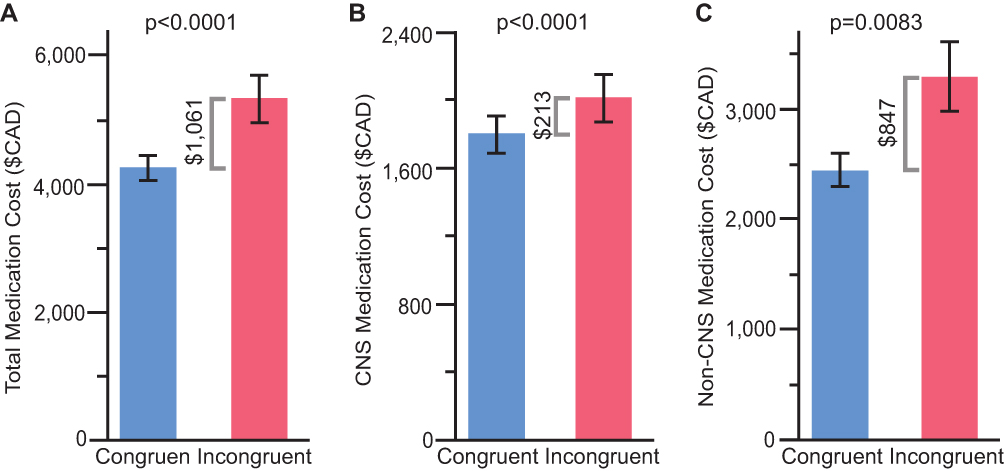 |
Figure 1 Annual medication costs with patients stratified by congruence with combinatorial pharmacogenomic test report recommendations. (A) Total medication costs. (B) CNS medication costs. (C) Non-CNS medication costs. |
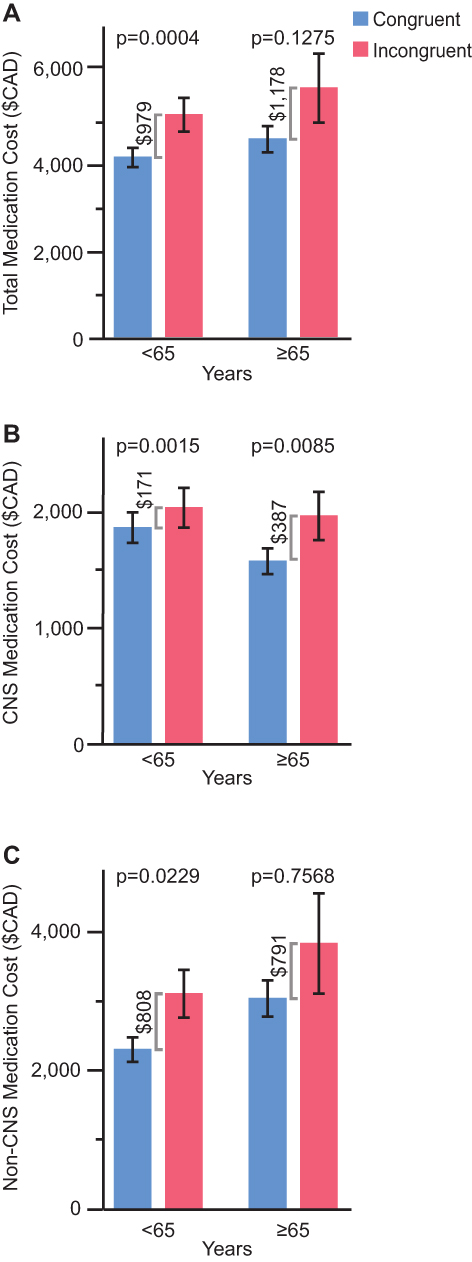 |
Figure 2 Annual medication costs according to patient age group (<65 and ≥65 years) and stratified by congruence with combinatorial pharmacogenomic test report recommendations. (A) Total medication costs. (B) CNS medication costs. (C) Non-CNS medication costs. |
Discussion
Significant cost savings were demonstrated among patients whose prescription medications were congruent, compared with incongruent, with the combinatorial pharmacogenomic test ($1061 CAD) at follow-up. The greatest absolute cost savings were realized among the patients 65 and older whose medications were congruent with their combinatorial pharmacogenomic report. This is an important population, considering the already high medication cost burden on this age group due to greater polypharmacy compared with younger age groups. Despite being only 15% of the Canadian population, the 65 and older age group accounts for approximately 40% of all prescription drug spending and 60% of spending from the public drug program.27 In the current study, this subgroup of patients had double the CNS medication cost savings compared with the younger than 65 subgroup ($387 versus $171 PMPY), whereas the younger cohort saved slightly more on non-CNS medications ($791 versus $808 PMPY). Additionally, patients in the ≥65 age group saved costs on antineoplastic and rheumatology medications when their antidepressant and/or antipsychotic medications were congruent with the test report. Patients in the <65 age group saved the most money on CNS, diabetes, and antineoplastic medications. Although cost savings were realized for the CNS class of medications, patients in both age groups had the greatest cost savings from non-CNS medications. This may be a byproduct of improvement in patients’ psychiatric condition, as patients with depression are often comorbid for other chronic non-psychiatric illnesses.2,3 Pharmacogenomic testing also may result in greater patient education, involvement in their healthcare, and treatment compliance.28
Annual medication cost savings according to the Canadian Formulary were lower than what was observed in the original US study. This may be due to the conservative method of imputation used to determine Canadian medication costs. Additionally, medication costs are higher in the US than in Canada; in 2016, prescription drug costs per person were 41% higher in the US than in Canada, $1174 USD versus $833 USD, respectively.29 Despite overall medication cost savings due to congruence with pharmacogenomic testing being lower than the US, we have demonstrated significant Canadian medication cost savings associated with combinatorial pharmacogenomic testing congruence, which should lessen the economic burden of depression on patients with this illness as well as the burden on public drug programs. Of note, the medication savings demonstrated here are PMPY; therefore, if a patient continues on an effective course of treatment for a longer term, medication cost savings may be greater. Future long-term evaluations can assess the durability of the cost savings associated with pharmacogenomic testing.
There were several limitations to the current study. As mentioned, the matching and imputation approach used in this study was conservative, which may have resulted in an underestimation of the Canadian drug cost. For example, when the drug name and dose from the original US study did not match with the Canadian Formulary, the average cost for that therapeutic drug chapter was applied. However, drugs matched by name more than 80% of the time. In addition, this study was limited by the data that were available in the Canadian Formulary at the time that the analyses were performed. As the matching with the Canadian Formulary occurred in 2017, and all pharmacy claims analyzed in the original study occurred between September 2011 and December 2013, some medications may no longer have been present in the Canadian Formulary, or the costs of drugs may have changed. Furthermore, we determined congruence based on the 90-day period before the end of the one-year study period. Although we have not captured congruence throughout the full study period, this would affect both the congruent and incongruent arms of the study. Therefore, where the aim of this study was to compare costs between the congruent and incongruent groups, this is not expected to have a significant impact on the cost differences between groups. Taking these limitations into consideration, there is potential for even greater Canadian cost savings associated with congruent medication use than is reported here. Finally, the current study was limited to medication cost savings associated with combinatorial pharmacogenomic testing. However, savings in overall healthcare spending are projected to be significantly higher; according to a US study, patients taking medications incongruent with their pharmacogenomic test report saved more than $5000 USD compared with patients whose medications were consistent with the report recommendations.23 As described in the Methods, these data were translated from US pharmacy costs; therefore, no data from Canadian patients were included in the analyses. As such, the results are an estimate. Future studies in Canada should add to the current study and quantify overall healthcare utilization and cost savings associated with combinatorial pharmacogenomic testing, including cost-utility analyses to demonstrate the ratio between the cost of this intervention and the benefit it produces.
Conclusion
Patients who followed the guidance of combinatorial pharmacogenomic testing in taking antidepressants or antipsychotics saved $1061 CAD PMPY on total prescription medication costs compared with patients whose medications were not congruent with the test guidance. These cost savings were reflected across several medication therapeutic chapters and patient age groups. These findings provide indirect evidence of the economic utility of combinatorial pharmacogenomic testing to guide the pharmacological treatment of psychiatric disorders in the Canadian healthcare system.
Data Availability
This study included a secondary analysis of previously published data. Please refer to Winner et al 2015 for information on data access.
Acknowledgements
The authors thank all study participants and Danielle Fanslow, PhD, for her assistance with manuscript preparation.
Author Contributions
LC Brown, J Li, and BM Dechairo contributed to the design and implementation of the study. JA Tanner, LC Brown, K Yu, J Li, and BM Dechairo contributed to the analysis and interpretation of the data, writing and revising the manuscript, final approval of the manuscript for publication, and are accountable for all aspects of the work in ensuring that questions related to the accuracy or integrity of any part of the work are appropriately investigated and resolved.
Disclosure
JA Tanner was employed by Assurex Health Ltd. at the time of this study. LC Brown, K Yu, and J Li were employed by Assurex Health, Inc., now Myriad Neuroscience, at the time of this study and received stock as part of their compensation. BM Dechairo was employed by Myriad Genetics, Inc. at the time of this study and received stock as part of his compensation. The authors report no other conflicts of interest in this work.
References
1. World Health Organization. Depression and Other Common Mental Disorders: Global Health Estimates. Geneva: World Health Organization; 2017.
2. Patten SB, Williams JV, Lavorato DH, Modgill G, Jette N, Eliasziw M. Major depression as a risk factor for chronic disease incidence: longitudinal analyses in a general population cohort. Gen Hosp Psychiatry. 2008;30(5):407–413. doi:10.1016/j.genhosppsych.2008.05.001
3. Rotella F, Mannucci E. Depression as a risk factor for diabetes: a meta-analysis of longitudinal studies. J Clin Psychiatry. 2013;74(1):31–37. doi:10.4088/JCP.12r07922
4. Rotermann M, Sanmartin C, Hennessy D, Arthur M. Prescription medication use by Canadians aged 6 to 79. Health Rep. 2014;25(6):3–9.
5. Prevention CfDCa. National Ambulatory Medical Care Survey: 2015 State and National Summary Tables. U.S. Department of Health and Human Services. Available from: https://www.cdc.gov/nchs/data/ahcd/namcs_summary/2015_namcs_web_tables.pdf.
6. Vasiliadis HM, Lesage A, Adair C, Wang PS, Kessler RC. Do Canada and the United States differ in prevalence of depression and utilization of services? Psychiatr Serv. 2007;58(1):63–71. doi:10.1176/ps.2007.58.1.63
7. Kennedy SH, Lam RW, McIntyre RS, et al. Canadian Network for Mood and Anxiety Treatments (CANMAT) 2016 clinical guidelines for the management of adults with major depressive disorder: section 3. Pharmacological treatments. Can J Psychiatry. 2016;61(9):540–560. doi:10.1177/0706743716659417
8. Canada CBo. Healthy Brains at Work: estimating the Impact of Workplace Mental Health Benefits and Programs. Available from: https://www.conferenceboard.ca/e-library/abstract.aspx?did=8242.
9. Greenberg PE, Fournier AA, Sisitsky T, Pike CT, Kessler RC. The economic burden of adults with major depressive disorder in the United States (2005 and 2010). J Clin Psychiatry. 2015;76(2):155–162. doi:10.4088/JCP.14m09298
10. Rush AJ, Trivedi MH, Wisniewski SR, et al. Acute and longer-term outcomes in depressed outpatients requiring one or several treatment steps: a STAR*D report. Am J Psychiatry. 2006;163(11):1905–1917. doi:10.1176/ajp.2006.163.11.1905
11. Warden D, Rush AJ, Trivedi MH, Fava M, Wisniewski SR. The STAR*D Project results: a comprehensive review of findings. Curr Psychiatry Rep. 2007;9(6):449–459. doi:10.1007/s11920-007-0061-3
12. Bousman CA, Jaksa P, Pantelis C. Systematic evaluation of commercial pharmacogenetic testing in psychiatry: a focus on CYP2D6 and CYP2C19 allele coverage and results reporting. Pharmacogenet Genomics. 2017;27(11):387–393. doi:10.1097/FPC.0000000000000]303
13. Rosenblat JD, Lee Y, McIntyre RS. Does Pharmacogenomic testing improve clinical outcomes for major depressive disorder? A systematic review of clinical trials and cost-effectiveness studies. J Clin Psychiatry. 2017;78(6):720–729. doi:10.4088/JCP.15r10583
14. Bousman CA, Dunlop BW. Genotype, phenotype, and medication recommendation agreement among commercial pharmacogenetic-based decision support tools. Pharmacogenomics J. 2018;18(5):613–622. doi:10.1038/s41397-018-0027-3
15. Rosenblat JD, Lee Y, McIntyre RS. The effect of pharmacogenomic testing on response and remission rates in the acute treatment of major depressive disorder: A meta-analysis. J Affect Disord. 2018;241:484–491. doi:10.1016/j.jad.2018.08.056
16. Bousman CA, Arandjelovic K, Mancuso SG, Eyre HA, Dunlop BW. Pharmacogenetic tests and depressive symptom remission: a meta-analysis of randomized controlled trials. Pharmacogenomics. 2019;20(1):37–47. doi:10.2217/pgs-2018-0142
17. Hall-Flavin DK, Winner JG, Allen JD, et al. Utility of integrated pharmacogenomic testing to support the treatment of major depressive disorder in a psychiatric outpatient setting. Pharmacogenet Genomics. 2013;23(10):535–548. doi:10.1097/FPC.0b013e3283649b9a
18. Hall-Flavin DK, Winner JG, Allen JD, et al. Using a pharmacogenomic algorithm to guide the treatment of depression. Transl Psychiatry. 2012;2:e172.
19. Winner JG, Carhart JM, Altar CA, Allen JD, Dechairo BM. A prospective, randomized, double-blind study assessing the clinical impact of integrated pharmacogenomic testing for major depressive disorder. Discov Med. 2013;16(89):219–227.
20. Greden JF, Parikh SV, Rothschild AJ, et al. Combinatorial pharmacogenomic testing improves outcomes in major depression. Am J Psychiatry. 2018. (Submitted).
21. Tanner JA, Davies PE, Voudouris NC, et al. Combinatorial pharmacogenomics and improved patient outcomes in depression: treatment by primary care physicians or psychiatrists. J Psychiatr Res. 2018;104:157–162. doi:10.1016/j.jpsychires.2018.07.012
22. Hornberger J, Li Q, Quinn B. Cost-effectiveness of combinatorial pharmacogenomic testing for treatment-resistant major depressive disorder patients. Am J Manag Care. 2015;21(6):e357–365.
23. Winner J, Allen JD, Altar CA, Spahic-Mihajlovic A. Psychiatric pharmacogenomics predicts health resource utilization of outpatients with anxiety and depression. Transl Psychiatry. 2013;3:e242. doi:10.1038/tp.2013.2
24. Winner JG, Carhart JM, Altar CA, et al. Combinatorial pharmacogenomic guidance for psychiatric medications reduces overall pharmacy costs in a 1 year prospective evaluation. Curr Med Res Opin. 2015;31(9):1633–1643. doi:10.1185/03007995.2015.1063483
25. Brown LC, Lorenz RA, Li J, Dechairo BM. Economic utility: combinatorial pharmacogenomics and medication cost savings for mental health care in a primary care setting. Clin Ther. 2017;39(3):592–602.e591. doi:10.1016/j.clinthera.2017.01.022
26. Benitez J, Cool CL, Scotti DJ. Use of combinatorial pharmacogenomic guidance in treating psychiatric disorders. Per Med. 2018;15(6):481–494. doi:10.2217/pme-2018-0074
27. Canadian Institute for Health Information. Drug use among seniors on public drug programs in Canada. Ottawa, ON: CIHI2014. 2012
28. Grenard JL, Munjas BA, Adams JL, et al. Depression and medication adherence in the treatment of chronic diseases in the United States: a meta-analysis. J Gen Intern Med. 2011;26(10):1175–1182. doi:10.1007/s11606-011-1704-y
29. Organisation for Economic Co-operation and Development. Pharmaceutical spending (indicator); 2018. Available from: https://data.oecd.org/healthres/pharmaceutical-spending.htm.
 © 2019 The Author(s). This work is published and licensed by Dove Medical Press Limited. The
full terms of this license are available at https://www.dovepress.com/terms
and incorporate the Creative Commons Attribution
- Non Commercial (unported, 3.0) License.
By accessing the work you hereby accept the Terms. Non-commercial uses of the work are permitted
without any further permission from Dove Medical Press Limited, provided the work is properly
attributed. For permission for commercial use of this work, please see paragraphs 4.2 and 5 of our Terms.
© 2019 The Author(s). This work is published and licensed by Dove Medical Press Limited. The
full terms of this license are available at https://www.dovepress.com/terms
and incorporate the Creative Commons Attribution
- Non Commercial (unported, 3.0) License.
By accessing the work you hereby accept the Terms. Non-commercial uses of the work are permitted
without any further permission from Dove Medical Press Limited, provided the work is properly
attributed. For permission for commercial use of this work, please see paragraphs 4.2 and 5 of our Terms.