Back to Journals » Neuropsychiatric Disease and Treatment » Volume 10
Can low brain-derived neurotrophic factor levels be a marker of the presence of depression in obese women?
Authors Celik Guzel E, Bakkal E, Guzel S, Eroglu HE, Acar A, Kuçukyalcin V, Topcu B
Received 1 August 2014
Accepted for publication 1 September 2014
Published 5 November 2014 Volume 2014:10 Pages 2079—2086
DOI https://doi.org/10.2147/NDT.S72087
Checked for plagiarism Yes
Review by Single anonymous peer review
Peer reviewer comments 3
Editor who approved publication: Dr Roger Pinder
Eda Celik Guzel,1 Esra Bakkal,1 Savas Guzel,2 Hasan Emre Eroglu,3 Ayse Acar,2 Volkan Kuçukyalcin,2 Birol Topcu4
1Department of Family Physician, Faculty of Medicine, Namik Kemal University, Tekirdag, Turkey; 2Department of Biochemistry, Faculty of Medicine, Namik Kemal University, Tekirdag, Turkey; 3Faculty of Medicine, Namik Kemal University, Tekirdag, Turkey; 4Department of Biostatistics, Faculty of Medicine, Namik Kemal University, Tekirdag, Turkey
Objective: Depression is a common condition in obese women that can result in severe impairment of their physical and social functioning. A deficiency of brain-derived neurotrophic factor (BDNF) is involved in the mechanism of depression. The aim of this study is to investigate whether BDNF levels differ between obese female patients and healthy controls and whether BDNF levels alter with affective states in depressive obese women.
Methods: The study group included 40 obese, 40 preobese, and 40 normal weight women. BDNF levels were measured with an enzyme-linked immunosorbent assay in patient and control groups. For identifying the depression and anxiety status, Beck Depression/Anxiety Inventories were used; and for the evaluation of cognitive functions, the mini-mental state examination was used.
Results: BDNF levels were significantly lower in obese patients compared to the control group (P<0.01). BDNF levels were significantly lower in obese patients with depression compared to the obese patients without depression (P<0.05). The Beck Depression Inventory showed a negative correlation with BDNF (r=−0.044; P<0.01) and a positive correlation with the Beck Anxiety Inventory (r=0.643; P<0.001), vitamin B12 levels (r=0.023; P<0.001), and insulin levels (r=0.257; P<0.05) in obese patients. When receiver operating characteristic curve analysis was used to analyze the suitability of BDNF to identify depression in obese women, the area under the curve for BDNF, 0.756, was found to be significant (P=0.025). BDNF levels lower than 70.2 pg/mL were associated with a higher prevalence of depressive symptoms.
Conclusion: The results of our study suggest that the decrease in BDNF levels can be used as a marker for depression diagnosis in obese patients.
Keywords: obesity, brain-derived neurotrophic factor, comorbidity
Introduction
Obesity is a chronic illness characterized with an increase in the body adipose tissue, originating from the imbalance between consumed energy and expended energy.1 Obesity can cause numerous health problems itself, or can aggravate a comorbid health problem.2 Obese individuals are approximately 55% more likely to develop depression.3 Depression is one of the primary causes of disability, and its merciless impact can contribute fundamentally to the burden of metabolic disorders. Beyond decreasing quality of life and functioning, depressed mood imposes additional threats to obese people by canceling out the compliance to treatment and lifestyle changes, and increases the risk of complications.4
Brain-derived neurotrophic factor (BDNF) has a significant role in the homeostasis of body fluids and blood pressure.5 In addition to this, BDNF is one of the neurotrophic factors observed in the brain and various other tissues and has been suggested as a biomarker of depressive disorders.6 There are findings indicating that BDNF levels are decreased in the postmortem brain and blood of patients with depressive disorders and that antidepressant treatments increase BDNF levels; these support the neurotrophic hypothesis for the etiology of depression.7
Obesity is also accepted as a psychosomatic disorder, an illness caused by psychological factors.8 Castelnuovo-Tedesco and Schiebel reported that mild and moderate depression and personality disorders are seen frequently in obese patients, while severe psychopathologies including psychosis and severe neurosis are seen rarely.9 Neurohormonal activation, increased inflammatory response, and dysregulation of the hypothalamic–pituitary–adrenal axis (HPA) are the mechanisms observed in depressive patients.10 BDNF is a hormone that plays a role in the regulation of the HPA system.11
Folic acid and vitamin B12 deficiency prevalences are high in patients with psychiatric conditions such as depression and cognitive dysfunction disorders.12–14 Several trials have shown the efficacy of folic acid and vitamin B12 in the treatment of depression.15,16 Moreover, thyroid disorders are accompanied by an increased incidence of depression. For comparison, the prevalence of an overt and subclinical hypothyroidism in the adult population is 9% and 0.4%, respectively.17
In our literature review, we saw that the relationship between BDNF with obesity and depression with BDNF were investigated separately. However, we could not find a study investigating the relation of BDNF, obesity, and depression together. The aim of the current study is to investigate the relation of depression and BDNF levels in obese patients, and evaluate the clinical utility of this relationship.
Materials and methods
Subjects
The study population included 120 women (aged 18–60 years). The patients and the healthy subjects were recruited from the outpatient family medicine clinic of Namik Kemal University Hospital, Turkey between 2013 and 2014. The study was approved by the institutional review board of the hospital, and all participants signed informed consent forms. Subjects were divided into three groups: 40 women with a body mass index (BMI) ≤24.9 kg/m2 (control group), 40 preobese women with a BMI between 25 and 29.9 kg/m2, and 40 obese women with a BMI ≥30 kg/m2. The subjects were classified by the World Health Organization criteria.2 All of the women were free of hypertension and cardiovascular disease, had regular 28-day menstrual cycles, were in generally good health, did not consume antioxidant supplementations, did not smoke or abuse alcohol, and did not take any hormonal contraceptives or any other drug. The trial was approved by the ethical review board of Namik Kemal University.
Assessment instruments/questionnaires
The depression prevalence was assessed by Beck Depression Inventory (BDI), which was a 21-item self-reporting instrument intended to assess the existence and severity of symptoms of depression as listed in the American Psychiatric Association’s Diagnostic and Statistical Manual of Mental Disorders, Fourth Edition. Points from each of the 21 items corresponding to a symptom of depression were summed to give a single BDI score. A total score of 13 and below is classified as the absence of depression; a total score of 14 and above is classified as the presence of depression.18 Anxiety was assessed with the Beck Anxiety Inventory (BAI). BAI is a 21-item anxiety scale assessing symptoms during the past week on a four-point Likert scale. A total score of 7 or below is classified as the absence of anxiety, and a total score of 8 or above as the presence of anxiety.19 Evaluation of cognitive functions was performed with the mini-mental state examination (MMSE). This test gives a score between 0 and 30; a score of >24 indicates normal cognitive performance, and all scores below this cut-off value indicate a general cognitive impairment.20
Anthropometric measurements and body composition
BMI was calculated as weight (kg) divided by height squared (m2). Subjects with a BMI of ≥30 kg/m2 were considered obese. Body fat distribution was evaluated by the waist-to-hip ratio.
Biochemical tests
For hormonal and biochemical analyses, serum and plasma samples were collected between 8 am and 10 am, after an overnight fasting of at least 12 hours during the early follicular phase or on random days in subjects with all groups. Serum levels of insulin, free triiodothyronine (FT3), free thyroxine (FT4), thyroid-stimulating hormone (TSH), vitamin B12, and folic acid were determined by enzyme-linked immunosorbent assay (ELISA) (Cobas 411, Roche Diagnostics, Mannheim, Germany). Glucose, total cholesterol, high-density lipoprotein cholesterol, low-density lipoprotein cholesterol, triglycerides, and C-reactive protein (CRP) were measured by autoanalyzer using standard enzymatic methods (Cobas 311, Roche Diagnostics). Glycated hemoglobin (HbA1c) was measured by high-performance liquid chromatography (Variant II, Bio-Rad Laboratories, Munich, Germany). The degree of insulin resistance was determined by the homeostatic model assessment insulin resistance (HOMA-IR) using this formula:21
HOMA = fasting insulin (mU·L−1) × fasting glucose (mM)/22.5 | (1) |
BDNF levels were measured in blood drawn from 120 women in the morning, in the same laboratory, after an overnight fasting. The blood samples were immediately centrifuged and the serum samples were stored at −86°C until analysis. BDNF was measured in serum by using an ELISA kit (Chemikine™, EMD Millipore, Billerica, MA, USA). The intra- and interassay variabilities of the ELISA kit were 3.7% and 8.5%, respectively. The minimum detectable dose was 7.8 pg/mL.
Statistical analysis
The computerization of the data of our study and the statistical analyses were carried out by using PASW Statistics 18 for Windows package software. The conformity of the variables to normal range was controlled by Shapiro Wilk Test. One-way analysis of variance was used for the normal ranged group; Tukey’s test was used for subgroup comparisons. Student’s t-test was used for two-group comparison. The Kruskal–Wallis variance analysis and the Mann–Whitney U-test were used for the nonparametric data. Furthermore, in order to determine the relation between variables correlation, regression and receiver operating characteristic (ROC) analyses were used. A P-value of <0.05 was considered statistically significant. The results were calculated as mean ± standard deviation.
Results
Demographic, clinical, and biochemical data of the women studied are presented in Table 1. BMI and waist-to-hip ratio values were detected significantly higher in preobese (P<0.001 and P<0.01, respectively) and obese patients (P<0.001 and P<0.01, respectively) compared to control group. BMI values were significantly higher in obese patients compared to preobese patients (P<0.001). Glucose levels were significantly higher in obese patients compared to preobese patients (P<0.01). Insulin and HOMA-IR levels were significantly higher in obese (P<0.001 for both) and preobese (P<0.001 for both) subjects compared to control group. Glycated hemoglobin levels were significantly higher in obese women compared to control group (P<0.05). However, there was no significant difference compared to the preobese group (Table 1).
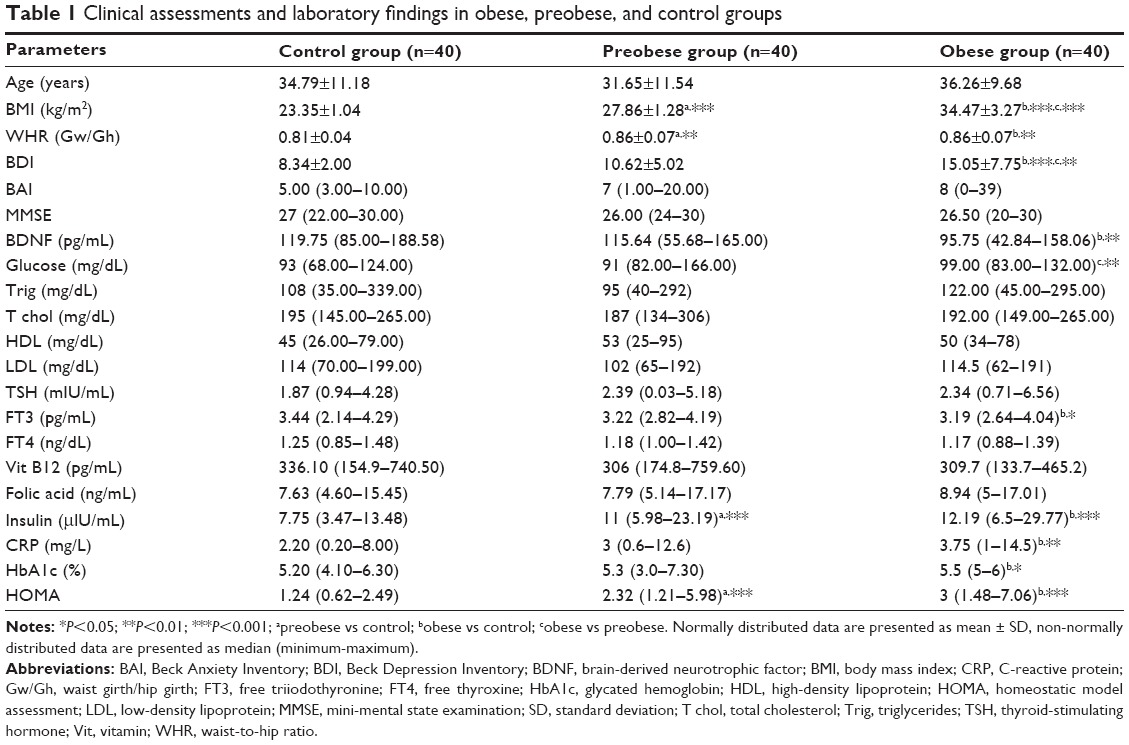 | Table 1 Clinical assessments and laboratory findings in obese, preobese, and control groups |
There was no significant difference between obese, preobese, and control groups in terms of lipid parameters (total cholesterol, triglyceride, high-density lipoprotein, and low-density lipoprotein), vitamin B12 levels, and folic acid levels. FT3 levels were significantly lower in obese women compared to the control group (P<0.05). However, there was no significant difference between the three groups in terms of TSH and FT4 levels. CRP levels were significantly higher in obese patients compared to the control group (P<0.01). However, there was no significant difference between the other groups (Table 1).
BDNF levels were significantly lower in obese patients compared to the control group (P<0.01). However, there was no significant difference between the obese and preobese group and the preobese and control group in terms of BDNF levels (Table 1).
BDI score was found to be significantly higher in obese patients, compared to the preobese and control groups (P<0.01 and P<0.001, respectively). There was no significant difference between the three groups in terms of BAI and MMSE scores (Table 1).
When we divided the obese patients into two groups with and without depression, BDNF and vitamin B12 levels were significantly lower in the obese depression group compared to the obese nondepression group (P<0.05 for both). Moreover, the average age of the obese depression group was significantly higher than the obese nondepression group (P<0.05). There was no significant difference between the two groups in terms of BMI, folic acid levels, and MMSE score in subgroup analysis (Table 2).
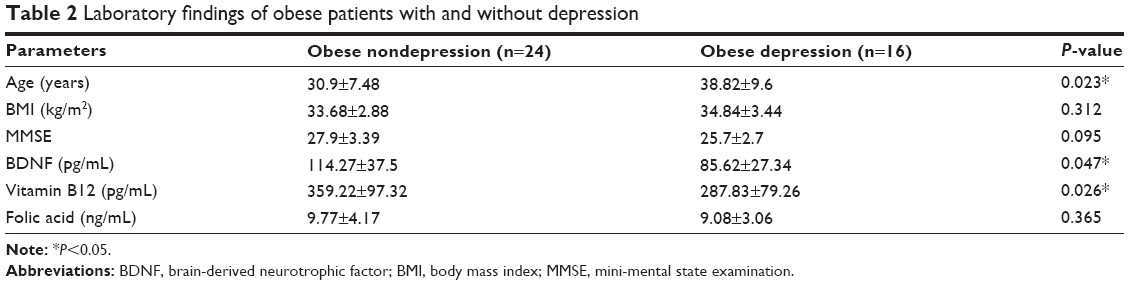 | Table 2 Laboratory findings of obese patients with and without depression |
The linear regression analyses showed that the BDI was negatively associated with the BDNF (r=−0.044; P<0.01) and MMSE (r=−1.219; P<0.001) and positively associated with BAI (r=0.643; P<0.001), FT4 (r=12.873; P<0.01), vitamin B12 (r=0.023; P<0.001), and insulin (r=0.257; P<0.05) in obese women (Table 3). The other linear regression model showed that BDI was negatively associated with the BDNF (r=−0.056; P<0.001), total cholesterol (r=−0.027; P<0.05), and TSH (r=−1.372; P=0.001) and positively associated with BAI (r=0.760; P<0.001), vitamin B12 (r=0.018; P<0.001), folic acid (r=1.072; P<0.001), and insulin (r=0.470; P<0.001) in preobese women (Table 4).
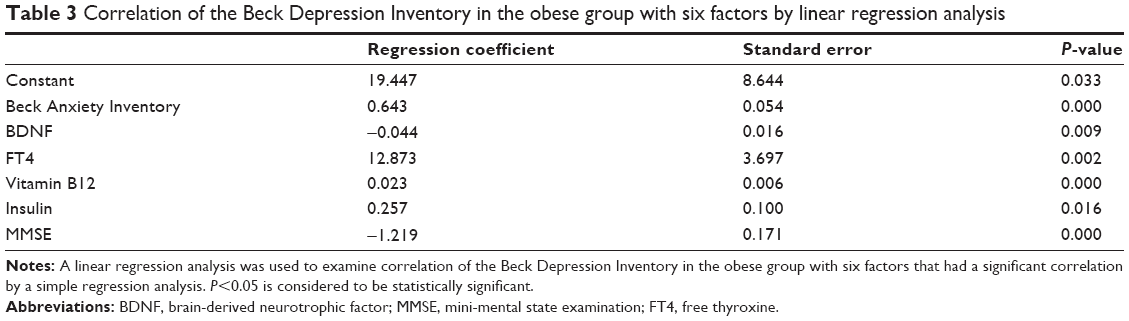 | Table 3 Correlation of the Beck Depression Inventory in the obese group with six factors by linear regression analysis |
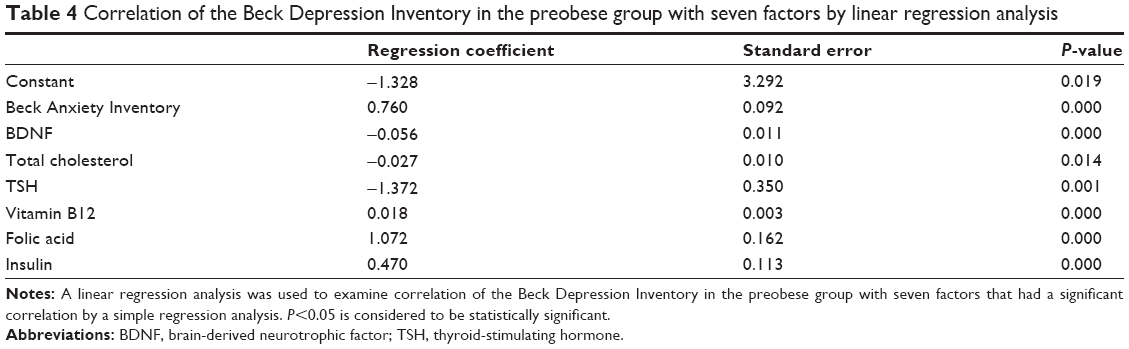 | Table 4 Correlation of the Beck Depression Inventory in the preobese group with seven factors by linear regression analysis |
When ROC curve analysis was used to analyze the suitability of BDNF to identify depression in obese women, the area under the curve for BDNF was found to be significant (0.756, P<0.05) (Table 5). The cut-off point for the prediction of intolerance was determined as 70.2 pg/mL. The sensitivity was 84% and specificity was 67% for BDNF at the mentioned cut-off point. The positive predictive value of BDNF for obese women was 75.61%.
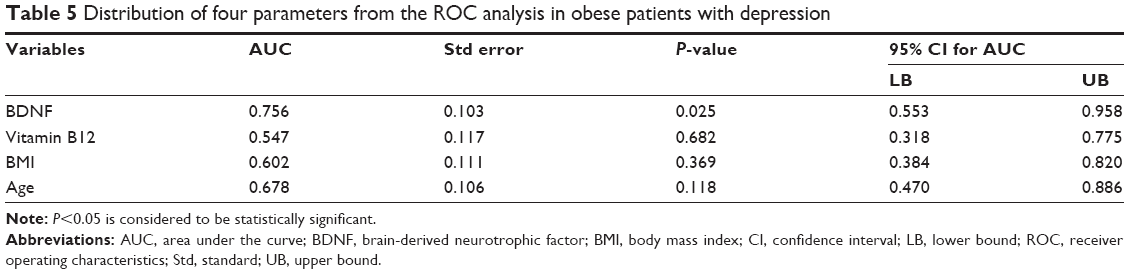 | Table 5 Distribution of four parameters from the ROC analysis in obese patients with depression |
Discussion
In recent years, obesity has been reported to be a chronical and progressive illness that reduces the physical activity of an individual, causes social and psychological problems, and detaches people from society.1,2 High levels of dysfunctional adipose tissue in obesity may not only cause or aggravate metabolic abnormalities that increase the risk of metabolic disease but also neurobiological impairments that increase the risk of mood disorders.22
In our study we found serum BDNF levels significantly lower in obese female patients compared to the control group. A negative relationship between plasma BDNF levels and obesity has been described in other studies.23–28 These results show that there is an inverse relationship between BDNF levels and BMI. One proposed mechanism for this is that fatty tissue contains natriuretic peptide clearance receptors in abundance, resulting in lower BDNF levels in obese patients who have larger amounts of fatty tissue.23,25 Despite this, more recent studies have demonstrated that the peripheral elimination of BDNF is decreased in obese individuals. As amino-terminal pro-brain natriuretic peptide is not based on natriuretic peptide clearance receptor activity or neutral endopeptidase degradation; the impaired synthesis and release of amino-terminal pro-brain natriuretic peptide and BDNF from cardiac myocytes in obese patients must have a role in the mechanisms underlying the decreased circulating levels of this peptide in humans with greater BMI values.29
Depression is seen frequently in obese patients that may result in severe impairment of their physical and social functioning. Depressive disorders are generally harnessed with risk factors for cardiovascular diseases as overweight, high blood pressure, and insulin resistance.30 Interestingly, lower values of atrial natriuretic peptide and BDNF may also contribute to these risk factors.31 Between 5.0% to 10.0% of the general population meet the criteria for the diagnosis of depression. A meta-analysis of longitudinal data shows obesity (BMI ≥30 kg/m2) to increase the overall risk of depression onset by 55% in Americans, while overweight (BMI 25–29.9 kg/m2) increases the incidence of depression by 27%.3 In a similar manner, an increasing amount of data indicates unhealthy diet, visceral adiposity, and related metabolic changes are culprits in obesity-induced depression.4 In our study, when we examined the presence of depression in obese patients, depression was detected in 40% of our patients. In the current study we found a significantly higher Beck Depression Inventory score in obese people compared to preobese and control patients. These results are consistent with the results of studies showing the presence of depression in obesity.32,33
The HPA axis is stimulated in depression and sympathetic activity increases, as well as the levels of circulating inflammatory cytokines; this potentially causes more intense clinical symptoms.34 Presumably, the lower levels of atrial natriuretic peptide and BDNF observed in depressive disorders show that the inhibitory effect on the HPA axis is decreased, and thus they contribute to the increase of corticotrophin-releasing hormone, arginine vasopressin, adrenocorticotrophic hormone, and cortisol levels.35 In the current study, when we examined the relation between BDNF and depression in obese patients, BDNF levels were found to be significantly lower in depressive patients compared to the patients without depression. Similar to the findings of our study, significantly lower BDNF levels are observed in patients with major depressive disorder compared to the control group.35 In contrast to our findings, in patients with heart failure, BDNF levels were reported to be higher in depressive patients compared to the patients without depression.36–38
On the other hand, in our linear regression model, BDI levels done in our study, a negative correlation was established between BDNF levels in obese and preobese groups (Table 3 and Table 4). These results support the fact that decreased BDNF level is an important risk factor for depression development.
Recent literature has defined links between vitamin deficiency and depression.13,14,39 In our study, there was no significant difference found in obese patients compared to preobese and control groups in terms of vitamin B12 levels (Table 1). However, vitamin B12 levels were significantly lower in the obese depression group compared to the obese nondepression group (Table 2). Similar to the findings of our study, lower vitamin B12 levels have been found to be linked with severe depression in clinical studies.13,14 These results show that vitamin B12 level is associated with depression rather than obesity.
In our study, we could also demonstrate obesity as the cause of depression. When BDNF levels and their relation to the incidence of severe depression were analyzed, we could verify a strong correlation between lower BDNF levels and a higher incidence of severe or very severe depression. Using the ROC curve, we identified that BDNF levels lower than 70.2 pg/mL were associated with a higher prevalence of depressive symptoms.
In our study, insulin and HOMA levels were significantly higher in the obese and preobese groups compared to the control group. There are some reports in the literature that indicate little or no association between metabolic syndrome/insulin resistance and depression.40,41 A recent systematic review and meta-analysis found a slight but significant cross-sectional relation between depression and insulin resistance.42 Furthermore, there was a positive correlation between BDI and insulin in the obese and preobese groups in our linear regression model. These results suggest that insulin resistance is present in obese people and that insulin levels contribute to the development of depression.
Obesity is characterized by a condition of prolonged low-grade inflammation, and extensive evidence shows immune-mediated tissue inflammation as an important factor associating obesity to insulin resistance. Similarly, several findings suggest immune activation in the pathogenesis of depression.43 Increased levels of inflammatory signals have been associated with the severity of depression.44 CRP level is one of the inflammation markers, and was found to be significantly higher in the obese group. Interestingly, the inflammatory marker CRP had the most consistent effect, accounting for 14%–53% of the relationship between anxiety and depression severity with abdominal obesity and dyslipidemia.45 In another study, men with low-grade inflammation, high CRP levels, and depressive symptoms were more likely to develop abdominal obesity throughout the 11-year follow-up.46 In our study, however, there was no relationship between depression inventory and CRP levels.
There are some limitations to our study. Our study is a cross-sectional study, and the sample size is relatively small. It is necessary to confirm the findings in a study with a larger sample. Moreover, serum BDNF levels were only measured in females, and these should be examined comparatively with males.
In conclusion, serum BDNF levels were significantly lower in obese women compared to the control group. BDNF levels were significantly lower in obese patients with depression compared to those without depression. Furthermore, BDNF levels were negatively correlated with depression in both obese and preobese subjects. Decreasing BDNF levels were detected to increase the frequency of depression in obese patients. Thus, these results suggest that decreased BDNF levels can be used as a marker for the diagnosis of depression in obese patients. This finding should be supported with further studies.
Disclosure
The authors report no conflicts of interest in this work.
References
Prevention and management of the global epidemic of obesity. Report of the WHO Consultation on Obesity. Geneva: 1997 June 3–5. | ||
Clinical guidelines on the identification, evaluation, and treatment of overweight and obesity in adults-the evidence report. Obes Res. 1998;6 Suppl 2:S51–S209. | ||
Luppino FS, de Wit LM, Bouvy PF, et al. Overweight, obesity, and depression: a systematic review and meta-analysis of longitudinal studies. Arch Gen Psychiatry. 2010;67(3):220–229. | ||
Simon GE, Von Korff M, Saunders K, et al. Association between obesity and psychiatric disorders in the US adult population. Arch Gen Psychiatry. 2006;63(7):824–830. | ||
Ramos LW, Murad N, Goto E, et al. Ischemia/reperfusion is an independent trigger for increasing myocardial content of mRNA B-type natriuretic peptide. Heart Vessels. 2009;24(6):454–459. | ||
Autry AE, Monteggia LM. Brain-derived neurotrophic factor and neuropsychiatric disorders. Pharmacol Rev. 2012;64(2):238–258. | ||
Lee BH, Kim YK. The roles of BDNF in the pathophysiology of major depression and in antidepressant treatment. Psychiatry Investig. 2010;7(4):231–235. | ||
Resch M, Haasz P, Sido Z. Obesity as psychosomatic disease. European Psychiatry. 1998;13 Suppl 4:S315. | ||
Castelnuovo-Tedesco P, Schiebel D. Studies of superobesity: I. Psychological characteristics of superobese patients. Int J Psychiatry Med. 1975;6(4):465–480. | ||
Wiedemann K, Jahn H, Kellner M. Effects of natriuretic peptides upon hypothalamo-pituitary-adrenocortical system activity and anxiety behaviour. Exp Clin Endocrinol Diabetes. 2000;108(1):5–13. | ||
Kellner M, Herzog L, Holsboer F, Wiedemann K. Circadian changes in the sensitivity of the corticotropin-releasing hormone-stimulated HPA system after arginine vasopressin and atrial natriuretic hormone in human male controls. Psychoneuroendocrinology. 1995;20(5):515–524. | ||
Reynolds EH. Folic acid, ageing, depression, and dementia. BMJ. 2002;324(7352):1512–1515. | ||
Bell IR, Edman JS, Morrow FD, et al. B complex vitamin patterns in geriatric and young adult inpatients with major depression. J Am Geriatr Soc. 1991;39(3):252–257. | ||
Mischoulon D, Burger JK, Spillmann MK, Worthington JJ, Fava M, Alpert JE. Anemia and macrocytosis in the prediction of serum folate and vitamin B12 status, and treatment outcome in major depression. J Psychosom Res. 2000;49(3):183–187. | ||
Almeida OP, Marsh K, Alfonso H, Flicker L, Davis TM, Hankey GJ. B-vitamins reduce the long-term risk of depression after stroke: The VITATOPS-DEP trial. Ann Neurol. 2010;68(4):503–510. | ||
Lazarou C, Kapsou M. The role of folic acid in prevention and treatment of depression: an overview of existing evidence and implications for practice. Complement Ther Clin Pract. 2010;16(3):161–166. | ||
Canaris GJ, Manowitz NR, Mayor G, Ridgway EC. The Colorado thyroid disease prevalence study. Arch Intern Med. 2000;160(4):526–534. | ||
Beck AT, Steer RA, Brown GK. BDI-II Beck Depression Inventory, 2nd edn. Swedish manual, Harcourt Assessment. Sandviken; 2008. | ||
Beck AT, Steer RA. Beck Anxiety Inventory manual. San Antonio (TX): Psychological Corporation, Harcourt Brace & Company;1993. | ||
Folstein MF, Folstein SE, McHugh PR. “Mini-mental state.” A practical method for grading the cognitive state of patients for the clinician. J Psychiatr Res. 1975;12(3):189–198. | ||
Matthews DR, Hosker JP, Rudenski AS, Naylor BA, Treacher DF, Turner RC. Homeostasis model assessment: insulin resistance and beta-cell function from fasting plasma. Diabetologia. 1985;28(7):412–419. | ||
van Reedt Dortland AK, Giltay EJ, van Veen T, Zitman FG, Penninx BW. Longitudinal relationship of depressive and anxiety symptoms with dyslipidemia and abdominal obesity. Psychosom Med. 2013;75(1):83–89. | ||
Wang TJ, Larson MG, Levy D, et al. Impact of obesity on plasma natriuretic peptide levels. Circulation. 2004;109(5):594–600. | ||
Koizumi M, Watanabe H, Kaneko Y, et al. Impact of obesity on plasma B-type natriuretic peptide levels in Japanese community-based subjects. Heart Vessels. 2012;27(3):287–294. | ||
Mehra MR, Uber PA, Park MH, et al. Obesity and suppressed B-type natriuretic peptide levels in heart failure. J Am Coll Cardiol. 2004;43(9):1590–1595. | ||
Bionda C, Bergerot C, Ardail D, Rodriguez-Lafrasse C, Rousson R. Plasma BNP and NT-proBNP assays by automated immunoanalyzers: analytical and clinical study. Ann Clin Lab Sci. 2006;36(3):299–306. | ||
Park SJ, Cho KI, Jung SJ, et al. N-terminal pro-B-type natriuretic Peptide in overweight and obese patients with and without diabetes: an analysis based on body mass index and left ventricular geometry. Korean Circ J.2009;39(12):538–544. | ||
Kim BH, Kim IJ, Cho KI, Kim SM, Lee HG, Kim TI. The influence of diabetes on the relationship between N-terminal pro-B-type natriuretic peptide and body mass index. J Int Med Res. 2010;38(5):1737–1748. | ||
Krauser DG, Lloyd-Jones DM, Chae CU, et al. Effect of body mass index on natriuretic peptide levels in patients with acute congestive heart failure: a ProBNP Investigation of Dyspnea in the Emergency Department (PRIDE) substudy. Am Heart J. 2005;149(4):744–750. | ||
Ahlberg AC, Ljung T, Rosmond R, et al. Depression and anxiety symptoms in relation to anthropometry and metabolism in men. Psychiatry Res. 2002;112(2):101–110. | ||
McCord J, Mundy BJ, Hudson MP, et al. Relationship between obesity and B-type natriuretic peptide levels. Arch Intern Med. 2004;164(20):2247–2252. | ||
Black DW, Goldstein RB, Mason EE. Prevalence of mental disorder in 88 morbidly obese bariatric clinic patients. Am J Psychiatry. 1992;149(2):227–234. | ||
Britz B, Siegfried W, Ziegler A, et al. Rates of psychiatric disorders in a clinical study group of adolescents with extreme obesity and in obese adolescents ascertained via a population based study. Int J Obes Relat Metab Disord. 2000;24(12):1707–1714. | ||
Ferketich AK, Ferguson JP, Binkley PF. Depressive symptoms and inflammation among heart failure patients. Am Heart J. 2005;150(1):132–136. | ||
Wisén AG, Ekberg K, Wohlfart B, Ekman R, Westrin A. Plasma ANP and BNP during exercise in patients with major depressive disorder and in healthy controls. J Affect Disord. 2011;129(1–3):371–375. | ||
Aguiar VB, Ochiai ME, Cardoso JN, et al. Relationship between depression, BNP levels and ventricular impairment in heart failure. Arq Bras Cardiol. 2010;95(6):732–737. | ||
Parissis JT, Farmakis D, Nikolaou M, et al. Plasma B-type natriuretic peptide and anti-inflammatory cytokine interleukin-10 levels predict adverse clinical outcome in chronic heart failure patients with depressive symptoms: a 1-year follow-up study. Eur J Heart Fail. 2009;11(10):967–972. | ||
Lesman-Leegte I, van Veldhuisen DJ, Hillege HL, Moser D, Sanderman R, Jaarsma T. Depressive symptoms and outcomes in patients with heart failure: data from the COACH study. Eur J Heart Fail. 2009;11(12):1202–1207. | ||
Tiemeier H, van Tuijl HR, Hofman A, Meijer J, Kiliaan AJ, Breteler MM. Vitamin B12, folate, and homocysteine in depression: the Rotterdam Study. Am J Psychiatry. 2002;159(12):2099–2101. | ||
Platt AM, Egan AM, Berquist MJ, Dreyer ML, Babar G, Ugrasbul F. Health-related quality of life, depression, and metabolic parameters in overweight insulin-resistant adolescents. J Pediatr Health Care. 2013;27(2):120–126. | ||
Shen Q, Bergquist-Beringer S. Relationship between major depression and insulin resistance: does it vary by gender or race/ethnicity among young adults aged 20–39 years? J Diabetes. 2013;5(4):471–481. | ||
Kan C, Silva N, Golden SH, et al. A systematic review and meta-analysis of the association between depression and insulin resistance. Diabetes Care. 2013;36(2):480–489. | ||
Dantzer R, O’Connor JC, Freund GG, Johnson RW, Kelley KW. From inflammation to sickness and depression: when the immune system subjugates the brain. Nat Rev Neurosci. 2008;9(1):46–56. | ||
Levine J, Barak Y, Chengappa KN, Rapoport A, Rebey M, Barak V. Cerebrospinal cytokine levels in patients with acute depression. Neuropsychobiology. 1999;40(4):171–176. | ||
van Reedt Dortland AK, Vreeburg SA, Giltay EJ, et al. The impact of stress systems and lifestyle on dyslipidemia and obesity in anxiety and depression. Psychoneuroendocrinology. 2013;38(2):209–218. | ||
Valtonen MK, Laaksonen DE, Laukkanen JA, et al. Low-grade inflammation and depressive symptoms as predictors of abdominal obesity. Scand J Public Health. 2012;40(7):674–680. |
 © 2014 The Author(s). This work is published and licensed by Dove Medical Press Limited. The
full terms of this license are available at https://www.dovepress.com/terms
and incorporate the Creative Commons Attribution
- Non Commercial (unported, 3.0) License.
By accessing the work you hereby accept the Terms. Non-commercial uses of the work are permitted
without any further permission from Dove Medical Press Limited, provided the work is properly
attributed. For permission for commercial use of this work, please see paragraphs 4.2 and 5 of our Terms.
© 2014 The Author(s). This work is published and licensed by Dove Medical Press Limited. The
full terms of this license are available at https://www.dovepress.com/terms
and incorporate the Creative Commons Attribution
- Non Commercial (unported, 3.0) License.
By accessing the work you hereby accept the Terms. Non-commercial uses of the work are permitted
without any further permission from Dove Medical Press Limited, provided the work is properly
attributed. For permission for commercial use of this work, please see paragraphs 4.2 and 5 of our Terms.