Back to Journals » Diabetes, Metabolic Syndrome and Obesity » Volume 13
Calcium and Phosphate Levels are Among Other Factors Associated with Metabolic Syndrome in Patients with Normal Weight
Authors Osadnik K, Osadnik T ![]() , Delijewski M
, Delijewski M ![]() , Lejawa M
, Lejawa M ![]() , Fronczek M, Reguła R, Gąsior M, Pawlas N
, Fronczek M, Reguła R, Gąsior M, Pawlas N ![]()
Received 26 September 2019
Accepted for publication 23 February 2020
Published 22 April 2020 Volume 2020:13 Pages 1281—1288
DOI https://doi.org/10.2147/DMSO.S232497
Checked for plagiarism Yes
Review by Single anonymous peer review
Peer reviewer comments 2
Editor who approved publication: Prof. Dr. Jing Sun
Kamila Osadnik,1 Tadeusz Osadnik,1,2 Marcin Delijewski,1 Mateusz Lejawa,1 Martyna Fronczek,3 Rafał Reguła,4 Mariusz Gąsior,4 Natalia Pawlas1
1Department of Pharmacology, Faculty of Medical Sciences in Zabrze, Medical University of Silesia, Katowice, Poland; 2 2nd Department of Cardiology and Angiology, Silesian Center for Heart Diseases, Zabrze, TO, Poland; 3Department of Medical and Molecular Biology, Faculty of Medical Sciences in Zabrze, Medical University of Silesia, Katowice, MF, Poland; 4 3rd Department of Cardiology, Faculty of Medical Sciences in Zabrze, Medical University of Silesia, Katowice, Silesian Center for Heart Diseases, Zabrze, RR, Poland
Correspondence: Tadeusz Osadnik
Silesian Centre for Heart Diseases, Ul. Marii Skłodowskiej-Curie 9, Zabrze 41-800, Poland
Tel +0048 32 373 36 19
Fax +0048 32 273 26 79
Email [email protected]
Background and Purpose: We aimed to assess the association between calcium and phosphorous and metabolic syndrome (MetS) in normal-weight individuals.
Patients and Methods: The study sample comprised 460 normal-weight (body mass index < 25kg/m2) adults aged 18– 35 years. The diagnosis of MetS was based on the presence of at least two of the following: 1) systolic blood pressure (SBP) ≥ 130 mmHg or diastolic blood pressure (DBP) ≥ 85 mmHg, 2) triglycerides (TG) > 150 mg/dl, 3) high-density lipoprotein cholesterol (HDL-C) < 1 mmol/in men and < 1.2 mmol/l in women, 4) total cholesterol (TC) > 5.2 mmol/l, and 5) fasting glucose (FBG) > 5.55 mmol/l.
Results: Patients with MetS were more often male and slightly older and they had a higher body mass index (BMI) and waist circumference. By definition, patients with MetS had higher levels of BP, GLC, glycated hemoglobin A1c, TC, low-density lipoprotein cholesterol (LDL-C), TG, and apolipoprotein B but significantly lower concentrations of HDL-C and apolipoprotein A. Moreover, subjects with MetS had higher activity of the liver enzymes alanine aminotransferase, alkaline phosphatase and gamma-glutamyl transpeptidase (GGTP). Higher concentrations of uric acid, creatinine and albumin (ALB) were also observed in subjects with MetS. The factors associated with MetS in the multivariate analysis were higher GGTP activity (OR per 5 unit increase – 1.23 (1.11– 1.37); p< 0.0001), a higher BMI (OR – 1.28 (1.1– 1.52); p=0.003), a higher concentration of calcium (OR per 0.1 mmol/l increase – 1.79 (1.21– 2.7); p=0.004), higher ALB levels (OR per 5 g/l increase – 1.76 (1.11– 2.95), p=0.02); higher phosphorous levels (OR per 0.1 mmol/l increase – 0.82 (0.67– 0.99); p=0.04), and a good household situation (odds ratio (OR) – 0.58 95% confidence interval (CI) (0.31– 1.07); p=0.08).
Conclusion: Calcium and phosphorus levels are significantly associated with MetS in normal-weight individuals.
Keywords: calcium, phosphorus, gamma-glutamyl transpeptidase, metabolic syndrome
Introduction
Metabolic syndrome (MetS) has traditionally been diagnosed in only overweight or obese subjects.1 In the past few years, studies from various countries have provided evidence that there is a substantial proportion of normal-weight individuals who, based on their glucose (GLC) levels, blood pressure (BP) or lipid parameters, could be diagnosed with MetS.2 As a result, overweight and obesity were undermined as necessary criteria for a diagnosis of MetS, and the concept of MetS in normal-weight individuals emerged.3
Calcium plays an important role in lipid metabolism and in the pathomechanism of insulin resistance.4 Higher calcium levels have been associated with MetS and its components.5 However, a recent retrospective analysis yielded different results, showing that higher calcium levels in healthy individuals were associated with a lower risk of MetS during 4.3 years of follow-up.6 To the best of our knowledge, there is no data on calcium levels in normal-weight subjects with MetS.
The aim of the present analysis was to assess the association between calcium and phosphorus and MetS in normal-weight individuals.
Patients and Methods
Study Sample and Recruitment
This analysis was conducted on a study sample recruited for the MAGNETIC study (Metabolic and Genetic Profiling of Young Adults with and without a Family History of Premature Coronary Heart Disease). The study protocol has been published previously.7 In brief, the study sample was recruited between July 2015 and December 2017. As the primary aim of the MAGNETIC study was to analyze the differences between healthy individuals with and without a family history of premature coronary artery disease (P-CAD), the inclusion criteria were age between 18 and 35 years and angiographically confirmed P-CAD in 1st degree relatives (cases) or no angiographically confirmed P-CAD in 1st degree relatives (controls). The exclusion criteria were a lack of informed consent, pregnancy, lactation, and acute or chronic diseases requiring pharmacotherapy. Subjects with a positive family history of P-CAD were recruited by contacting the offspring of older patients hospitalized due to P-CAD from 2010–2017 at the Silesian Center for Heart Diseases. P-CAD was defined as angiographically documented coronary artery disease in a 1st degree relative before 55 years of age in men and 65 years of age in women. The control group was recruited from healthy (without previously diagnosed diseases) subjects aged 18–35 years who attended screening appointments at the center. For the purpose of the present analysis, only normal-weight patients (body mass index (BMI) 25 kg/m2) were included.
Biochemical Analyses
Peripheral blood was collected from participants during the morning hours after 8–10 hours of fasting. A Cobas 6000 analyzer (Roche Diagnostics, USA) was used to conduct the biochemical analyses. To obtain serum, blood was centrifuged at 1500 rpm at 4°C. GLC, lipid profile, lipoproteins, uric acid (UA), high-sensitivity C-reactive protein (hs-CRP), calcium, phosphorus, vitamin D, albumin (ALB), total protein, aspartate aminotransferase (AST), alanine aminotransferase (ALT), alkaline phosphatase (ALP) and gamma-glutamyl transpeptidase (GGTP) were measured. Glycated hemoglobin A1c (HbA1c) was measured in whole blood. Fibrinogen was assessed using a Siemens BCS XP analyzer (Siemens Healthcare, Germany). The test kits and catalog numbers are shown in Table S1, Supplementary Material. The percentage of high-density lipoprotein (HDL [%]) was calculated as the HDL-C level divided by the TC level (mmol/l) x100. ALB-corrected calcium levels were obtained according to the following formula: corrected calcium = measured calcium + {(40 − [ALB]) × 0.02}.8
Diagnosis of Metabolic Syndrome
Diagnosis of MetS was based on the presence of at least two of the following: 1) systolic blood pressure (SBP) ≥130 mmHg or diastolic blood pressure (DBP) ≥ 85 mmHg, 2) triglycerides (TG) over 150 mg/dl, 3) HDL cholesterol (HDL-C) < 1 mmol/l in men and < 1.2 mmol/l in women, 4) total cholesterol (TC) >5.2 mmol/l, or 5) fasting glucose (FBG) over 5.0 mmol/l. The criteria for diagnosing MetS apart from obesity were used based on the study by Buscemi et al.2
Statistical Analysis
Continuous variables were compared using Student’s t-test, while categorical variables were compared using the chi-square test. A univariate analysis was performed to better describe the associations between clinical characteristics and MetS. A P-value of 0.05 was used as a cut-off for statistical significance.
There were some missing data for white blood cells (WBC) (0.4%), fibrinogen (0.8%), vitamin D (1.5%), HbA1c (0.4%), smoking status (0.8%), household situation (0.2%), and sleep hours on weekdays (0.2%). Little’s MCAR test was used to assess whether data were missing at random. A multivariable logistic regression analysis with backward selection procedure was performed on the complete case dataset. The outcome variable was the presence of MetS. The independent variables initially included in the model were all variables referring to demographics and family history, inflammatory parameters, corrected calcium, phosphorous and vitamin D liver tests, total protein, albumin, uric acid, and creatinine. See Table 1. The variables that were used for the definition of MetS, which included lipid parameters (including apolipoproteins A (apo A) and B (apo B) that are closely correlated with HDL-C and low-density lipoprotein (LDL-C) levels, respectively), GLC, HbA1c and BP were not included in the multivariable analysis. The independent variables that were included in the multivariate model were based on the Akaike information criterion (AIC). The group counts of 70 patients with MetS and 390 not meeting MetS criteria were sufficient to detect a difference of at least 36% of the standard deviation with a power of 80% or more, assuming equal variances. The figures were prepared in Excel. The statistical analysis was performed using the computing environment R (R Development Core Team, 2005) and Power Analysis Software (PASS Statistical Software, Kaysville, Utah) Statistical RCT (2013).9,10
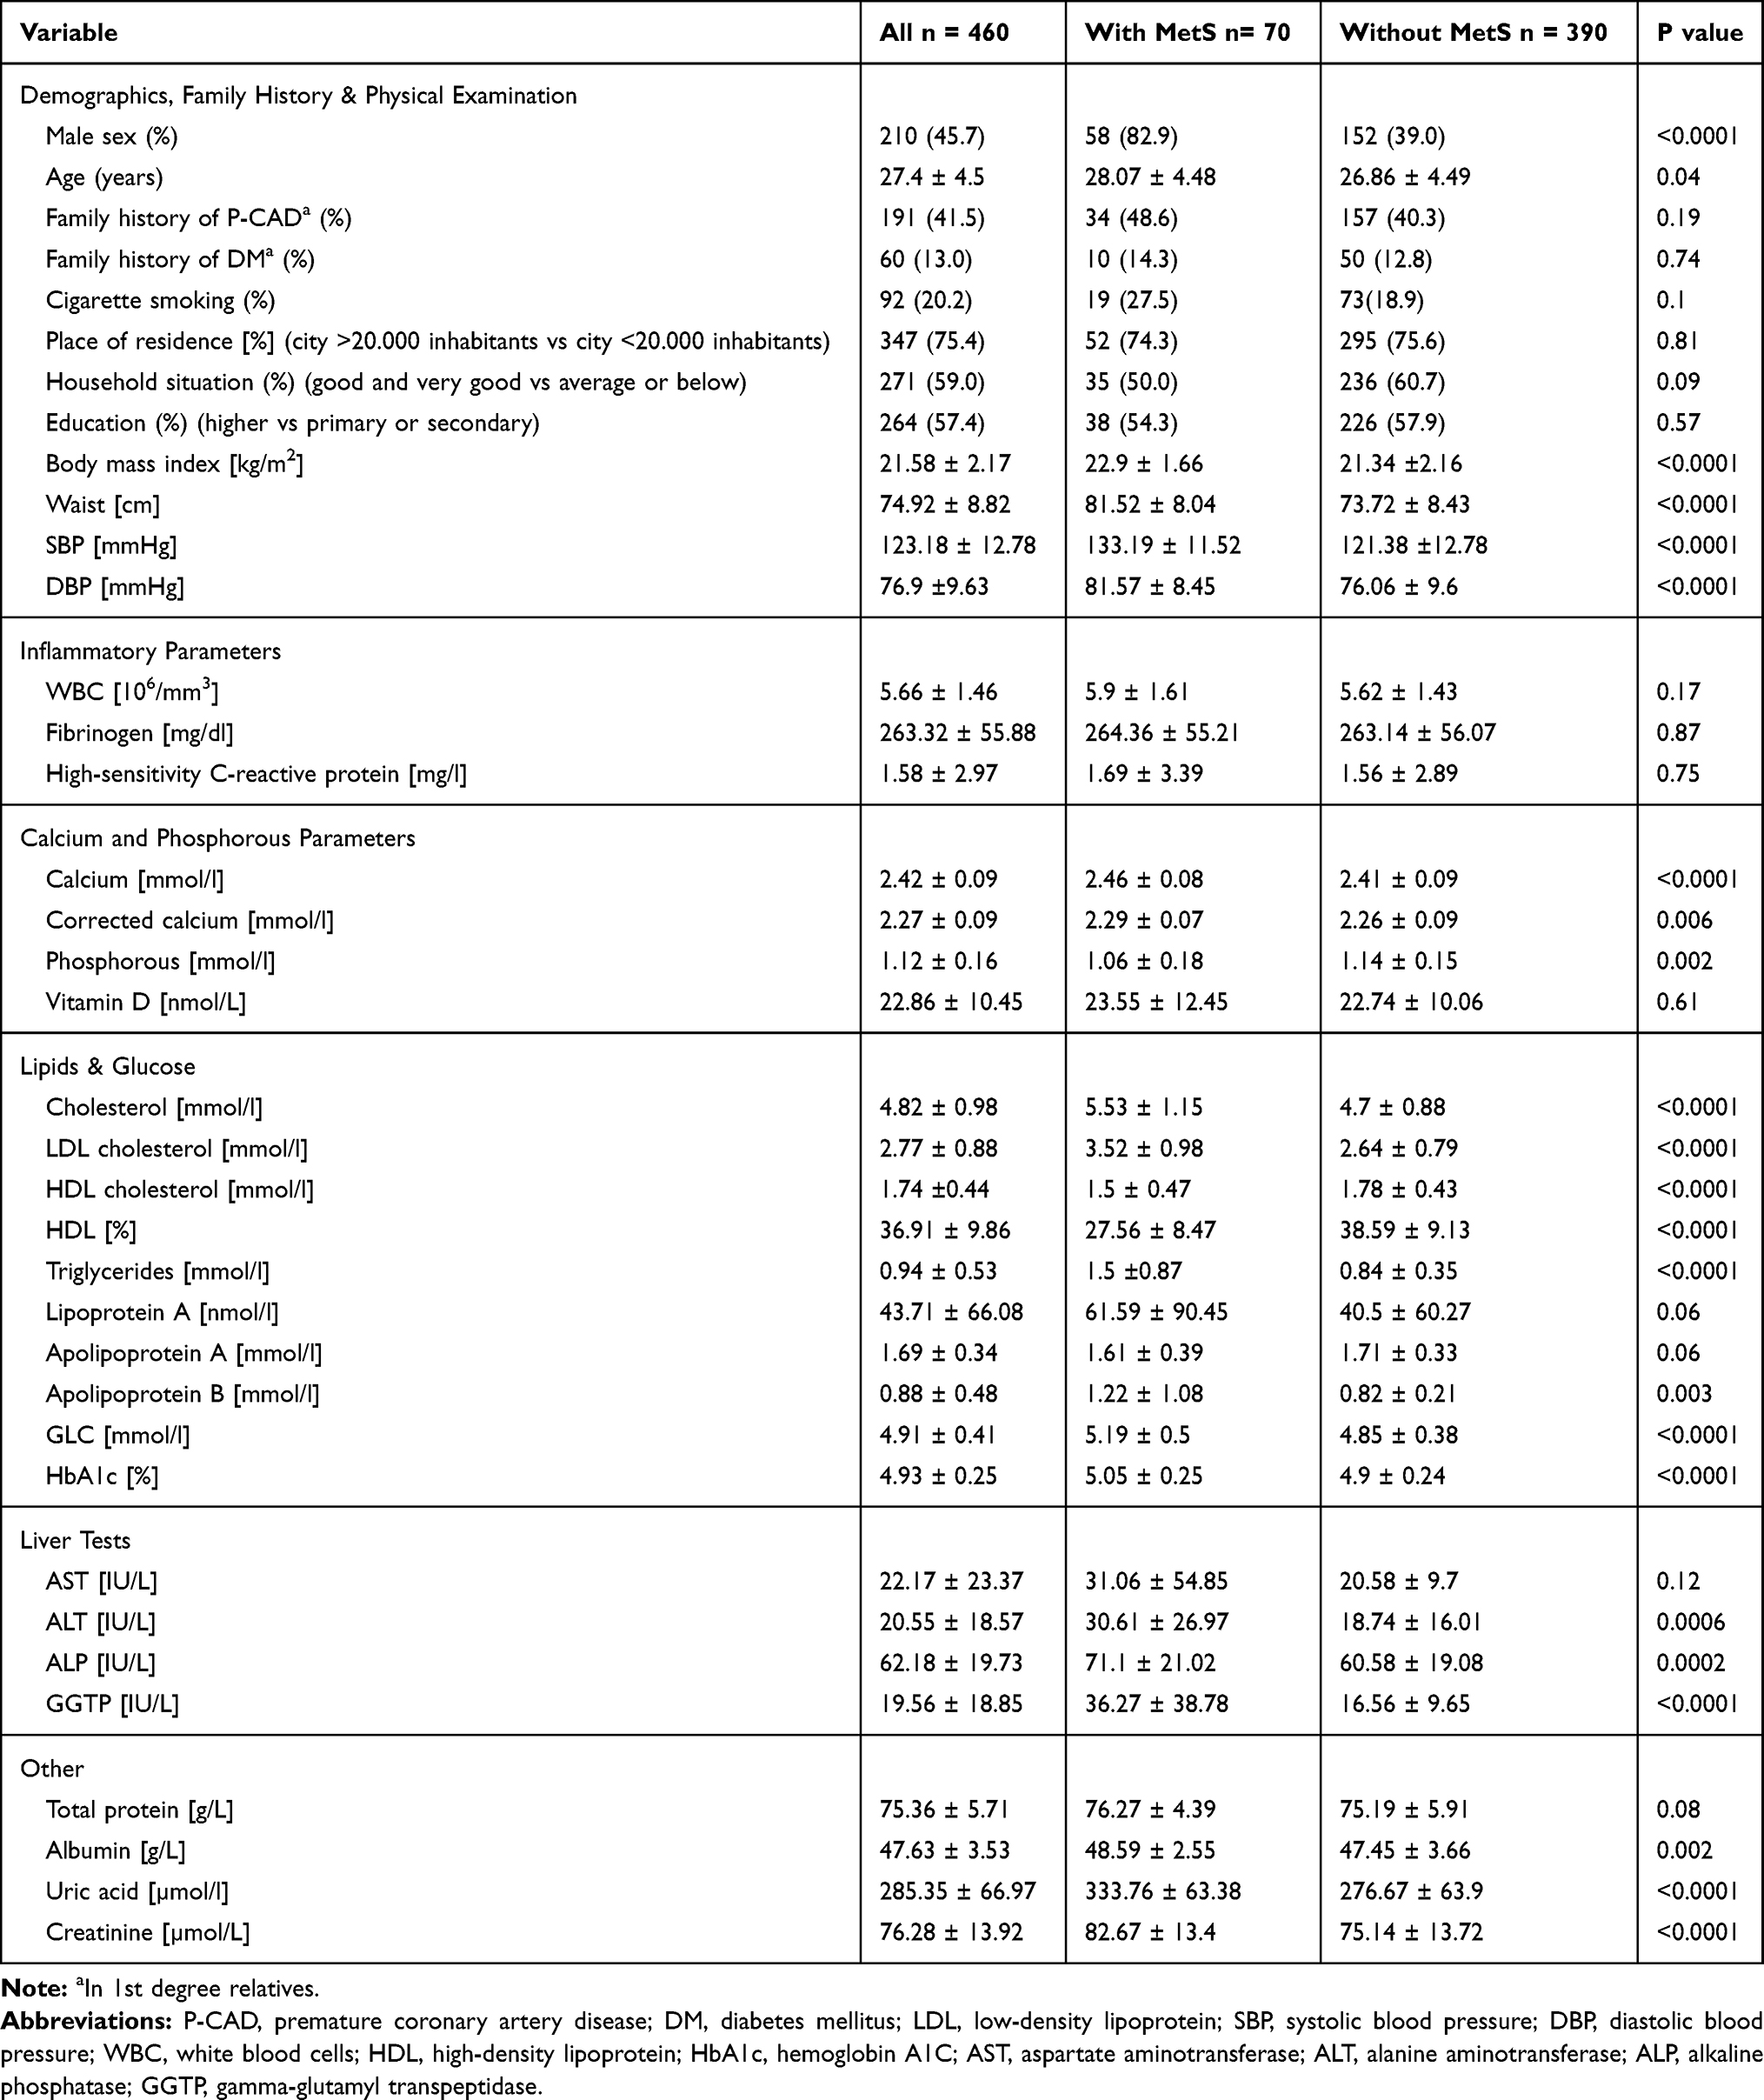 |
Table 1 Clinical Characteristics of the Study Participants |
Results
The clinical characteristics of the study group are presented in Table 1. In general, the patients with MetS were more often male and slightly older; although within the normal range, they had a higher BMI, waist circumference (WC) and waist-to-hip ratio (WHR). By definition, the patients with MetS had higher levels of BP, GLC, HbA1c, TC, LDL-C, TG, and apo B but significantly lower concentrations of HDL-C and apo A. Moreover, the subjects with MetS had higher activity of the liver enzymes ALT, ALP and GGTP. Higher concentrations of UA, creatinine (CR) and ALB were also observed in the subjects with MetS.
The calcium levels, both crude and adjusted for ALB concentration, were higher in patients with MetS. On the other hand, the phosphorus levels were lower in the patients with MetS. The univariate analysis confirmed the associations identified in the group comparisons. (Figure S1) The factors with the strongest associations with MetS, apart from lipid parameters, GLC and BP, which are used as diagnostic criteria of MetS, were male sex; liver enzymes, in particular ALP, GGTP and ALT; calcium; phosphorus; and UA.
As there were less than 1% missing data and Little’s MCAR test showed that data were missing completely at random (p value = 0.57), a multivariable analysis was performed after the exclusion of observations with missing data. All variables except those that were used for the definition of MetS were included in the analysis (see methods section). Worse household situation, higher BMI, higher activity of GGTP, a higher concentration of calcium, a higher ALB level and a lower concentration of phosphorus were most significantly associated with MetS. (Figure 1)
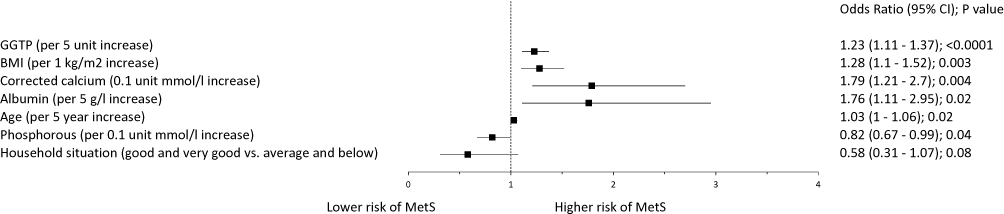 |
Figure 1 Independent factors associated with metabolic syndrome. Variable selection was based on the Akaike information criterion. Abbreviations: BMI, body mass index; GGTP, gamma-glutamyl transpeptidase; MetS, metabolic syndrome; 95% CI, 95% confidence interval. |
Discussion
MetS encompasses the conditions of hypertension, insulin resistance, dyslipidemia and obesity.11 The increased BMI component seems to not be an obligatory factor because MetS may also occur in patients with normal body weight.12 The influence of calcium and phosphorus levels on the biochemical changes leading to MetS remains controversial in the literature and may be interesting, especially in normal-weight individuals, where neither obesity nor overweight seem to impact the clinical outcome.
Calcium homeostasis is known to play an important role as a regulator in several biochemical processes, such as bone formation and biomineralization, muscle contraction, neurotransmitter and hormone release, blood clotting, inflammatory response and the transmission of cell signals. The level of calcium and its metabolism are known to be altered in the contexts of hyperglycemia and hypertension. Moreover, changes in calcium metabolism appear to be a key factor linking osteoporosis and hypertension.13
Our results indicate that among patients with MetS, the calcium levels appear to play an important role as a differentiating factor. The most interesting finding is that among normal-weight individuals, the calcium level was higher in the MetS group than in the group of healthy individuals with normal weight. Additionally, we found an inverse relationship in reference to the phosphorus level in the groups mentioned.
To our knowledge, this is the first study showing the calcium-phosphorus relationship in the context of normal-weight individuals with MetS, so it is difficult to directly compare our results with those of other authors. In general, the observed tendency could be consistent with the findings of Yamaguchi et al,14 who found that the serum calcium level was positively associated with impaired GLC metabolism in men with type 2 diabetes (T2DM), whereas in a study by Sun et al,15 high calcium levels were correlated with high concentrations of GLC and insulin resistance in women. Serum calcium concentrations have also been found to be positively related to SBP and DBP as well as to the serum levels of GLC and cholesterol.16 In a study by Peredes et al,17 high calcium levels were associated with MetS. Additionally, according to Kim et al,18 the prevalence of MetS increased progressively as the serum calcium levels increased. Serum calcium was also found to be significantly and positively associated with SBP, DBP and serum TC.19 Increased serum calcium levels lead to the influx of calcium into arterial smooth muscles via calcium channels, increasing cytosolic calcium and inducing muscle contraction and arterial vasoconstriction. As a result, increased BP pressure and peripheral vascular resistance can be observed.20
A significant positive correlation among GLC, insulin resistance and the level of calcium found in a study by Sun et al15 showed that the subjects with low calcium levels had the lowest concentration of GLC and the lowest levels of insulin resistance, whereas subjects with high calcium levels had the highest concentration of GLC and the highest level of insulin resistance. However, according to the findings of Jehle et al,21 supplementation with calcium may improve insulin sensitivity. Additionally, the findings of Baz-Hecht et al22 and Bener et al23 showed that daily consumption of calcium was inversely associated with the risk of developing T2DM. However, the effect of calcium supplementation on MetS remains poorly established.24 The conflicting results for calcium supplementation, which appears to decrease the level of insulin resistance and increase the serum calcium levels, appears to be associated with a higher level of insulin resistance, implying a more complex pathomechanism than that only merely reflected by the serum calcium levels.
It is known that the level of calcium increases with increasing parathyroid hormone (PTH) levels. Moreover, high phosphorus levels directly stimulate PTH secretion and synthesis by human parathyroid tissue.25 Ahlström et al11 observed an association between MetS parameters and increased cardiovascular diseases and plasma PTH. In the mentioned study, an association between serum PTH and both SBP and DBP was also found. It was also shown that insulin sensitivity is inversely correlated with the plasma level of PTH.26 Nevertheless, the findings of Yamaguchi et al14 suggested that serum calcium but not PTH may play a role in insulin resistance and hyperglycemia in men with T2DM.
We also found a significant difference in phosphorus levels between healthy individuals and individuals with MetS, with lower phosphorus levels in the individuals with MetS. It is known that hypophosphatemia may be related to the development of obesity and dyslipidemia.27 Impaired phosphorus metabolism may lead to the development of MetS, as phosphorus is involved in the metabolism of carbohydrates.28,29 Similarly to our study, in the study of Park al,27 a group of patients with higher serum levels of phosphorus tended to have lower BMI, TG levels and FBG levels. Lower levels of phosphorus in the quoted study were, on the other hand, correlated with MetS and higher insulin levels. In the study by Dhingra et al,30 the serum phosphorus level was positively correlated with the TC/HDL-C ratio but inversely correlated with BMI and SBP. Moreover, in the study by Kalaitzidis et al,31 patients with MetS had significantly lower serum phosphorus levels than the controls, which seems to be in partial agreement with our results.
We also found a strong correlation between the level of calcium and the level of GGTP, with significantly higher levels of the enzyme in normal-weight individuals with MetS than in healthy normal-weight individuals (36.27 IU/L vs 16.56 IU/L). Franzini et al32 noted the role of GGTP as a differentiating factor for MetS patients among hypertensive subjects. Additionally, the conclusions from the meta-analysis of Kunutsor et al33 showing a strong positive association between GGTP and MetS are consistent with our results. GGTP showed the highest correlation with calcium among all tested liver parameters in our trial, suggesting that it is an interesting component of the calcium-GGTP-phosphorus triad for the diagnosis of MetS in normal-weight individuals.
Additionally, the results we obtained show that in the group of normal-weight patients, calcium was positively correlated with ALP, which was significantly higher in the normal-weight individuals with MetS than in the healthy normal-weight individuals. The idea that MetS is associated with higher serum ALP levels seems to be consistent with our results. Moreover, increased serum ALP may reflect osteoporosis, indicating a higher risk of osteoporosis in the group of patients with MetS and higher calcium levels.34 The correlation among hypertension, diabetes and osteoporosis is well known. It has also been suggested that ALP may promote vascular calcification by hydrolyzing pyrophosphate.35 An association of elevated serum ALP levels with progressive arterial calcification was also observed by Sigrist et al.36 Nevertheless, we cannot confirm whether there is an association between serum ALP and vascular calcification, as we have no data on vascular calcification in our group. It is important to emphasize that the total ALP level may be associated with mean arterial pressure and HDL-C and that hyperinsulinemia, insulin resistance and MetS are also strongly associated with one another.37
Conclusion
In summary, the comparison of the results obtained for normal-weight individuals revealed for the first time a unique, significant calcium–phosphorus relationship. Taking into account the results obtained from liver tests, it might also be worth focusing on the comprehensive relationship between the triad of calcium, phosphorus and GGTP levels, especially in normal-weight individuals with MetS. The unique finding of a calcium-GGTP-phosphorus association seems to be a presumable predictor for MetS in normal-weight individuals.
Abbreviations
AIC, Akaike information criterion; ALB, albumin; ALP, alkaline phosphatase; ALT, alanine aminotransferase; apo A, apolipoprotein A; apo B, apolipoprotein B; AST, aspartate aminotransferase; BMI, body mass index; BP, blood pressure; Ca+2, calcium; CI, confidence interval; CR, creatinine; DBP, diastolic blood pressure; DM, diabetes mellitus; FBG, fasting glucose; FH, family history; GGTP, gamma-glutamyl transpeptidase; GLC, glucose; HbA1c, glycated hemoglobin A1c; HDL-C, high-density lipoprotein cholesterol; HDL[%], percentage of high-density lipoprotein; hs-CRP, high-sensitivity C-reactive protein; LDL-C, low-density lipoprotein cholesterol; Little’s MCAR test, Little’s missing completely at random test; MAGNETIC study, Metabolic and Genetic Profiling of Young Adults with and without a Family History of Premature Coronary Heart Disease; MetS, metabolic syndrome; OR, odds ratio; P-CAD, premature coronary artery disease; PTH, parathyroid hormone; SBP, systolic blood pressure; T2DM, type 2 diabetes, TC, total cholesterol; TG, triglycerides; UA, uric acid; WBC, white blood cells; WC, waist circumference; WHR, waist/hip ratio.
Data Sharing Statement
The datasets used and/or analyzed during the current study are available from the corresponding author.
Ethics and Consent Statement
The study was conducted following the Declaration of Helsinki and good clinical practice. The study protocol was approved by the Ethics Committee at the Institute of Occupational Medicine and Environmental Health, Sosnowiec and Medical University of Silesia (Resolution No 03/2013). Informed written consent was obtained from all subjects enrolled in the study.
Acknowledgments
We would like to thank the nurses from the Silesian Centre for Heart Diseases for their help with patient recruitment and the laboratory personnel for performing the necessary laboratory measurements.
Author Contributions
TO, NP, KO, and MG made substantial contributions to the design of the study. TO, NP, KO, MF and RR were involved in the data acquisition. TO analyzed and contributed to the interpretation of the data. TO, MD and ML interpreted the data and wrote the manuscript. All authors contributed to data analysis, drafting and revising the article, gave final approval of the version to be published, and agree to be accountable for all aspects of the work.
Funding
The study was financed by the National Science Centre in Poland (2014/13/B/NZ5/03166, OPUS 7).
Disclosure
The authors declare that they have no competing interests. The funding sponsor played no role in the design of the study; in the collection, analyses, or interpretation of data; in the writing of the manuscript; or in the decision to publish the results.
References
1. O’Neill S, O’Driscoll L. Metabolic syndrome: a closer look at the growing epidemic and its associated pathologies. Obes Rev. 2015;16:1–12. doi:10.1111/obr.12229
2. Buscemi S, Chiarello P, Buscemi C, et al. Characterization of metabolically healthy obese people and metabolically unhealthy normal-weight people in a general population cohort of the ABCD study. J. Diabetes Res. 2017;2017:1–9. doi:10.1155/2017/9294038
3. Stefan N, Schick F, HU H. Causes, characteristics, and consequences of metabolically unhealthy normal weight in humans. Cell Metab. 2017;26:292–300. doi:10.1016/j.cmet.2017.07.008
4. Mozos I, Marginean O. Links between Vitamin D deficiency and cardiovascular diseases. Biomed Res Int. 2015;1–12.
5. Saltevo J, Niskanen L, Kautiainen H, et al. Serum calcium level is associated with metabolic syndrome in the general population: FIN-D2D study. Eur J Endocrinol. 2011;165:429–434. doi:10.1530/EJE-11-0066
6. Baek JH, Jin S-M, Bae JC, et al. Serum calcium and the risk of incident metabolic syndrome: a 4.3-year retrospective longitudinal study. Diabetes Metab J. 2017;41:60–68. doi:10.4093/dmj.2017.41.1.60
7. Osadnik T, Osadnik K, Pawlas N, et al. Metabolic and genetic profiling of young adults with and without a family history of premature coronary heart disease (MAGNETIC). Study design and methodology. Arch Med Sci. 2019;15.
8. Phillips P, Pain R. Correcting the calcium. Br Med J. 1977;1(6061):598.
9. R. Development Core Team. R: A Language and Environment for Statistical Computing [Homepage on the Internet]. Vienna: R Foundation for Statistical Computing; 2016. Available from: http://www.R-project.org/.
10. PASS 15 Power Analysis and Sample Size Software [homepage on the Internet]. Utah: NCSS; 2017. Available from: https://www.ncss.com/software/pass/.
11. Ahlström T, Hagström E, Larsson A, Rudberg C, Lind L, Hellman P. Correlation between plasma calcium, parathyroid hormone (PTH) and the metabolic syndrome (MetS) in a community-based cohort of men and women. Clin Endocrinol. 2009;71(5):673–678. doi:10.1111/j.1365-2265.2009.03558.x
12. Suliga E, Kozieł D, Głuszek S. Prevalence of metabolic syndrome in normal weight individuals. Ann Agric Environ Med. 2016;23(4):631–635. doi:10.5604/12321966.1226858
13. Wong SK, Chin KY, Suhaimi FH, Ahmad F, Ima-Nirwana S. The relationship between metabolic syndrome and osteoporosis: a review. Nutrients. 2016;8(6):347. doi:10.3390/nu8060347
14. Yamaguchi T, Kanazawa I, Takaoka S, Sugimoto T. Serum calcium is positively correlated with fasting plasma glucose and insulin resistance, independent of parathyroid hormone, in male patients with type 2 diabetes mellitus. Metabolism. 2011;60(9):1334–1339. doi:10.1016/j.metabol.2011.02.003
15. Sun G, Vasdev S, Martin GR, Gadag V, Zhang H. Altered calcium homeostasis is correlated with abnormalities of fasting serum glucose, insulin resistance, and beta-cell function in the Newfoundland population. Diabetes. 2005;54(11):3336–3339. doi:10.2337/diabetes.54.11.3336
16. Lind L, Jakobsson S, Lithell H, Wengle B, Ljunghall S. Relation of serum calcium concentration to metabolic risk factors for cardiovascular disease. BMJ. 1988;297(6654):960–963. doi:10.1136/bmj.297.6654.960
17. Peredes S, Matta-Coelho C, Monteiro M, et al. Copper levels, calcium levels and metabolic syndrome. Revista Portuguesa de Diabetes. 2016;11(3):99–105.
18. Kim MK, Kim G, Jang EH, et al. Altered calcium homeostasis is correlated with the presence of metabolic syndrome and diabetes in middle-aged and elderly Korean subjects: the Chungju Metabolic Disease Cohort study (CMC study). Atherosclerosis. 2010;212(2):674–681. doi:10.1016/j.atherosclerosis.2010.07.005
19. Jorde R, Sundsfjord J, Fitzgerald P, Bønaa KH. Serum calcium and cardiovascular risk factors and diseases: the Tromsø study. Hypertension. 1999;34(3):484–490. doi:10.1161/01.HYP.34.3.484
20. Aoki K, Miyagawa. Correlation of increased serum calcium with elevated blood pressure and vascular resistance during calcium infusion in normotensive man. J Hypertens. 1990;8:579–583. doi:10.1097/00004872-199006000-00012
21. Jehle S, Lardi A, Felix B, Hulter HN, Stettler C, Krapf R. Effect of large doses of parenteral vitamin D on glycaemic control and calcium/phosphate metabolism in patients with stable type 2 diabetes mellitus: a randomised, placebo-controlled, prospective pilot study. Swiss Med Wkly. 2014;144:13942.
22. Baz-Hecht M, Goldfine AB. The impact of vitamin D deficiency on diabetes and cardiovascular risk. Curr Opin Endocrinol Diab Obes. 2010;17(2):113–119. doi:10.1097/MED.0b013e3283372859
23. Bener A, Al-Hamaq AO, Kurtulus EM, Abdullatef WK, Zirie M. The role of vitamin D, obesity and physical exercise in regulation of glycemia in Type 2 Diabetes Mellitus patients. Diabetes Metab Syndr. 2016;10(4):198–204. doi:10.1016/j.dsx.2016.06.007
24. Munoz-Garach A, Garcia-Fontana B, Munoz-Torres M. Vitamin D status, calcium intake and risk of developing type 2 diabetes: an unresolved issue. Nutrients. 2019;11(3):E642. doi:10.3390/nu11030642
25. Almaden Y, Hernandez A, Torregrosa V, et al. High phosphate level directly stimulates parathyroid hormone secretion and synthesis by human parathyroid tissue in vitro. J Am Soc Nephrol. 1998;9(10):1845–1852.
26. Chiu KC, Chuang LM, Lee NP, et al. Insulin sensitivity is inversely correlated with plasma intact parathyroid hormone level. Metabolism. 2000;49(11):1501–1505. doi:10.1053/meta.2000.17708
27. Park W, Kim BS, Lee JE, et al. Serum phosphate levels and the risk of cardiovascular disease and metabolic syndrome: a double-edged sword. Diabetes Res Clin Pract. 2009;83(1):119–125. doi:10.1016/j.diabres.2008.08.018
28. Paula FJ, Plens AE, Foss MC. Effects of hypophosphatemia on glucose tolerance and insulin secretion, Horm.. Metab Res. 1998;30:281–284. doi:10.1055/s-2007-978884
29. Haglin L. Hypophosphatemia causa of the disturbed metabolism in the metabolic syndrome. Med Hypotheses. 2001;56:657–663. doi:10.1054/mehy.2000.1272
30. Dhingra R, Sullivan LM, Fox CS, et al. Relations of serum phosphorus and calcium levels to the incidence of cardiovascular disease in the community. Arch Intern Med. 2007;167(9):879–885. doi:10.1001/archinte.167.9.879
31. Kalaitzidis R, Tsimihodimos V, Bairaktari E, Siamopoulos KC, Elisaf M. Disturbances of phosphate metabolism: another feature of metabolic syndrome. Am J Kidney Dis. 2005;45(5):851–858. doi:10.1053/j.ajkd.2005.01.005
32. Franzini M, Scataglini I, Ricchiuti A, et al. Association between plasma gamma-glutamyltransferase fractions and metabolic syndrome among hypertensive patients. Sci Rep. 2017;7(1):12003. doi:10.1038/s41598-017-12356-w
33. Kunutsor SK, Apekey TA, Seddoh D. Gamma glutamyltransferase and metabolic syndrome risk: a systematic review and dose–response meta-analysis. Int J Clin Pract. 2015;69(1):136–144. doi:10.1111/ijcp.12507
34. Krishnamurthy VR, Baird BC, Wei G, Greene T, Raphael K, Beddhu S. Associations of serum alkaline phosphatase with metabolic syndrome and mortality. Am J Med. 2011;124(6):
35. Fadini GP, Pauletto P, Avogaro A, Rattazzi M. The good and the bad in the link between insulin resistance and vascular calcification. Atherosclerosis. 2007;193(2):241–244. doi:10.1016/j.atherosclerosis.2007.05.015
36. Sigrist MK, Taal MW, Bungay P, McIntyre CW. Progressive vascular calcification over 2 years is associated with arterial stiffening and increased mortality in patients with stages 4 and 5 chronic kidney disease. Clin J Am Soc Nephrol. 2007;2(6):1241–1248. doi:10.2215/CJN.02190507
37. Cheung CL, Tan KC, Lam KS, Cheung BM. The relationship between glucose metabolism, metabolic syndrome, and bone-specific alkaline phosphatase: a structural equation modeling approach. J Clin Endocrinol Metab. 2013;98:3856–3863. doi:10.1210/jc.2013-2024
 © 2020 The Author(s). This work is published and licensed by Dove Medical Press Limited. The
full terms of this license are available at https://www.dovepress.com/terms
and incorporate the Creative Commons Attribution
- Non Commercial (unported, 3.0) License.
By accessing the work you hereby accept the Terms. Non-commercial uses of the work are permitted
without any further permission from Dove Medical Press Limited, provided the work is properly
attributed. For permission for commercial use of this work, please see paragraphs 4.2 and 5 of our Terms.
© 2020 The Author(s). This work is published and licensed by Dove Medical Press Limited. The
full terms of this license are available at https://www.dovepress.com/terms
and incorporate the Creative Commons Attribution
- Non Commercial (unported, 3.0) License.
By accessing the work you hereby accept the Terms. Non-commercial uses of the work are permitted
without any further permission from Dove Medical Press Limited, provided the work is properly
attributed. For permission for commercial use of this work, please see paragraphs 4.2 and 5 of our Terms.