Back to Journals » Journal of Asthma and Allergy » Volume 17
Bronchial Thermoplasty Improves Ventilation Heterogeneity Measured by Functional Respiratory Imaging in Severe Asthma
Authors Foo CT, Donovan GM, Thien F ![]() , Langton D, Noble PB
, Langton D, Noble PB
Received 14 December 2023
Accepted for publication 22 March 2024
Published 22 April 2024 Volume 2024:17 Pages 399—409
DOI https://doi.org/10.2147/JAA.S454951
Checked for plagiarism Yes
Review by Single anonymous peer review
Peer reviewer comments 3
Editor who approved publication: Dr Amrita Dosanjh
Chuan T Foo,1,2 Graham M Donovan,3 Francis Thien,1,2 David Langton,2,4 Peter B Noble5
1Department of Respiratory Medicine, Eastern Health, Melbourne, VIC, Australia; 2Faculty of Medicine, Nursing and Health Sciences, Monash University, Melbourne, VIC, Australia; 3Department of Mathematics, University of Auckland, Auckland, New Zealand; 4Department of Thoracic Medicine, Peninsula Health, Frankston, VIC, Australia; 5School of Human Sciences, The University of Western Australia, Crawley, WA, Australia
Correspondence: Chuan T Foo, Department of Respiratory Medicine, Eastern Health, Melbourne, Victoria, Australia, Tel +613 9095 2414, Email [email protected]
Purpose: Bronchial thermoplasty (BT) is a bronchoscopic intervention for the treatment of severe asthma. Despite demonstrated symptomatic benefit, the underlying mechanisms by which this is achieved remain uncertain. We hypothesize that the effects of BT are driven by improvements in ventilation heterogeneity as assessed using functional respiratory imaging (FRI).
Patient and Methods: Eighteen consecutive patients with severe asthma who underwent clinically indicated BT were recruited. Patients were assessed at baseline, 4-week after treatment of the left lung, and 12-month after treatment of the right lung. Data collected included short-acting beta-agonist (SABA) and oral prednisolone (OCS) use, asthma control questionnaire (ACQ-5) and exacerbation history. Patients also underwent lung function tests and chest computed tomography. Ventilation parameters including interquartile distance (IQD; measure of ventilation heterogeneity) were derived using FRI.
Results: 12 months after BT, significant improvements were seen in SABA and OCS use, ACQ-5, and number of OCS-requiring exacerbations. Apart from pre-bronchodilator FEV1, no other significant changes were observed in lung function. Ventilation heterogeneity significantly improved after treatment of the left lung (0.18 ± 0.04 vs 0.20 ± 0.04, p=0.045), with treatment effect persisting up to 12 months later (0.18 ± 0.05 vs 0.20 ± 0.04, p=0.028). Ventilation heterogeneity also improved after treatment of the right lung, although this did not reach statistical significance (0.18 ± 0.05 vs 0.19 ± 0.04, p=0.06).
Conclusion: Clinical benefits after BT are accompanied by improvements in ventilation heterogeneity, advancing our understanding of its mechanism of action. Beyond BT, FRI has the potential to be expanded into other clinical applications.
Keywords: asthma, computed tomography, computational fluid dynamics, imaging, mechanism of action, pathophysiology
Introduction
Asthma is a common disease that is estimated to affect 250 million people worldwide and accounts for >20 million disability-adjusted life years.1 Asthma is characterized clinically by variable symptoms of cough, chest tightness and shortness of breath; physiologically by evidence of reversible airflow limitation; and pathologically by increased thickness of the airway smooth muscle (ASM) layer among other structural changes.2 The majority of patients with asthma can be successfully managed with inhaled corticosteroids (ICS) and bronchodilators, and by addressing comorbidities. However, about 10% experience uncontrolled symptoms and frequent exacerbations despite optimal therapy,3 and are defined as having severe asthma.4 Whilst biologics and macrolides have roles in managing these patients,5 bronchial thermoplasty (BT) offers another modality with different mechanisms of action.
BT involves the direct application of radiofrequency energy to the mucosa of airways 2–10mm in diameter, resulting in thermal ablation and shrinking of the underlying ASM.6–8 BT has been shown in randomized controlled trials to improve asthma symptoms, reduce asthma exacerbations, and improve quality of life,9–12 with benefits persisting up to 10 years after treatment.13–15 Despite this, the physiological changes that underpin the clinical benefits remain poorly understood, especially given the small fraction of airways treated, with spirometry showing little or no change.9–11,15,16
Mathematical modelling of the physiological behavior of the asthmatic lung suggests that the dilation of the airways treated during BT should lead to a reopening cascade in the smaller distal untreated airways, and a redistribution of airflow that improves ventilation heterogeneity.17 Indeed, there is now emerging evidence that these proposed changes do occur in patients after BT. For instance, imaging studies have demonstrated that airway luminal volume increases,18–21 and regions of low or absent ventilation decreases after BT.22,23 Physiological changes in small airways have also been observed, with improvements in multiple breath nitrogen washout24 and gas trapping25 reported in recent studies. Whilst these are positive developments, imaging studies demonstrating an improvement in ventilation heterogeneity are lacking.
A number of functional lung imaging techniques exist for the evaluation of ventilation. Although hyperpolarized gas magnetic resonance imaging is regarded as the gold standard, its use is limited to specialized research centers due to its high setup cost, complex imaging protocol and need for skilled personnel.26 Alternatives such as ventilation-perfusion scintigraphy and single-photon emission computed tomography suffer from poor spatial resolution and long acquisition times.27 Computed tomography (CT) has traditionally been limited to structural lung imaging, though recent advances have broadened its use, with Functional Respiratory Imaging (FRI) one such example. FRI is a clinically validated technique that combines information extracted from CT scans taken at two breathing levels – total lung capacity (TLC) and functional residual capacity (FRC) – and computational fluid dynamics simulations to derive structural and functional parameters such as airway size and volume, regional ventilation and ventilation heterogeneity.28–30 FRI has been successfully applied in a variety of patient cohorts including those with asthma,21,31,32 chronic obstructive pulmonary disease (COPD),33–40 cystic fibrosis41,42 and bronchopulmonary dysplasia,43 and has been shown to be more sensitive to regional changes in the respiratory system compared to conventional lung function measures.35,39,44
The purpose of this prospective study is to determine whether BT leads to an improvement in ventilation heterogeneity as measured using FRI. In the context of BT, as most, if not all, patients with severe asthma require a chest CT to exclude other differentials as part of their work-up, there is minimal inconvenience to patients in using this modality to study lung ventilation. Moreover, successful detection of changes in ventilation heterogeneity using FRI may provide a means of assessing response to therapy and identifying suitable patients, not only in the application of BT but also other relevant interventions.
Methods
Participants
This study was approved by the Peninsula Health Human Research Ethics Committee and conducted in accordance with The Code of Ethics of the World Medical Association (Declaration of Helsinki). Participants were prospectively recruited from a tertiary hospital severe asthma clinic and provided written informed consent. Eligible participants had to be aged 18 years and above; have a diagnosis of severe asthma as defined by the European Respiratory Society/American Thoracic Society (ERS/ATS); and be scheduled for a clinically indicated BT by their treating physician.4 Specifically, all participants selected for BT had to have evidence of uncontrolled asthma such as (i) high symptom burden; (ii) Asthma Control Questionnaire (ACQ) ≥2; and (iii) frequent (≥2) oral corticosteroid (OCS) requiring exacerbations of asthma in the preceding 12 months despite treatment with guideline suggested medications for Global Initiative for Asthma (GINA) Step 4–5 asthma (combination high-dose ICS and long-acting beta agonist, and/or long-acting muscarinic antagonist, oral corticosteroids or asthma biologics) for at least 12 months.3
Exclusion criteria were participants with alternative respiratory conditions such as COPD or bronchiectasis, females who were pregnant or lactating, participants aged less than 18 years, or those who were unwilling to undergo serial CT imaging as described in the subsequent imaging section, or were unable to provide informed consent.
Bronchial Thermoplasty Procedure
BT was performed using the Alair Bronchial Thermoplasty System (Boston Scientific) under general anesthesia by an experienced bronchoscopist. All participants received 50mg oral prednisolone three days prior to the procedure and were routinely observed overnight in hospital post-procedure. For the purpose of this study, the schedule of the BT procedures was altered in a novel way in order to achieve an internal control at the mid-treatment timepoint: one treated lung (left side) and one untreated lung (right side). The left lower lobe was treated in the first session, followed by the left upper lobe in the second session. The right upper and lower lobes were treated in the third session (Figure 1A).
 |
Figure 1 Timeline and methodology. (A) Timeline for treatment and assessment. (B–C) Functional respiratory imaging derived regional ventilation map showing (B) homogeneous ventilation in a healthy subject, and (C) ventilation heterogeneity in a subject with severe asthma. (D) Schematic representation of expected changes in the ventilation histogram before (solid line) and after (dotted line) BT. The diagram illustrates a reduction in spread or standard deviation in the post-BT histogram, signifying a reduction in ventilation heterogeneity after BT. Abbreviations: ACQ, asthma control questionnaire; BT, bronchial thermoplasty; CT, computed tomography of the chest; LLL, left lower lobe; LUL, left upper lobe; RLL, right lower lobe; RUL, right upper lobe. |
Clinical Measurements
Data collected included demographics, height, weight, asthma medication usage, asthma exacerbation frequency, lung function parameters and the 5-item ACQ. Data were collected at baseline and 12 months after completion of BT. Changes in the following key clinical outcomes at 12 months were examined: (i) ACQ; (ii) pre-bronchodilator FEV1; (iii) Short-acting β-agonist (SABA) usage (measured in puffs/day); (iv) daily maintenance OCS dose (mg/day of prednisolone); (v) number of OCS-requiring exacerbations of asthma in the past 6 months. Assessments were performed by experienced clinical research personnel independent of the procedural team. Pre- and post-bronchodilator spirometry was performed in the morning using the Jaeger Masterscreen Body (CareFusion, Hochberg, Germany). Subjects withheld their usual bronchodilators for 12–24hrs prior to testing. Diffusion capacity of the lung for carbon monoxide (DLCO) and plethysmographic lung volumes were also measured. All equipment was calibrated on the morning of testing, with tests conducted in accordance with ERS/ATS standards. Predicted value equations were taken from the Global Lung Initiative.45,46
Functional Respiratory Imaging
Non-contrast CT was performed in a 128-slice Siemens Definition AS+ scanner with the following settings – helical slice thickness of 0.6mm, rotation time of 0.6s, detector coverage of 38.4mm, and tube voltage of 100kV – consistent with prior published technique for FRI.29 Two breath-hold scans were performed on each occasion – one at TLC, and the other at FRC. Participants were extensively coached in the breath-hold maneuvers, and a member of the research team was present throughout the scan. Imaging visits were conducted at baseline (V1), 4-weeks after completion of treatment of the left lung (V2), and 12-months after treatment of the right lung (V3) (Figure 1A). The timing of V3 was chosen in discussion with our Ethics Committee to limit the annual radiation exposure per patient. Imaging was performed pre-bronchodilator, and prior to commencement of pre-procedural oral prednisolone.
Post-acquisition, CT images were segmented and reconstructed into participant-specific 3D computer models of the lung lobes and airway structure using Mimics (Materialise, Leuven, Belgium), a commercial medical imaging processing software package. FRI analyses were then independently performed by FLUIDDA (Kontich, Belgium). As previously mentioned, FRI is a clinically validated computational work-flow in which functional data are added to respiratory anatomical images using computational fluid dynamics.28–30 CT images taken at TLC and FRC are used to generate tissue deformation maps, from which local ventilation maps are calculated by using the Jacobian determinant of deformation, a measure of tissue expansion (Figure 1B–C). Ventilation was quantified using dimensionless relative ventilation, and reported at a lung level, ie, right lung, left lung and both lungs. Values greater than one denote an absolute expansion between expiration and inhalation. The ventilation distribution was also assessed by analyzing the ventilation histograms at a lung level. The shape and position of the curves compared against each other provides information on the change in ventilation distribution over time. From these histograms, standard heterogeneity parameters such as kurtosis, skewness, and interquartile distance (IQD; defined as the inter-quartile range divided by the mean) can be calculated (Figure 1D). Collectively, these three parameters provide information on ventilation heterogeneity.
Statistical Analysis
SPSS Version 28 (IBM corporation, New York, USA) was used for all statistical analyses. Continuous variables were assessed for normality using the Shapiro–Wilk test and summarized using mean, median, standard deviation or interquartile range according to their distribution. Categorical variables are presented as number and percentage. Group comparison was performed using χ2 or Fisher’s exact test for categorical variables and Student’s t-test or Mann–Whitney U-test for continuous variables. Repeated measurements were analysed using paired t-test or Wilcoxon signed-rank test. Correlation analyses were conducted using either Pearson or Spearman correlation. A p value of <0.05 was considered statistically significant.
Results
Baseline Characteristics
Eighteen consecutive participants (7 males and 11 females) with severe asthma who underwent BT were included in this study. All participants completed 12-month follow-up. The mean age was 59.8 ± 14.7 years and the mean body mass index was 31.9 ± 7.1 kg/m2. None of the participants were active smokers – 10 never smokers; 2 with a <10 packet year history; and 6 with a >10 packet year history. At the time of the 1st BT session, 13 participants were not on any biological therapy for asthma. This included 4 participants who discontinued biologic therapy due to lack of efficacy. Three participants were on mepolizumab and 2 on benralizumab (Table 1).
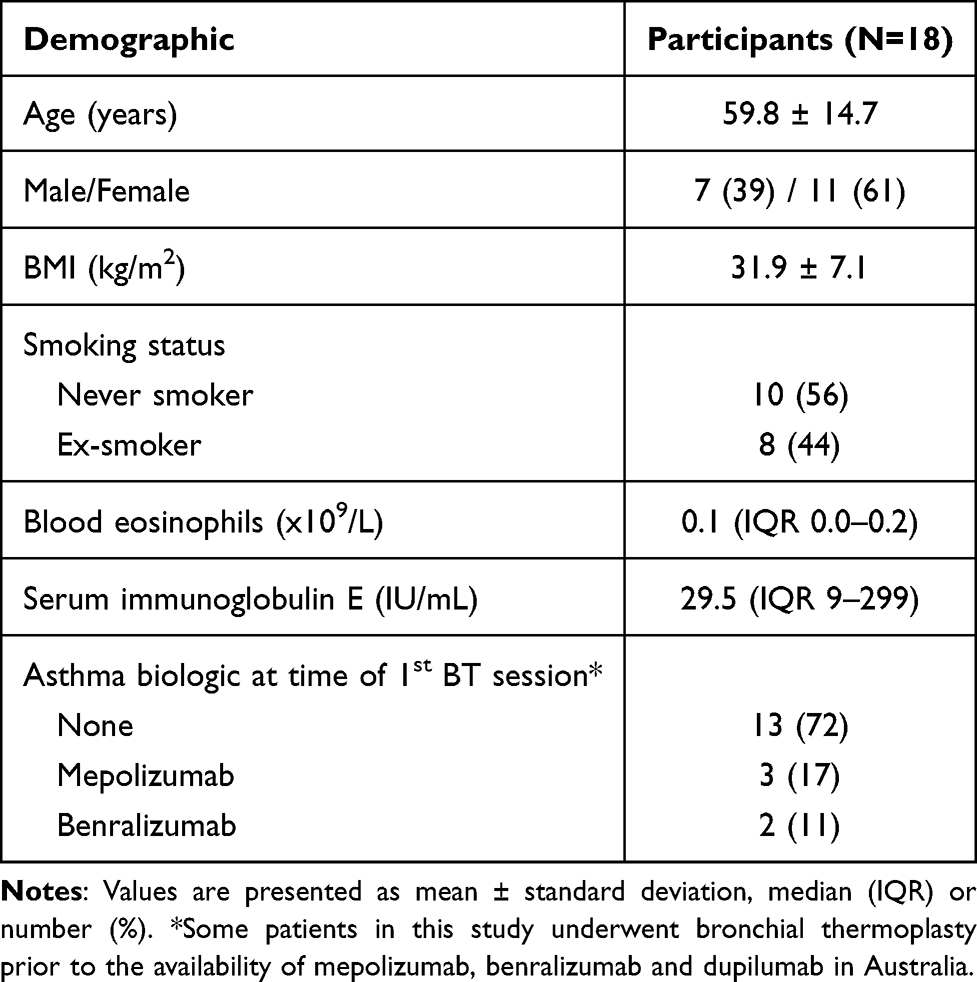 |
Table 1 Patient Characteristics |
Participants were highly symptomatic with a median ACQ of 3.3 (2.7–4.2) despite using triple inhaler therapy with beclomethasone-equivalent ICS dose 1722 ± 826 ug/day. Fifteen (83%) were also taking maintenance oral prednisolone, with a group median dose 7.5 (5–25) mg/day. The median daily requirement for SABA therapy was 11 (8–20) puffs/day. The frequency of OCS requiring exacerbations in the 6 months before BT was 2 (1–3.8).
The mean pre-bronchodilator FEV1 was 45.7 ± 14.0% predicted, with an average improvement of 12.6 ± 13.3% post 400ug of salbutamol. Vital capacity (FVC) was 73.0 ± 14.1% predicted, and forced expiratory ratio (FER) was 51.0 ± 12.1%. The mean DLCO per unit lung volume (KCO) was 90.8 ± 28.7% predicted. Static lung volumes showed marked gas trapping with a mean residual volume (RV) of 152.3 ± 40.2% predicted. RV contributed 53.4% ± 10.6% of the TLC.
The BT procedure was generally well tolerated, with no unexpected complications. The average number of radio-frequency activations delivered was 195 ± 43.8 per patient.
Post Treatment Outcomes
Twelve months after completion of BT, there were significant improvements in ACQ, SABA usage, maintenance OCS dose, and number of OCS-requiring exacerbations compared to baseline. The median ACQ had reduced from 3.3 (2.7–4.2) to 1.9 (1.1–2.7) (p<0.001). Although seven (39%) patients failed to demonstrate an improvement in ACQ of greater than 0.5 units, the minimal clinically important difference, all of them showed improvement in other key clinical outcome measures. The requirement for SABA rescue therapy had reduced from a median of 11 (8–20) puffs/day to 2.5 (1.3–6.8) puffs/day (p<0.001). All 15 patients who required maintenance OCS at baseline were able to reduce their daily OCS dose, with a median reduction from 7.5 (5–25) mg/day to 4.5 (0–10) mg/day (p=0.002). This included 5 (33%) patients who were able to be completely weaned off maintenance OCS. The number of OCS-requiring exacerbations decreased from a median of 2 (1–3.8) at baseline, to 0 (0–1.8) at follow-up (p=0.01). A summary is provided in Table 2.
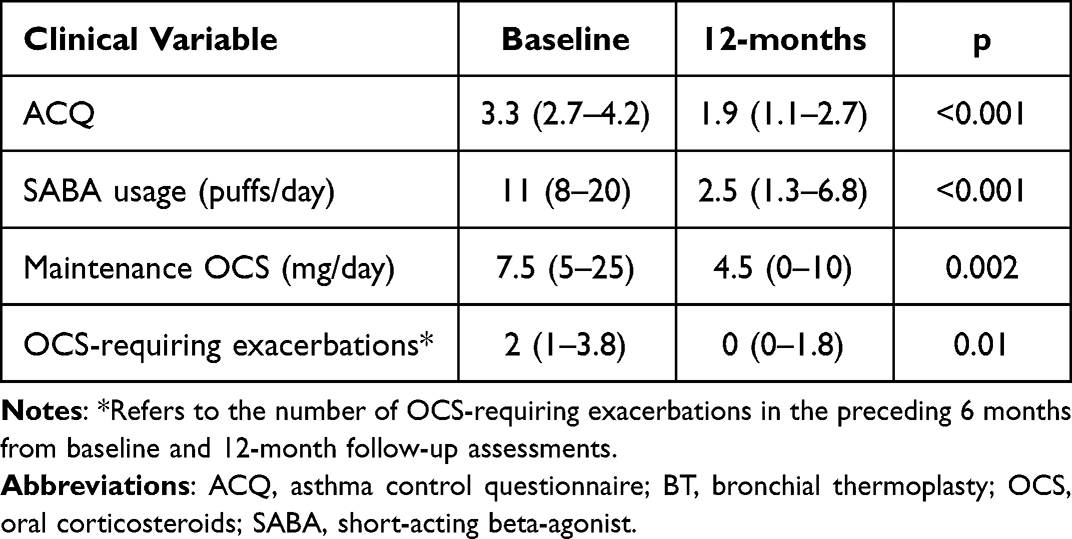 |
Table 2 Key Clinical Outcomes Pre and Post BT |
Lung Function
There was a significant improvement in pre-bronchodilator FEV1 after treatment from 45.7 ± 14.0% to 51.4 ± 15.6% predicted (mean difference 5.7, CI 1.1 to 10.3, p=0.02). As shown in Table 3, other static and dynamic measures of lung function including FVC, FER, RV, TLC, RV/TLC ratio, and KCO were unchanged.
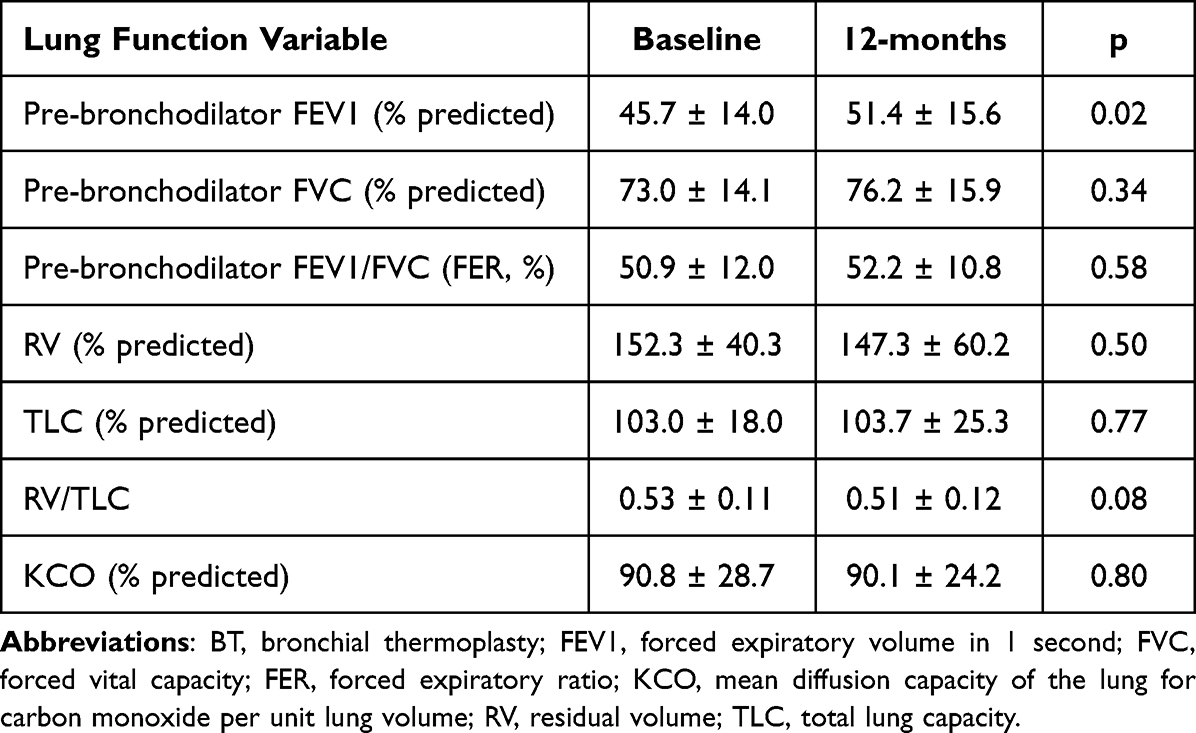 |
Table 3 Lung Function Pre and Post BT |
Ventilation and Ventilation Heterogeneity
Ventilation heterogeneity as assessed by FRI was also observed to improve after BT. Ventilation histograms were compared between baseline (V1), 4-week after treatment of the left lung (V2) and 12-month after treatment of the right lung (V3) (Figure 2). A significant reduction in IQD was observed in the left lung (IQDLL) at V2 (0.18 ± 0.04) compared to V1 (0.20 ± 0.04, p=0.045), suggesting an improvement in ventilation heterogeneity in the left lung 4 weeks after it was treated. The IQD remained unchanged between V2 and V1 in the untreated right lung (IQDRL; 0.19 ± 0.04 vs 0.19 ± 0.05, p = 0.69). Between V3 and V2, there was also a trend towards an improvement in IQD in the right lung (IQDRL; 0.18 ± 0.05 vs 0.19 ± 0.04, p=0.06), corresponding to the period during which the right lung was treated, with no detectable change in IQDLL over the same period (0.18 ± 0.05 vs 0.18 ± 0.04, p=0.63). When comparing changes in IQD between V3 and V1, significant differences were noted in the left lung (0.18 ± 0.05 vs 0.20 ± 0.04, p=0.028), but not in the right (0.18 ± 0.05 vs 0.19 ± 0.05, p=0.36). No difference was observed in kurtosis or skewness between any time points. Mean CT-derived ventilation values also showed no change over time (Table 4). A representative example of the improvements in ventilation heterogeneity in a study participant is illustrated in Figure 3.
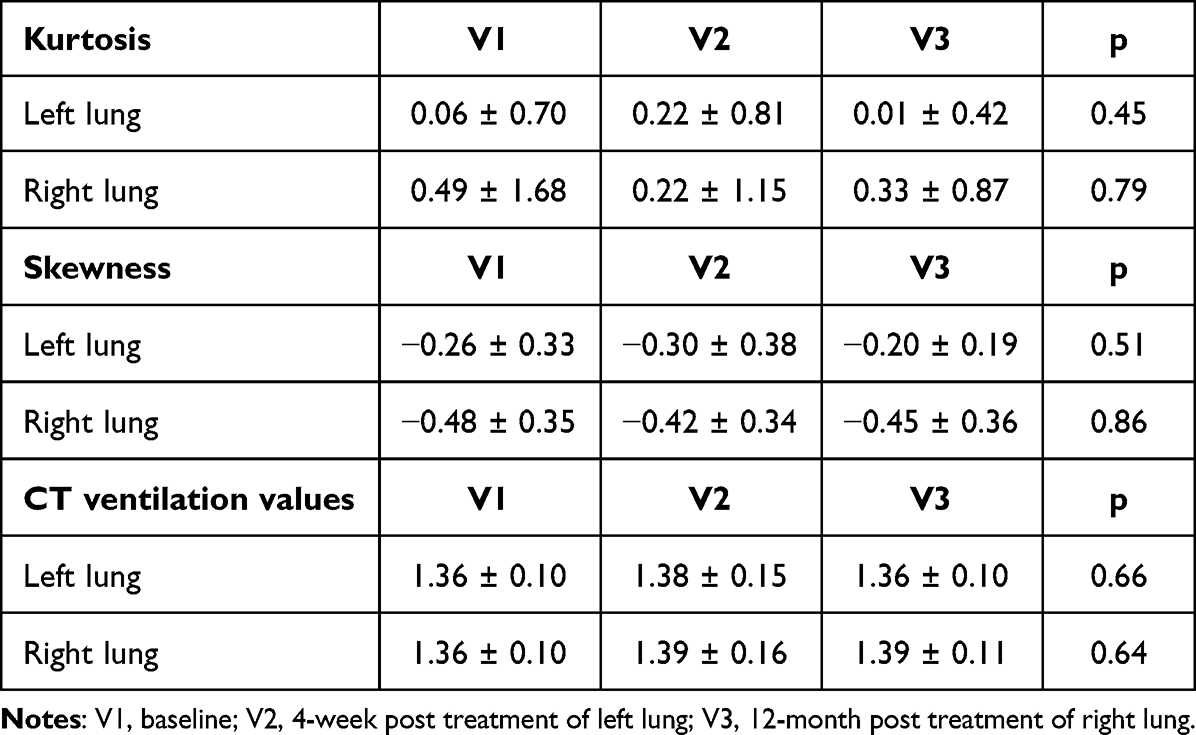 |
Table 4 Kurtosis, Skewness and CT-Derived Ventilation Values at V1, V2 and V3 |
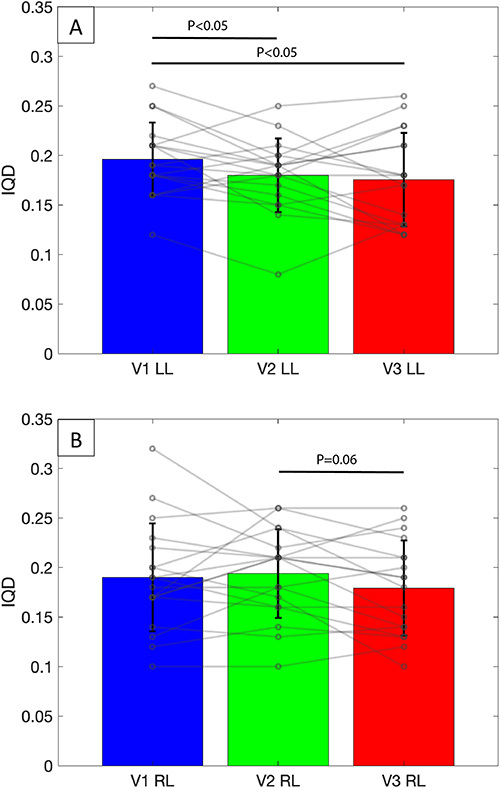 |
Figure 2 IQD values reported at the lung level across various timepoints. Bars and error bars represent mean and standard deviation. Open circle represents individual data-points. (A) Mean IQD significantly decreased after treatment of the left lung, with treatment effect persisting up to 12 months after BT. (B) There was a trend towards a significant decrease in IQD after treatment of the right lung, with no other significant changes noted across timepoints. Abbreviations: IQD, interquartile distance of the ventilation histogram; V1, baseline; V2, 4-week post treatment of left lung; V3, 12-month post treatment of right lung; LL, left lung; RL, right lung. |
 |
Figure 3 Graphical illustration of ventilation maps at various timepoints from a representative patient. A decrease in ventilation heterogeneity is apparent visually by more regions nearing average ventilation (green and yellow), rather than interspersed regions of high (red) and low (blue) ventilation. Note the improvement in ventilation heterogeneity of the left lung between V2 and V1, and of the right lung between V3 and V2. V1, baseline; V2, 4-week post treatment of left lung; V3, 12-month post treatment of right lung. |
Correlations with clinical and spirometric variables
The relationships between ΔIQD in both lungs (ΔIQDTotal) and various clinical and spirometric variables were also explored, with Δ defined as the change between post-treatment and baseline, ie, V3 minus V1. Significant correlations were found between ΔIQDTotal and baseline ACQ (r=−0.52, p=0.028), ΔFEV1 (r=0.51, p=0.03), ΔFVC (r=0.56, p=0.02), ΔRV (r=−0.70, p=0.001), ΔRV/TLC (r=−0.75, p<0.001). No other significant correlations were identified.
Discussion
This is the first study to assess changes in ventilation heterogeneity using FRI in patients undergoing BT. In this study, we demonstrated an improvement in ventilation heterogeneity, as reflected by a reduction in IQD, along with clinical improvements after BT. These findings are consistent with mathematical modelling of the physiological behavior of the asthmatic lung when subjected to BT, namely that improvements in ventilation heterogeneity are expected, particularly at higher levels of ASM activation.17
Patients recruited in this study were severely affected by their asthma. They all had persistent lung function impairment, high symptom burden and frequent exacerbations despite being on GINA step 4–5 treatment. Moreover, just over 80% of patients required maintenance OCS. Following BT, all patients experienced a significant and substantive improvement in ACQ, SABA use, maintenance OCS dose and OCS-requiring exacerbations, findings consistent with published literature.9–12 Despite this, with the exception of pre-bronchodilator FEV1, no significant improvement in static or dynamic lung function was observed. While it is generally accepted that the effects of BT are not captured by spirometry,9–11,15,16 we have previously shown that it improves gas trapping,25 a finding not replicated in this study due to the smaller sample size.
Three measures of ventilation heterogeneity – kurtosis, skewness, and IQD – were derived from ventilation histograms and utilized in this study. Of these, IQD was felt to be the most sensitive as it corresponds to the spread of ventilation, and is therefore expected to decrease as ventilation becomes more homogeneous after BT. Indeed, this was seen in the current study where IQD, but not kurtosis or skewness, showed a pattern of change consistent with the treatment protocol. Specifically, a statistically significant decrease in IQDLL was found between V2 and V1, coinciding with when the left lung was treated, an effect persisting up to V3 (12 months post BT). IQDRL was also observed to decrease between V3 and V2, corresponding to the treatment of the right lung, although this trend did not reach statistical significance (p=0.06) and there was also no difference between V3 and V1. Given IQDRL is a whole-lung measurement that included the untreated right middle lobe, these non-significant results may be due to dilution of the treatment effect. The lack of a significant change in IQD between timepoints when no treatment was provided (ie, between V2 and V1 for IQDRL, and between V3 and V2 for IQDLL) is reassuring as it serves as an internal control and provides support to the scientific validity of this methodology. These findings, together with prior data demonstrating an increase in airway volume post BT,16–19 provide further evidence that structural changes in the treated large airways can induce functional changes in the untreated smaller airways.17
A significant negative correlation was found between ΔIQDTotal and baseline ACQ, suggesting that patients who were most symptomatic at baseline derived the greatest improvement in ventilation heterogeneity after treatment, an observation in keeping with previous modelling.17 The inverse correlation between ΔRV/TLC (gas trapping) and ΔIQDTotal was, however, unexpected, potentially favouring worse ventilation heterogeneity in patients with greater improvement in gas trapping. This appears counter-intuitive as one might expect the benefits of BT to simultaneously manifest as a more homogeneous ventilation re-distribution as well as reduced gas trapping. We hypothesize that lung volume recruitment (from reduced gas-trapping) may instead produce a greater spread in ventilation, where air moves between previously trapped units and the broader lung. As FRI is only able to provide an indirect assessment of ventilation, these changes might have gone undetected. A similar explanation can be evoked for the positive correlations between ΔIQDTotal and ΔFEV1 and ΔFVC, which are also impacted by gas trapping. As this is purely speculative, further studies will be required to confirm or refute this hypothesis.
The present findings also offer lessons beyond BT regarding the ways in which we assess treatment efficacy in asthma. BT has, since inception, been controversial in part because consistent improvements appear in patient-reported measures (eg, asthma control or quality of life questionnaires) and indirect outcomes like rescue-medication use, but not in traditional spirometric assessment (eg, FEV1). Despite a sham-controlled trial11 and several large longitudinal studies demonstrating the long-term clinical effectiveness of BT,12–15 many still believe its effects are placebo driven. The present study adds to the growing body of evidence, including CT-derived airway volume changes18–21 and esophageal manometry measured lung mechanics (compliance and resistance),47 that BT does in fact induce non-placebo physiological changes that are apparently not readily captured using spirometry or impulse oscillometry.48,49 We should therefore bear in mind that although it remains the current gold standard, FEV1 is not sensitive to some physiological changes that nonetheless improve patient quality of life, and that this may also be the case for other therapies. Against this backdrop, we believe that functional lung imaging, of which FRI is one modality, offers an alternate and complementary tool for assessing therapeutic response not only in asthma but also in other lung conditions.
Interpretation of the results of this study is limited by the small sample size, restriction to a single center, and lack of a comparative control group. Additionally, there are inherent biases associated with the use of symptom scores, which may be influenced by patient factors. It is worth noting that the present FRI methodology makes use of a pair of CT scans at each timepoint in order to infer, computationally, the ventilation distribution implied by the changes observed between FRC and TLC. The dual CT approach allows assessment that is not traditionally available with a single CT scan at TLC. While BT patients generally undergo CT as part of their pre-treatment workup, the need for a scan pair does impose some additional cost in terms of time and radiation exposure. Additionally, although patients were extensively coached in the breathing maneuvers during CT scanning, concomitant volume measures with spirometry were not utilized. Lastly, FRI only provides an indirect assessment of ventilation distribution and heterogeneity, with the potential to be less sensitive than other techniques that are able to directly probe lung ventilation, eg, hyperpolarized gas magnetic resonance imaging. Despite these limitations, the low cost (most centers would already have CT scanning capabilities) and ease of incorporating FRI into current workflows are advantages that could see more widespread use of this technique in the study of other pulmonary conditions and/or treatment effects for which spirometry may be insensitive.
Conclusion
Clinical benefits after BT are accompanied by improvements in ventilation heterogeneity as measured by FRI. This finding is consistent with current mathematical modelling and advances our understanding of the mechanisms of action of BT.
Acknowledgments
The authors would like to thank Peninsula Health, Eastern Health and Monash University for supporting this research work.
Funding
This work was supported by the National Australian Health and Medical Research Council (NHMRC Grant number APP1180854), for which P.N is the grant holder. C.F is the recipient of a Monash University post-graduate scholarship.
Disclosure
The authors declare that they have no competing interests in this work.
References
1. Global Burden of Disease Collaborative Network. Global burden of 369 diseases and injuries in 204 countries and territories, 1990–2019: a systematic analysis for the Global Burden of Disease Study 2019. Lancet. 2020;396(10258):1204–1222. doi:10.1016/S0140-6736(20)30925-9
2. James AL, Bai TR, Mauad T, et al. Airway smooth muscle thickness in asthma is related to severity but not duration of asthma. Eur Respir J. 2009;34(5):1040–1045. doi:10.1183/09031936.00181608
3. Global Initiative for Asthma. GINA report, global strategy for asthma management and prevention (2021 update); 2021.
4. Chung KF, Wenzel SE, Brozek JL, et al. International ERS/ATS guidelines on definition, evaluation and treatment of severe asthma. Eur Respir J. 2014;43(2):343–373. doi:10.1183/09031936.00202013
5. Holguin F, Cardet JC, Chung KF, et al. Management of severe asthma: a European respiratory society/American thoracic society guideline. Eur Respir J. 2020;55(1):1900588. doi:10.1183/13993003.00588-2019
6. Pretolani M, Dombret MC, Thabut G, et al. Reduction of airway smooth muscle mass by bronchial thermoplasty in patients with severe asthma. Am J Respir Crit Care Med. 2014;190(12):1452–1454. doi:10.1164/rccm.201407-1374LE
7. Pretolani M, Bergqvist A, Thabut G, et al. Effectiveness of bronchial thermoplasty in patients with severe refractory asthma: clinical and histopathologic correlations. J Allergy Clin Immunol. 2017;139(4):1176–1185. doi:10.1016/j.jaci.2016.08.009
8. Chakir J, Haj-Salem I, Gras D, et al. Effects of bronchial thermoplasty on airway smooth muscle and collagen deposition in asthma. Ann Am Thorac Soc. 2015;12(11):1612–1618. doi:10.1513/AnnalsATS.201504-208OC
9. Pavord ID, Cox G, Thomson NC, et al. Safety and efficacy of bronchial thermoplasty in symptomatic, severe asthma. Am J Respir Crit Care Med. 2007;176(12):1185–1191. doi:10.1164/rccm.200704-571OC
10. Cox G, Thomson NC, Rubin AS, et al. Asthma control during the year after bronchial thermoplasty. N Engl J Med. 2007;356(13):1327–1337. doi:10.1056/NEJMoa064707
11. Castro M, Rubin AS, Laviolette M, et al. Effectiveness and safety of bronchial thermoplasty in the treatment of severe asthma: a multicenter, randomized, double-blind, sham-controlled clinical trial. Am J Respir Crit Care Med. 2010;181(2):116–124. doi:10.1164/rccm.200903-0354OC
12. Hashmi MD, Khan A, Shafiq M. Bronchial thermoplasty: state of the art. Respirology. 2022;27(9):720–729. doi:10.1111/resp.14312
13. Chaudhuri R, Rubin A, Sumino K, et al. Safety and effectiveness of bronchial thermoplasty after 10 years in patients with persistent asthma (BT10+): a follow-up of three randomised controlled trials. Lancet Respir Med. 2021;9(5):457–466. doi:10.1016/S2213-2600(20)30408-2
14. Pavord ID, Thomson NC, Niven RM, et al. Safety of bronchial thermoplasty in patients with severe refractory asthma. Ann Allergy Asthma Immunol. 2013;111(5):402–407. doi:10.1016/j.anai.2013.05.002
15. Chupp G, Laviolette M, Cohn L, et al. Long-term outcomes of bronchial thermoplasty in subjects with severe asthma: a comparison of 3-year follow-up results from two prospective multicentre studies. Eur Respir J. 2017;50(2):1700017. doi:10.1183/13993003.00017-2017
16. Langton D, Wang W, Sha J, et al. Predicting the response to bronchial thermoplasty. J Allergy Clin Immunol Pract. 2020;8(4):1253–60 e2. doi:10.1016/j.jaip.2019.10.034
17. Donovan GM, Elliot JG, Green FHY, James AL, Noble PB. Unraveling a clinical paradox: why does bronchial thermoplasty work in asthma? Am J Respir Cell Mol Biol. 2018;59(3):355–362. doi:10.1165/rcmb.2018-0011OC
18. Konietzke P, Weinheimer O, Wielputz MO, et al. Quantitative CT detects changes in airway dimensions and air-trapping after bronchial thermoplasty for severe asthma. Eur J Radiol. 2018;107:33–38. doi:10.1016/j.ejrad.2018.08.007
19. Langton D, Banks C, Noble PB, Plummer V, Thien F, Donovan GM. The effect of bronchial thermoplasty on airway volume measured 12 months post-procedure. ERJ Open Res. 2020;6(4):00300–2020. doi:10.1183/23120541.00300-2020
20. Langton D, Bennetts K, Noble P, Plummer V, Thien F. Bronchial thermoplasty reduces airway resistance. Respir Res. 2020;21(1):76. doi:10.1186/s12931-020-1330-5
21. Langton D, Sloan G, Banks C, Bennetts K, Plummer V, Thien F. Bronchial thermoplasty increases airway volume measured by functional respiratory imaging. Respir Res. 2019;20(1):157. doi:10.1186/s12931-019-1132-9
22. Hall CS, Quirk JD, Goss CW, et al. Single-session bronchial thermoplasty guided by Xe-129 magnetic resonance imaging a pilot randomized controlled clinical trial. Am J Respir Crit Care Med. 2020;202(4):524–534. doi:10.1164/rccm.201905-1021OC
23. Thomen RP, Sheshadri A, Quirk JD, et al. Regional ventilation changes in severe asthma after bronchial thermoplasty with (3)He MR imaging and CT. Radiology. 2015;274(1):250–259. doi:10.1148/radiol.14140080
24. Langton D, Bennetts K, Thien F, Plummer V, Noble PB. Bronchial thermoplasty reduces ventilation heterogeneity measured by multiple breath nitrogen washout. Respir Res. 2020;21(1):308. doi:10.1186/s12931-020-01575-x
25. Langton D, Ing A, Bennetts K, et al. Bronchial thermoplasty reduces gas trapping in severe asthma. BMC Pulm Med. 2018;18(1):155. doi:10.1186/s12890-018-0721-6
26. Stewart NJ, Smith LJ, Chan HF, et al. Lung MRI with hyperpolarised gases: current & future clinical perspectives. Br J Radiol. 2021;95(1132):20210207. doi:10.1259/bjr.20210207
27. Bourhis D, Robin P, Essayan M, et al. V/Q SPECT for the assessment of regional lung function: generation of normal mean and standard deviation 3-D maps. Front Med. 2020;7:143. doi:10.3389/fmed.2020.00143
28. Tahir BA, Van Holsbeke C, Ireland RH, et al. Comparison of CT-based lobar ventilation with 3He MR imaging ventilation measurements. Radiology. 2016;278(2):585–592. doi:10.1148/radiol.2015142278
29. De Backer JW, Vos WG, Vinchurkar SC, et al. Validation of computational fluid dynamics in CT-based airway models with SPECT/CT. Radiology. 2010;257(3):854–862. doi:10.1148/radiol.10100322
30. Stern F, Wilson RV, Coleman HW, Paterson EG. Comprehensive approach to verification and validation of CFD simulations - Part 1: methodology and procedures. J Fluids Eng. 2001;123(4):793–802. doi:10.1115/1.1412235
31. De Backer J, Van Holsbeke C, Vos W, et al. Assessment of lung deposition and analysis of the effect of fluticasone/salmeterol hydrofluoroalkane (HFA) pressurized metered dose inhaler (pMDI) in stable persistent asthma patients using functional respiratory imaging. Expert Rev Respir Med. 2016;10(8):927–933. doi:10.1080/17476348.2016.1192464
32. De Backer JW, Vos WG, Devolder A, et al. Computational fluid dynamics can detect changes in airway resistance in asthmatics after acute bronchodilation. J Biomech. 2008;41(1):106–113. doi:10.1016/j.jbiomech.2007.07.009
33. Bonte S, Lanclus M, Van Holsbeke C, De Backer J. Functional Respiratory Imaging (FRI) shows significant regional ventilation defects in COPD patients as compared to healthy data. Eur Respir J. 2020;56(suppl 64):2085.
34. De Backer J, Vos W, Vinchurkar S, et al. The effects of extrafine beclometasone/formoterol (BDP/F) on lung function, dyspnea, hyperinflation, and airway geometry in COPD patients: novel insight using functional respiratory imaging. J Aerosol Med Pulm Drug Deliv. 2015;28(2):88–99. doi:10.1089/jamp.2013.1064
35. De Backer W, De Backer J, Verlinden I, et al. Functional respiratory imaging assessment of glycopyrrolate and formoterol fumarate metered dose inhalers formulated using co-suspension delivery technology in patients with COPD. Ther Adv Respir Dis. 2020;14:1753466620916990. doi:10.1177/1753466620916990
36. De Backer W, De Backer J, Vos W, et al. A randomized study using functional respiratory imaging to characterize bronchodilator effects of glycopyrrolate/formoterol fumarate delivered by a metered dose inhaler using co-suspension delivery technology in patients with COPD. Int J Chron Obstruct Pulmon Dis. 2018;13:2673–2684. doi:10.2147/COPD.S171707
37. Hajian B, De Backer J, Vos W, Van Holsbeke C, Clukers J, De Backer W. Functional respiratory imaging (FRI) for optimizing therapy development and patient care. Expert Rev Respir Med. 2016;10(2):193–206. doi:10.1586/17476348.2016.1136216
38. van Geffen WH, Hajian B, Vos W, et al. Functional respiratory imaging: heterogeneity of acute exacerbations of COPD. Int J Chron Obstruct Pulmon Dis. 2018;13:1783–1792. doi:10.2147/COPD.S152463
39. Vos W, De Backer J, Poli G, et al. Novel functional imaging of changes in small airways of patients treated with extrafine beclomethasone/formoterol. Respiration. 2013;86(5):393–401. doi:10.1159/000347120
40. Vos W, Hajian B, De Backer J, et al. Functional respiratory imaging to assess the interaction between systemic roflumilast and inhaled ICS/LABA/LAMA. Int J Chron Obstruct Pulmon Dis. 2016;11:263–271. doi:10.2147/COPD.S93830
41. Lauwers E, Belmans D, Mignot B, et al. The short-term effects of ORKAMBI (lumacaftor/ivacaftor) on regional and distal lung structures using functional respiratory imaging. Ther Adv Respir Dis. 2021;15:17534666211046774. doi:10.1177/17534666211046774
42. Lauwers E, Snoeckx A, Ides K, et al. Functional respiratory imaging in relation to classical outcome measures in cystic fibrosis: a cross-sectional study. BMC Pulm Med. 2021;21(1):256. doi:10.1186/s12890-021-01622-3
43. Vanhaverbeke K, Slaats M, Al-Nejar M, et al. Functional respiratory imaging provides novel insights into the long-term respiratory sequelae of bronchopulmonary dysplasia. Eur Respir J. 2021;57(6):2002110. doi:10.1183/13993003.02110-2020
44. De Backer LA, Vos WG, Salgado R, et al. Functional imaging using computer methods to compare the effect of salbutamol and ipratropium bromide in patient-specific airway models of COPD. Int J Chron Obstruct Pulmon Dis. 2011;6:637–646. doi:10.2147/COPD.S21917
45. Stanojevic S, Graham BL, Cooper BG, et al. Official ERS technical standards: global lung function initiative reference values for the carbon monoxide transfer factor for Caucasians. Eur Respir J. 2017;50(3):1700010. doi:10.1183/13993003.00010-2017
46. Quanjer PH, Stanojevic S, Cole TJ, et al. Multi-ethnic reference values for spirometry for the 3-95-yr age range: the global lung function 2012 equations. Eur Respir J. 2012;40(6):1324–1343. doi:10.1183/09031936.00080312
47. Baydur A, Barbers R, May D. Effect of bronchial thermoplasty on static and dynamic lung compliance and resistance in patients with severe persistent asthma. Respir Med. 2023;217:107341. doi:10.1016/j.rmed.2023.107341
48. Langton D, Ing A, Sha J, et al. Measuring the effects of bronchial thermoplasty using oscillometry. Respirology. 2019;24(5):431–436. doi:10.1111/resp.13439
49. Henry C, Biardel S, Boucher M, et al. Bronchial thermoplasty attenuates bronchodilator responsiveness. Respir Med. 2023;217:107340. doi:10.1016/j.rmed.2023.107340
 © 2024 The Author(s). This work is published and licensed by Dove Medical Press Limited. The
full terms of this license are available at https://www.dovepress.com/terms
and incorporate the Creative Commons Attribution
- Non Commercial (unported, 3.0) License.
By accessing the work you hereby accept the Terms. Non-commercial uses of the work are permitted
without any further permission from Dove Medical Press Limited, provided the work is properly
attributed. For permission for commercial use of this work, please see paragraphs 4.2 and 5 of our Terms.
© 2024 The Author(s). This work is published and licensed by Dove Medical Press Limited. The
full terms of this license are available at https://www.dovepress.com/terms
and incorporate the Creative Commons Attribution
- Non Commercial (unported, 3.0) License.
By accessing the work you hereby accept the Terms. Non-commercial uses of the work are permitted
without any further permission from Dove Medical Press Limited, provided the work is properly
attributed. For permission for commercial use of this work, please see paragraphs 4.2 and 5 of our Terms.
Recommended articles
A Case Series of Patients Undergoing Bronchial Thermoplasty a Second Time for Severe Asthma
Foo CT, Langton D, Thien F
Journal of Asthma and Allergy 2024, 17:1239-1245
Published Date: 30 November 2024
Assessing Invasiveness of Ground-Glass Nodules Using Ternary-Class CT Radiomics Models: A Multi-Center Study with SHAP Explanations
Zhao P, Chen H, Gu H, Lin Y, Ma Y
Cancer Management and Research 2026, 18:602730
Published Date: 5 June 2026