Back to Journals » Cancer Management and Research » Volume 11
Bortezomib sensitivity is tissue dependent and high expression of the 20S proteasome precludes good response in malignant pleural mesothelioma
Authors Walter RFH ![]() , Sydow SR, Berg E, Kollmeier J, Christoph DC, Christoph S, Eberhardt WEE, Mairinger T, Wohlschlaeger J
, Sydow SR, Berg E, Kollmeier J, Christoph DC, Christoph S, Eberhardt WEE, Mairinger T, Wohlschlaeger J ![]() , Schmid KW
, Schmid KW ![]() , Mairinger FD
, Mairinger FD ![]()
Received 12 November 2018
Accepted for publication 22 July 2019
Published 24 September 2019 Volume 2019:11 Pages 8711—8720
DOI https://doi.org/10.2147/CMAR.S194337
Checked for plagiarism Yes
Review by Single anonymous peer review
Peer reviewer comments 3
Editor who approved publication: Dr Rituraj Purohit
Robert Fred Henry Walter,1,2 Saskia Roxanne Sydow,3 Erika Berg,3 Jens Kollmeier,4 Daniel Christian Christoph,5,6 Sandra Christoph,7 Wilfried Ernst Erich Eberhardt,1 Thomas Mairinger,4 Jeremias Wohlschlaeger,2 Kurt Werner Schmid,2 Fabian Dominik Mairinger2
1Ruhrlandklinik, West German Lung Center, University Hospital Essen, University of Duisburg-Essen, Essen, Germany; 2Institute of Pathology, University Hospital Essen, University of Duisburg-Essen, Essen, Germany; 3Institute of Pathology, Charité Universitaetsmedizin, Berlin, Germany; 4Institute of Pathology, Helios Klinikum Emil Von Behring, Berlin, Germany; 5Department of Oncology, University Hospital Essen, University of Duisburg-Essen, Essen, Germany; 6Department of Internistic Oncology, Kliniken Essen Mitte, Essen, Germany; 7Department of Bone Marrow Transplantation, West German Cancer Center, University Hospital Essen, University of Duisburg-Essen, Essen, Germany
Correspondence: Robert Fred Henry Walter
University Hospital Essenm, Institute of Pathology, Hufelandstraße 55, Essen D-45147, Germany
Tel +49 0 201/723 84828
Fax +49 0 201/723 3880
Email [email protected]
Background: Bortezomib is an approved proteasome inhibitor for the treatment of certain lymphoma subtypes. Two clinical trials investigated bortezomib in patients with malignant pleural mesothelioma (MPM) and failed to improve outcome. We present a potential explanation for this event.
Methods: 171 patients with MPM were analyzed for their mRNA expression of proteasomal subunits PSMA1, PSMA5, PSMB1, PSMB2, PSMB4 and PSMB5 via qPCR (n=84) or sequencing (n=87 TCGA/cBioPortal data set “Mesothelioma”). Outcome and subunit expression were correlated. Four mesothelial and one fibroblast cell line were treated with bortezomib and cisplatin. Cellular response was measured after 0, 6, 12, 24, 48 and 72 hrs. Enzyme activity of proteasomal subunits was assessed via functional enzyme activity assays.
Results: Patients with MPM presented with elevated expression of proteasomal subunits compared to benign controls (p<0.001). PSMB4 correlated with outcome (Cox propotiortional-hazards model (COXPH): p<0.0175, TCGA/cBioPortal data). In cell lines, apoptosis was the main event with a peak after 48 hr incubation for bortezomib or cisplatin. Only two cell lines with comparably low proteasome activity (PSMB2 and PSMB5) responded to 50 nM and 100 nM bortezomib better than to cisplatin (MRC-5, NCI-H2052). MSTO-211H responded to cisplatin only, whereas the other two cell lines were considered therapy resistant (Met-5A, NCI-H2452).
Interpretation: Two clinical trials testing bortezomib in MPM failed, although MPM presents with high proteasome expression, which predicts bortezomib sensitivity in several tumors. Bortezomib induced apoptosis in MPM cell lines with low proteasome activity only. Bortezomib is not suitable for the treatment of MPM, and biomarker-based stratification could have improved both clinical trials.
Trial registration: NCT00513877 and NCT00458913
Keywords: bortezomib, proteasome, malignant pleural mesothelioma, TCGA, biomarker
Introduction
Malignant pleural mesothelioma (MPM) is a highly aggressive tumor arising from the mesothelium-lined surfaces.1,2 In ~80% of MPM, a linkage to prior asbestos exposure is found.2,3 Three subtypes exist, namely epithelioid, sarcomatoid and biphasic MPM (mixed tumor of the previously mentioned subtypes).2,3 The epithelioid subtype is the most common entity and shows the most favorable outcome compared to the other subtypes.2,3 Current multimodal therapies contain radiotherapy, surgery and/or chemotherapy using platin compounds and pemetrexed in combination.3 However, MPM is considered as generally therapy resistant, leading to a median survival rate of approximately 1 year during standard first-line therapy with cis-/carboplatin plus pemetrexed.2
New therapy options are eagerly awaited: one target of interest is the proteasome that can be inhibited by bortezomib, which is a proteasome inhibitor that reversibly inhibits the PSMB5 (chymotrypsin-like) activity of the 20S proteasome complex.4 The proteasome is a large multicatalytic protease that recognizes, unfolds and degrades proteins, which were labeled for degradation.5 The ubiquitin–proteasome pathway regulates angiogenesis, cell cycle progression, DNA repair and apoptosis, and deregulation is a frequent event during cancerogenesis and maintenance.4,6 Bortezomib has been approved for the treatment of relapsed and refractory multiple myeloma7 and non-Hodgkin’s lymphoma subtypes4 and was tested in preclinical settings in MPM and showed cytotoxicity on MPM.2 Therefore, two Phase II studies were undertaken, but did not reach the desired endpoint.8,9 Both studies were single-arm, first/second-line therapy without the combination of cisplatin (NCT00513877) or first-line combining cisplatin and bortezomib (NCT00458913).10 The patients were not assessed for predictive biomarkers upfront, although elevated expression of the 20S proteasome seems to be a predictor for high sensitivity to bortezomib in human acute myeloid leukemia cell lines.7
Here we present a retrospective, explorative biomarker evaluation study testing proteasomal subunits in 84 patients with MPM via qPCR and further 87 patients from the TCGA/cBioPortal “Mesothelioma” dataset.11,12 The aim was to identify why bortezomib did not show the desired effect in the two clinical trials and to test if proteasomal subunit expression/activity can predict therapy response to bortezomib and cisplatin in cell lines.
Methods
Patient collective
The present retrospective study is based on a cohort of formalin-fixed, paraffin-embedded samples from 84 patients suffering by MPM. All specimens arise out of the archives of the Department of Pathology, Helios Hospital Emil von Behring (Berlin, Germany) (40 specimens) or the Institute of Pathology, University Hospital Essen (Germany) (44 specimens).
Tumor classification is based on the WHO classification of tumor guidelines (2015).13 TNM staging is based on the Union internationale contre le cancer (UICC) classification of malignant tumor.14 Diagnosis and histology of all specimens were reevaluated by two experienced pathologists (JW, TM) before usage. All patients included in the study underwent first-line chemotherapy combining cisplatin and pemetrexed at the West German Cancer Centre or the West German Lung Centre (Essen) between 2006 and 2009 or the Helios Hospital Emil von Behring (Berlin) between 2002 and 2009. Inclusion criteria for the study consist of the availability of sufficient tumor material and a complete set of data concerning follow-up and treatment.
Response to chemotherapy was determined radiologically according to modRECIST15 and was classified either as complete response (CR), partial response (PR), stable disease (SD) or progressive disease (PD). Remission was determined as CR/PR versus SD/PD and progression was determined as CR/PR/SD versus PD. Progression-free survival was calculated from the start of treatment until the first radiological progression. Overall survival was calculated from the date of initial diagnosis until death or loss of follow-up. All specimens were collected prior to systemic treatment. Surveillance was stopped on August 31, 2014.
The study was approved by the local Ethics Committee of the Medical Faculty of the University Duisburg-Essen (identifier: 13-8531-BO and 14-5775-BO). Written informed consent has not been obtained separately, as all samples were anonymized. The investigations conform to the principles outlined in the declaration of Helsinki.
RNA isolation, cDNA synthesis and qPCR
RNA from formalin-fixed, paraffin-embedded (FFPE) sections (2–4 slices á 10 µm per patient) was isolated on a MaxWell 16 using the LEV RNA FFPE Kit (Promega, Madison, WI, USA) as recommended by the supplier, with the following exceptions: no mineral oil or Blue Dye was used. To the mastermix, 250 µL lysis buffer was added and incubated for 30 mins at 56°C and 25 mins at 80°C. Elution was performed with 30 µL nuclease-free water. RNA was quantified via a Qubit 1.0 fluorimeter using the Qubit RNA HS Assay Kit (Thermo Fisher Scientific, Waltham, MA, USA). Isolated RNA was lyophilized on a Freeze Dryer Modulyo von Edwards (Thermo Fisher Scientific) for 3 hrs, resuspended in 12 µL nuclease-free water and kept frozen at −80°C until further use.
cDNA was produced by using the RevertAid RT Kit (Thermo Fisher Scientific) and 12 µL RNA per sample. In contrast to the protocol, reverse transcriptase (200 U/mL) from Promega was used. Synthesis was performed on a Thermo Cycler GeneAmp PCR System 9700 form Applied Biosystems (Thermo Fisher Scientific). Subsequently, qPCR was carried out on a Step One Plus Real-Time PCR System using TaqMan Gene Expression Master Mix, MicroAmp Fast Optical 96-well plates, cDNA probes and Assays On Demand (TaqMan, all from Thermo Fisher Scientific: (PSMA1 (HS 01027362_g1), PSMA5 (HS 00932059_m1), PSMB1 (HS 00427357_m1), PSMB2 (HS 01002946_m1), PSMB4 (HS 01123843_g1), PSMB5 (HS 01002826_g1), PSMD1 (HS 00160631_m1) and as reference genes ACTB (HS 01060665_g1) and GAPDH (HS 02758991_g1)). Information about the concentrations applied, the temperature protocol and reference gene normalization can be found elsewhere.16,17 The temperature protocol was slightly adjusted by repeating the amplification step for 40 times instead of 50 times to overcome basal noise. qPCR was performed in concordance with the "Minimal information for publication of quantitative real-time PCR experiments" (MIQE) guidelines.18
Cell line experiments
Adherently growing cell lines from humans were derived from the American Type Culture Collection (ATCC, Manassas, VA, USA). One SV40 immortalized, mesothelial stem cell line (MeT-5A), three MPM cell lines (MSTO-211H, NCI-H2452, and NCI-H2052) and one benign, lung-derived fibroblast cell line (MRC-5) were used for the experiments. Mesothelial cells were grown in RPMI 1640 (1×) plus GlutaMax-I, whereas MRC-5 was grown in MEM (1×) (both: Thermo Fisher Scientific). Both media were mixed with 10% inactivated FCS (PAN Biotech, Aidenbach, Germany) and 1% penicillin/streptomycin (10,000 U/mL, Merck Millipore, Billerica, MA, USA). Cell line handling was performed as described elsewhere.19 Cell counting was performed on a BD Accuri C6 Flow Cytometer using 90 µL buffer and 10 µL cell suspension.
Bortezomib (PS-341) 5 mg and cisplatin 50 mg were purchased from Selleck Chemicals (Houston, TX, USA). Cytostatics were resuspended in DMSO and diluted with medium to achieve the desired concentrations and to bring DMSO concentrations to ⋘1%.
Cell fate during incubation with cytostatics and medium was assessed by using the following Promega assays on 20,000 cells per well measuring triplicates per assay and cell line: Caspase-Glo 3/7 Assay (apoptosis), CellTiter-Glo Luminescent Cell Viability Assay (cell viability/senescence) and CytoTox-Glo Cytotoxicity Assay (necrosis). Cell fate was assessed at the time points 0, 6, 12, 24, 48 and 72 hrs after incubation with cytostatics and medium.
To monitor proteasome subunit activity (caspase-like, chymotrypsin-like and trypsin-like), the functional enzyme activity assay Proteasome-Glo 3-Substrate Assay was used (Promega) on 20,000 cells per well (in 25 µL medium). Six measurements per cell line were performed. Detection was carried out on a GloMax-Multi Detection System (Promega).
Statistical analysis
The R environment for statistical computing and graphics program (R version 3.3.1.) from the R foundation (Vienna, Austria) was used for statistical analysis.
The analysis was performed for our own data and data provided by TCGA/cBioPortal (dataset: “Mesothelioma”; n=87 samples).11,12
For dichotomous factors (e.g., remission, progression (both yes vs no), tumor vs benign, gender and expression level), the Wilcoxon–Mann–Whitney rank-sum test was applied. For variables with more than two categories (e.g., tumor stage, lymph node involvement, metastasis, histology), the Kruskal–Wallis test was used. Associations between gene expression of tested genes and associations between gene expression and age, TNM- and "International Mesothelioma Research Group" (IMIG) criteria were analyzed by Spearman’s rank correlation test. Significant survival differences between groups were tested by COXPH model using a CI of 95% for the Wald test, likelihood ratio test and score (log-rank) test. Kaplan–Meier analysis was done for the assessment of associations between gene expression and survival data. The level of statistical significance was defined as p≤0.05. False-discovery adjustment was not performed due to the limited multivariate nature of the analysis.
Results
Proteasome mRNA expression was assessed in 84 patients with MPM via qPCR, and further 87 patients from the TCGA/cBioPortal “Mesothelioma” dataset were used for statistical analysis.
2^-delta CT values of the investigated subunits showed the expression patterns outlined in Figure 1. Comparing patients with pleural mesothelioma and patients with spontaneous pneumothoraxes (as benign control) showed that expression of PSMA1, PSMA5, PSMB4, PSMB5 and PSMD1 was significantly higher in tumors (all p<0.001). PSMA5 showed the lowest expression of all subunits in MPM and was identified as a limiting component for the assembly of the functional proteasome in MPM.
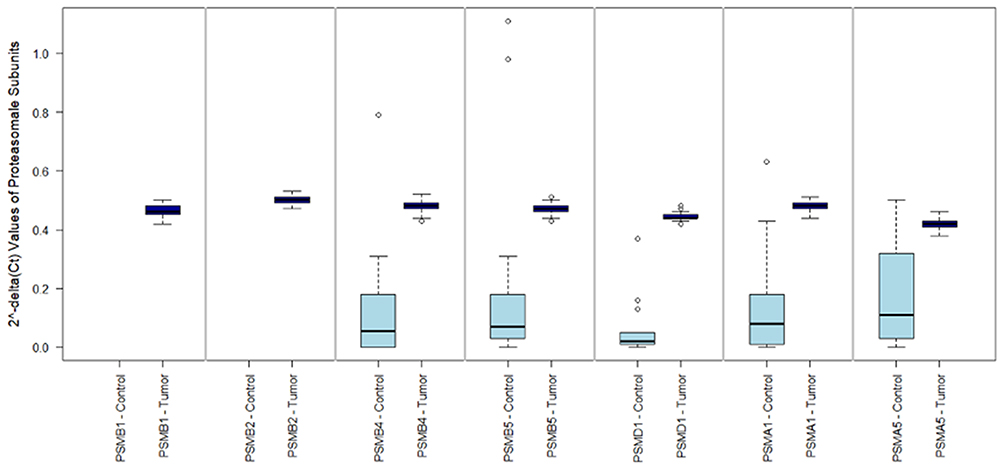 |
Figure 1 mRNA expression of proteasomal subunits between tumor and benign control. This figure 1 shows the 2^-delta Ct values (y axis) for the investigated proteasomal subunits (x axis) in malignant pleural mesothelioma (MPM) and benign control tissue (pneumothoraces). PSMA1, PSMA5, PSMB4, PSMB5 and PSMD1 were significantly higher in tumors (all p<0.001). In MPM, a consistent expression of all subunits was found between all 84 patients. Expression of PSMB1 and PSMB2 was not assessed in benign control samples. |
Progression status correlated significantly with PSMB1 (p=0.004) and PSMB5 (p=0.027). Proteasome subunit expression did not correlate with overall and progression-free survival with respect to our own data.
Overall survival versus proteasomal subunit expression was also calculated for the dataset “Mesothelioma” provided by TCGA/cBioPortal (n=87 samples). For 56 samples, survival data (days from diagnosis until death and outcome (“DEAD” versus “ALIVE”)) were available. The COXPH model revealed a significant correlation of PSMB4 and outcome (all tests; p<0.0175; CI 95%: 4.45e+11–3.05e+115). The Kaplan–Meier plot is depicted in Figure 2 and the median was chosen as threshold to achieve separation of the two curves.
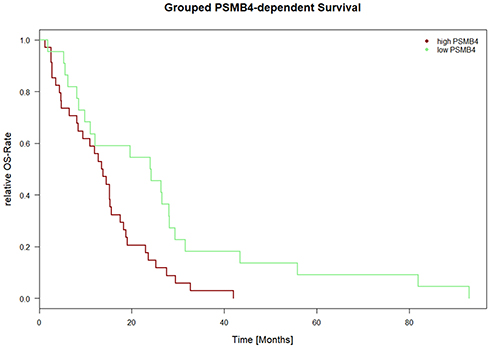 |
Figure 2 PSMB4 expression-dependent survival for TCGA/cBioPortal data. Figure 2 depicts the Kaplan–Meier curve for PSMB4expression-dependent survival. On the x axis, the time is depicted in days. On the y axis, the number of events is shown in percentage. PSMB4 and outcome showed a correlation with respect to the COXPH model (all tests; p<0.0175; CI 95%: 4.45e+11 to 3.05e+115). The data were derived from the “Mesothelioma” dataset from TCGA/cBioPortal (n=87 patients, survival data was available for n=56 patients). All other proteasomal subunits showed no correlation with survival. |
Correlations that were found between proteasome subunits and histology, tumor stage, lymph node invasion, presence of distant metastasis, IMIG stage and remission are summarized in Table 1.
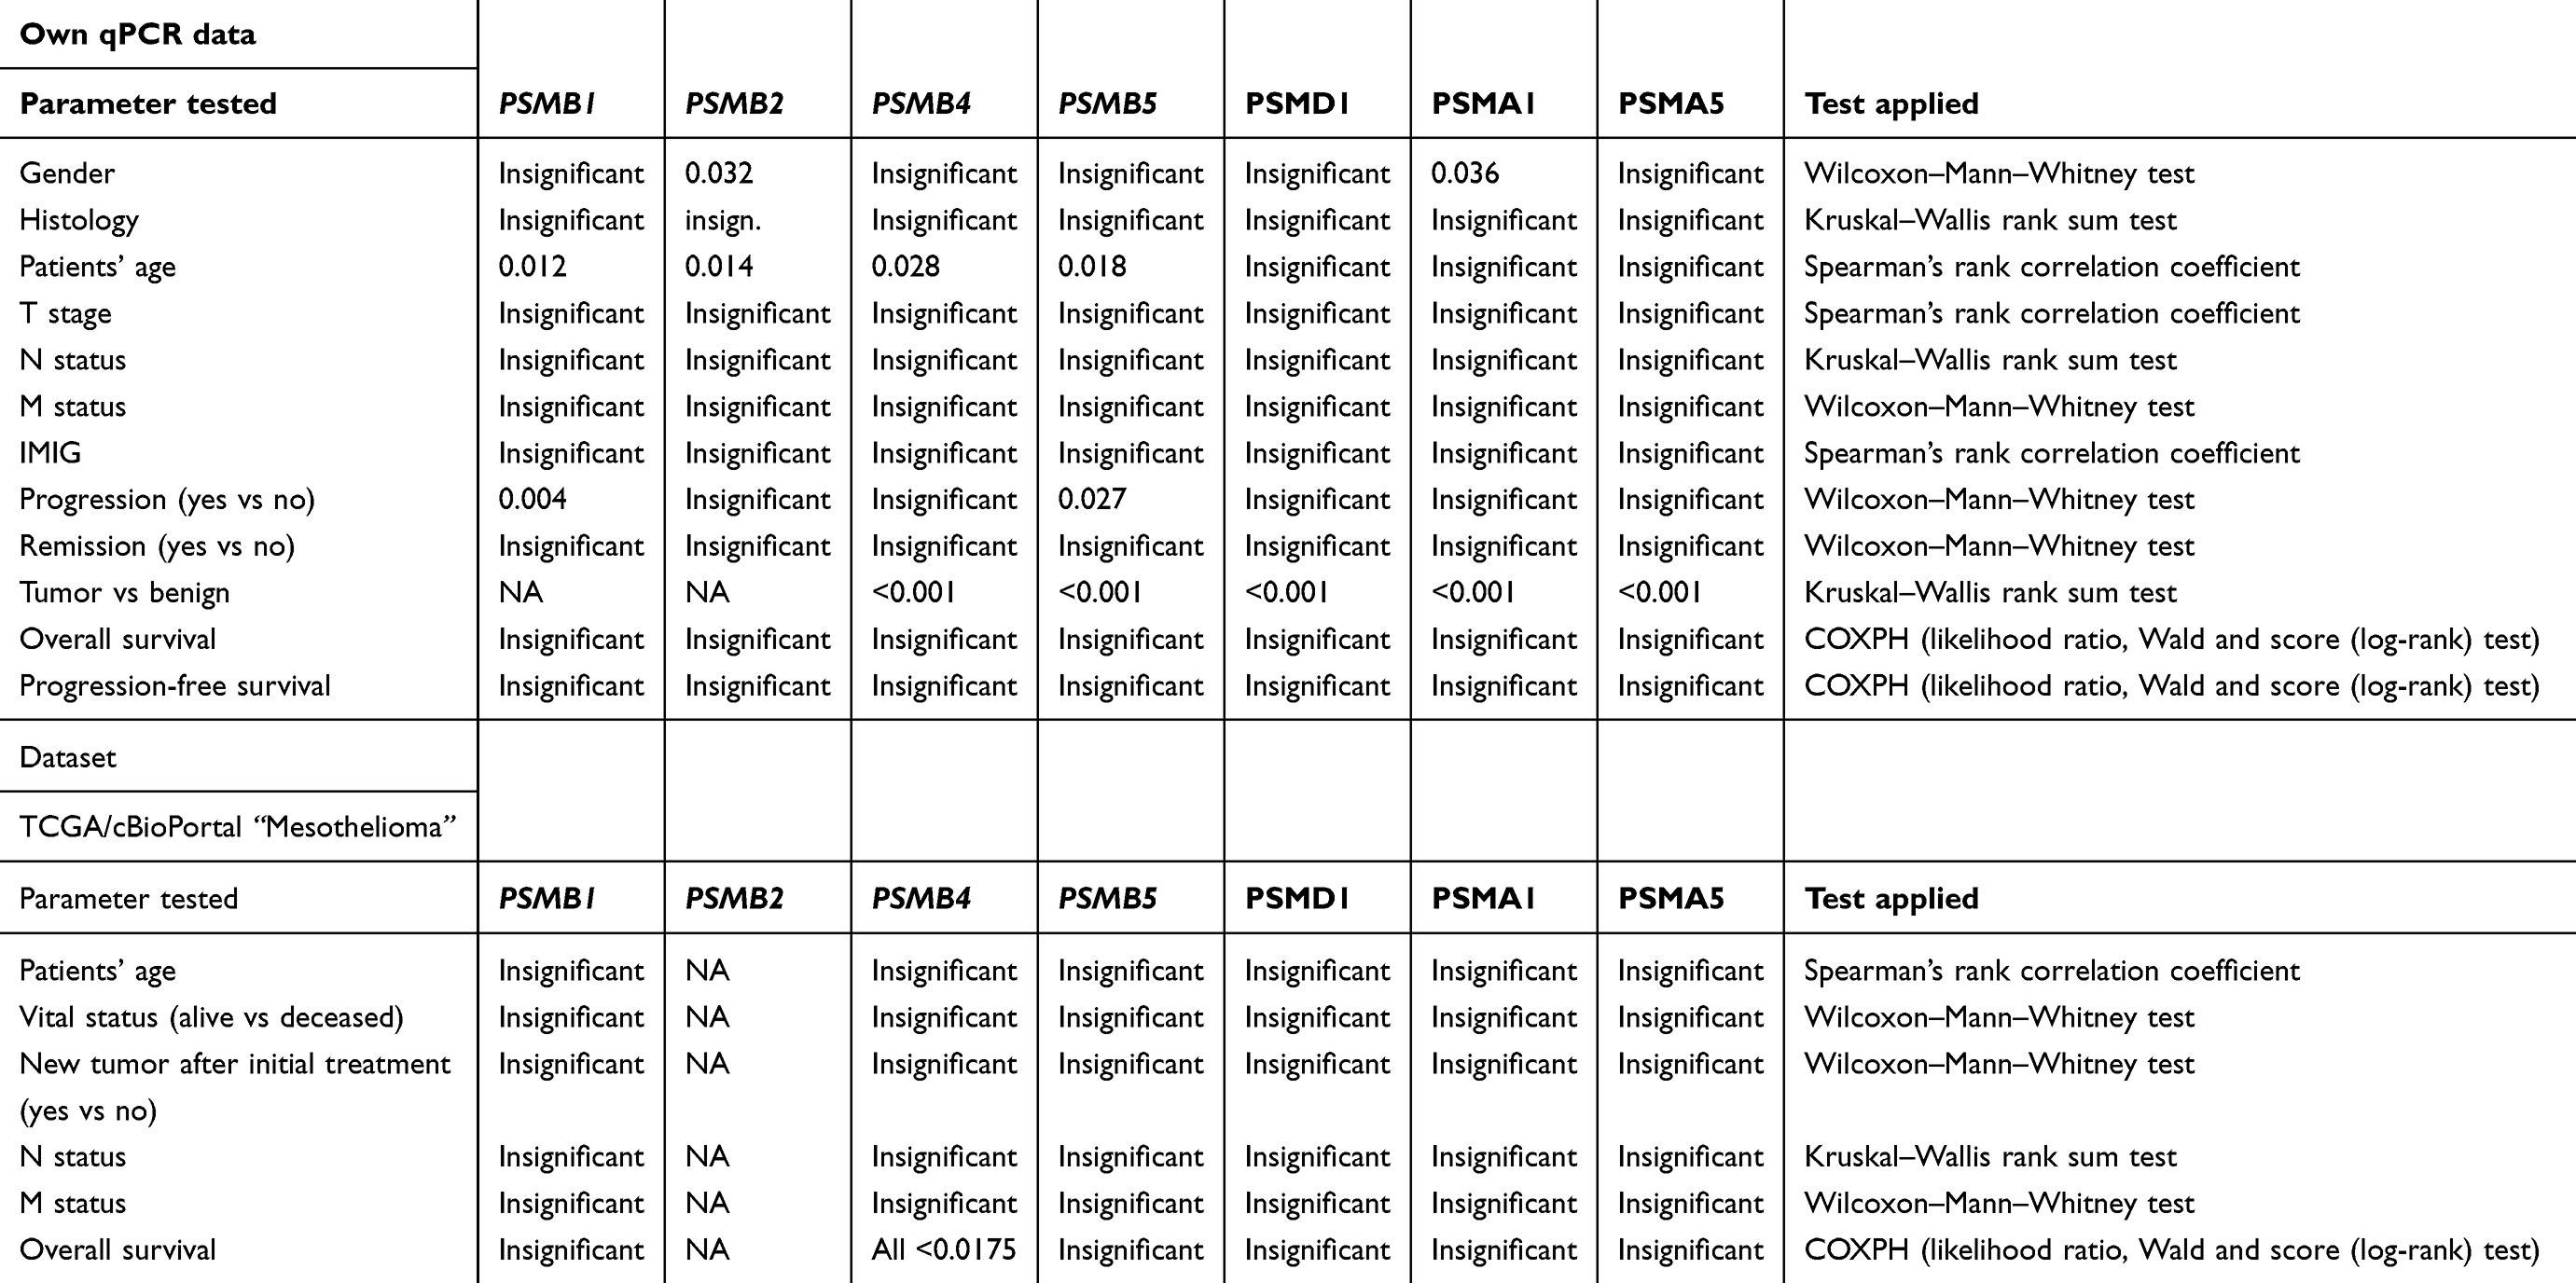 |
Table 1 Significant results for expression of proteasomal subunits and clinicopathological data |
In four mesothelial cell lines (three malignant and one stem cell) and one fibroblast cell line, the enzyme activity of the proteasome subunits with caspase-like activity (PSMB1), trypsin-like activity (PSMB2) and chymotrypsin-like activity (PSMB5) was assessed. These cell lines comprise the SV40 immortalized, mesothelial stem cell line MeT-5A, the three MPM cell lines MSTO-211H, NCI-H2452 as well as NCI-H2052 but also the benign, lung-derived fibroblast cell line MRC-5. The results of the cell culture experiments are summarized in Figure 3.
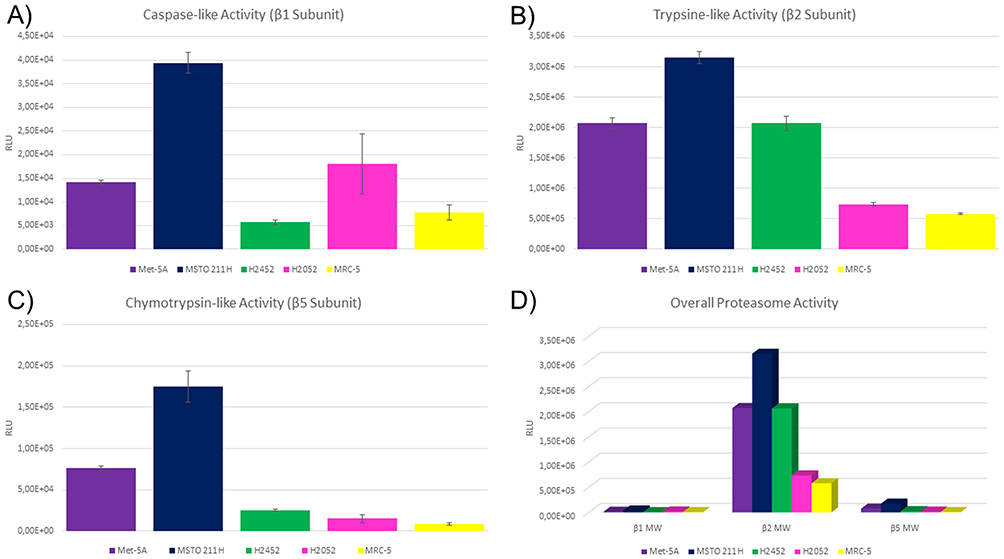 |
Figure 3 Proteasome subunit activity in mesothelial and fibroblast cell lines. Figure 3 shows relative luminescence units on the y axis. Higher values indicate higher activity of the respective subunit. On the x axis, the investigated cell lines are depicted. Each subunit was measured six times per cell line and error bars indicate the deviation (A–C). Met-5A and MSTO-211H showed elevated activity compared to the other cell lines. (D) Summarizes the correlated results for the subunit activity and respective cell lines. Error bars were spared to enhance the readability. |
Time point measurements for apoptosis, necrosis and cell viability were performed at 0, 6, 12, 24, 48 and 72 hrs.
An optimal time point for each cell status assay was calculated by taking the cells incubated with medium as the baseline and calculating a ratio of the other compounds compared to cells with medium.
Senescence was not significantly influenced by any of the cytostatics (data not shown). Regardless of the time point, cytotoxicity/necrosis was induced by digitonin only (data not shown).
Of note, induction of apoptosis was the main cell fate when comparing the cytostatics applied. Optimal induction of apoptosis was monitored after 48 hrs of incubation. Highest induction of apoptosis for 50 nM and 100 nM bortezomib was monitored for NCI-H2052 and MRC-5 (Figure 4D and E), which showed the lowest PSMB2 and PSMB5 enzymatic activity (Figure 3B and C). These cell lines were not influenced by cisplatin.
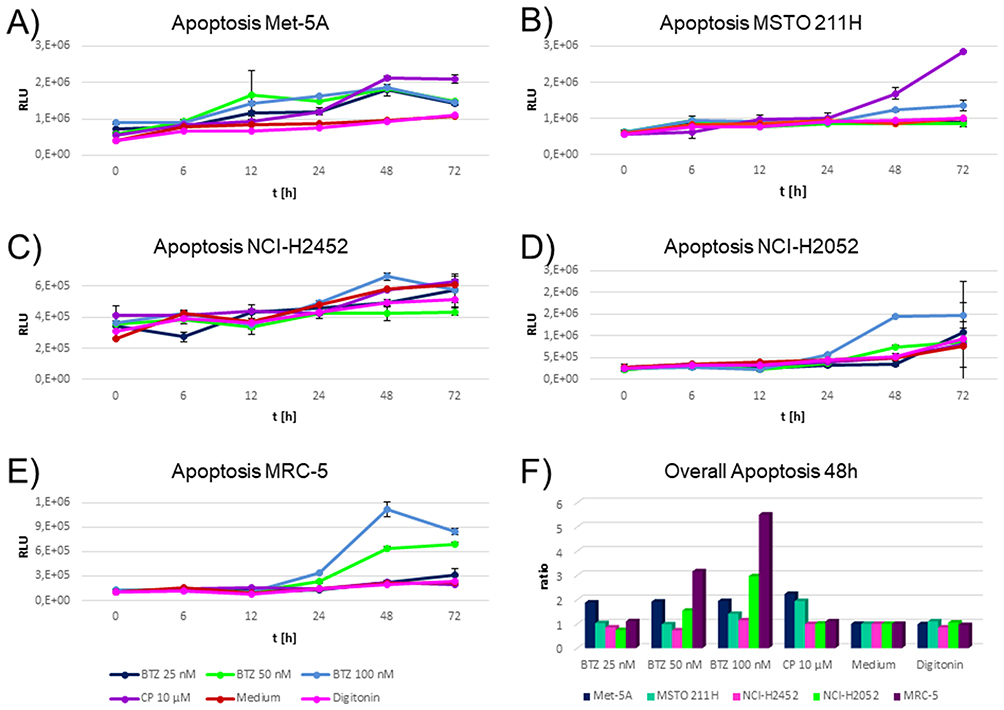 |
Figure 4 Time-dependent induction of apoptosis in cell lines during incubation with cytostatics and medium. (A-E) shows relative luminescence units on the y axis. Higher values indicate higher caspase 3/7 activity indicating a higher apoptotic rate. The x axis depicts the time points investigated. The different colors indicate the cytostatics applied as explained in the figure legend. BTZ abbreviates bortezomib and CP cisplatin. Triplicates were measured per drug, time point and cell line. Highest induction of apoptosis by bortezomib was monitored for cell lines NCI-H2052 and MRC-5 (D–E). These cell lines were not influenced by cisplatin. Met-5A (A) responded similar to all cytostatics. MSTO-211H showed an elevated induction of apoptosis for cisplatin, but a negligible response to all other drugs and concentrations (B). NCI-H2452 showed a slight response to the highest concentration of bortezomib (100 nM) only (Figure 3C). (F) An optimal time point for each cell status assay was calculated by taking the cells incubated with medium as the baseline and calculating a ratio of the other compounds compared to cells with the medium. The optimal time point was 48 hrs after incubation. On the y axis, the normalized apoptosis ratios for each cell lines are shown. High responses for bortezomib 50 nM and 100 nM were found for MRC-5 and NCI-H2052 only. |
Met-5A (Figure 4A) responded equally to all cytostatics. MSTO-211H showed an elevated induction of apoptosis for cisplatin, but a negligible response to all other drugs and concentrations (Figure 4B). NCI-H2452 showed a slight response to the highest concentration of bortezomib (100 nM) only (Figure 4C).
Interpretation
Here we present a retrospective study investigating the mRNA expression of proteasomal subunits in patients with MPM (n=171), which show elevated expression of all subunits compared to control samples. High proteasome expression is a known predictor for bortezomib sensitivity in several other tumors, and hence we tested bortezomib in three MPM cell lines, one mesothelial stem cell line and one benign control cell line. High expression of proteasomal subunits correlated with absent response to bortezomib, indicating that bortezomib response is tissue dependent.
Of note, recent guidelines emphasized the need for innovative and novel therapy strategies in MPM,20 but currently reliable biomarkers predicting response are lacking. This problem became visible in studies investigating the efficacy of bortezomib in MPM in two clinical trials (NCT00513877 and NCT00458913)8–10 and another clinical trial in non-small cell lung cancer (NSCLC).21 Bortezomib failed to improve outcome, because patients were not preselected by reliable biomarkers, which could predict outcome or therapy response. One potential biomarker (NOXA) included in the clinical trial was disproved.9 However, bortezomib is a proteasome inhibitor, which has been approved for the treatment of relapsed and refractory multiple myeloma as well as relapsed mantle cell lymphoma.7 Sensitivity to bortezomib correlated with a high expression of the 20S proteasome in human acute myeloid leukemia cell lines and predicted the outcome.7 The 20S proteasome consists of the PSMB1, PSMB2 and PSMB5 subunits, and the chymotrypsin-like activity (PSMB5) is the rate-limiting step of proteasomal degradation.4 Bortezomib binds mainly to the PSMB5 subunit and to a lesser extent to the PSMB1 subunit.4 Our results imply that proteasomal subunit expression is differentially regulated between MPM and benign controls. Tumor samples show significantly induced gene expression levels of all analyzed proteasomal subunits. Considering the results in other tumor entities, this should indicate sensitivity to bortezomib-based treatment.7 Interestingly, apoptosis was sufficiently induced in MRC-5 and NCI-H2052 by bortezomib (50–100 nM, Figures 3 and 4), which presented with a considerably low expression of proteasomal subunits (especially low expression of PSMB5) compared to the other cell lines (Figures 3 and 4). Of note, bortezomib inhibits PSMB5 specifically.4 The cell culture experiments imply that only low proteasomal expression in MPM can be sufficiently inhibited by bortezomib and patients’ samples presented with rather elevated expression, indicating that bortezomib is a futile therapy approach in MPM. This is contrary to the other tumor entities where bortezomib was already approved and high proteasome expression predicted a good outcome.7 Several groups investigated the synergistic effect of platin derivates plus bortezomib and found that the combination reduces tumor growth and restores TP53 activity, and hence induces apoptosis and sensitizes therapy-resistant tumors to cisplatin and other chemotherapeutics.22–24 But neither bortezomib nor the combination with cisplatin was successful over current-day standard therapy in MPM and NSCLC in clinical trials,8,9,21 although also (neuroendocrine) NSCLC showed elevated expression of proteasomal subunits.17 Also, these results indicate that bortezomib sensitivity might be tissue dependent.
Although several experiments to support our suggestion has been employed, it remains to be unclear why high expression of the different proteasomal subunits is not directly associated with sensitivity to bortezomib. Additionally, the present study design, mostly based on the response of different cell lines to treatment, does not reflect the complexity of this issue in its whole, e.g., the influence on immune proteasome activity and its effect on host anticancer immune defense, etc. Nevertheless, as all cancerous cell lines and tumor samples show noticeable high gene expression levels compared to benign tissue of all proteasomal subunits analyzed, including all catalytically active domains, this fact will explain the relatively bad response of MPM patients to bortezomib treatment in the former studies as well as the missing sensitivity stratification within the group of analyzed samples. Considering this fact for future treatment strategies may prevent future patients from side effect loaded but most times ineffective treatment. Additionally, it may identify those (small) subgroup of patients potentially responding to the intended treatment using proteasome inhibitors.
Coming back to the initial problem, biomarkers are needed to allow for risk stratification and preclude that presumably therapy-resistant patients receive a futile, side-effect loaded and potentially harmful regimen. Although several statistically significant results were found for proteasome subunit expression and clinicopathological parameters (e.g., PSMB4 expression is a predictor for survival (Figure 2), PSMB1 and PSMB5 correlate with progression status, Table 1), none of these results would pass a false-discovery adjustment after multivariate analysis. Expression of proteasomal subunits seems to be equally (high) between MPM subtypes and between the two investigated patient collectives (Figure 1). Therefore, we suggest that elevated proteasome expression is a negative predictor for therapy response in MPM and cannot be considered as biomarker for patient selection for bortezomib therapy.
Another pathway-related and more precious biomarker might be MDM2, which seems to predict therapy resistance or sensitivity in general.6 MDM2 is an E3 ubiquitin ligase and labels proteins for proteasomal degradation via the 20S proteasome. The ubiquitin–proteasome pathway regulates angiogenesis, cell cycle progression, DNA repair and apoptosis,6 and overexpression of MDM2 was identified to be present in >20% of MPM and correlates with poor outcome and therapy response.25,26 According to recent research, MDM2 interacts with more than 100 unique proteins and is one main regulator of proteostasis and suspected oncoprotein.27 Cells that have acquired a resistance against cisplatin, doxorubicin or MDM2 inhibitors are also more prone to acquire or present with a bortezomib resistance.6 But on the other hand, a combination of bortezomib and MDM2 inhibitors showed synergistic effects on mantle cell lymphoma cell lines,28 which share a common feature with MPM namely being TP53 wild type. Most importantly, TP53 mutant mantle cell lymphoma, which is resistant against bortezomib, was successfully inhibited by activating the mitochondrial apoptosis pathway via combination of MDM2 inhibitor and bortezomib.29 Combining bortezomib and MDM2 inhibitors is also thought to reduce side effects of a bortezomib treatment such as neuropathy,6 seen in many patients. In an integrated view of all the preceding facts, we think that future attempts combining proteasomal inhibition with other targeted therapies like MDM2 inhibitors, we may generate a beneficial effect also in MPM.
Conclusion
Although high expression of the proteasome predicts bortezomib sensitivity in several tumors and MPM presents with high expression of proteasomal subunits, two clinical trials failed to improve patients’ outcome when bortezomib was used as single agent or in combination with cisplatin. Bortezomib sensitivity seems to be tissue dependent and bortezomib induced apoptosis sufficiently in MPM cell lines with low proteasome activity only. Therefore, testing MPM patients for proteasome expression before offering bortezomib as therapy seems essential. MDM2 is an E3 ubiquitin ligase-labeling proteins for proteasomal degradation. Combination therapy of MDM2 inhibitors and bortezomib showed synergistic effects and sensitized tumor cells to either of the cytostatics, although they showed insensitivity to either of the cytostatics alone. Testing MDM2 inhibitors and bortezomib in combination in MPM could reveal a potent new therapy option, because >20% of epitheloid MPM present with MDM2 overexpression.
Availability of data and materials
The datasets used and/or analyzed during the current study are available from the corresponding author on reasonable request.
Acknowledgment
The results are in part based upon data generated by the TCGA Research Network: http://cancergenome.nih.gov/ provided by http://www.cbioportal.org/.
Disclosure
Dr Wilfried EE Eberhardt reports grants, personal fees from Astra Zeneca, grants, personal fees from BMS, grants, personal fees from Eli Lilly, personal fees from Novartis, personal fees from Roche, personal fees from Pfizer, personal fees from Boehringer Ingelheim, personal fees from MSD/Merck, personal fees from Abbvie, personal fees from Takeda, personal fees from Daichi Sankyo, personal fees from Amgen, outside the submitted work. The authors declare no other conflicts of interest in this work.
References
1. Liu Z, Klominek J. Regulation of matrix metalloprotease activity in malignant mesothelioma cell lines by growth factors. Thorax. 2003;58(3):198–203. doi:10.1136/thorax.58.3.198
2. Szulkin A, Nilsonne G, Mundt F, et al. Variation in drug sensitivity of malignant mesothelioma cell lines with substantial effects of selenite and bortezomib, highlights need for individualized therapy. PLoS One. 2013;8(6):e65903. doi:10.1371/journal.pone.0065903
3. Ray M, Kindler HL. Malignant pleural mesothelioma: an update on biomarkers and treatment. Chest. 2009;136(3):888–896. doi:10.1378/chest.08-2665
4. Lu S, Wang J. The resistance mechanisms of proteasome inhibitor bortezomib. Biomark Res. 2013;1(1):13. doi:10.1186/2050-7771-1-13
5. Chitra S, Nalini G, Rajasekhar G. The ubiquitin proteasome system and efficacy of proteasome inhibitors in diseases. Int J Rheum Dis. 2012;15(3):249–260. doi:10.1111/j.1756-185X.2012.01737.x
6. Jones RJ, Bjorklund CC, Baladandayuthapani V, Kuhn DJ, Orlowski RZ. Drug resistance to inhibitors of the human double minute-2 E3 ligase is mediated by point mutations of p53, but can be overcome with the p53 targeting agent RITA. Mol Cancer Ther. 2012;11(10):2243–2253. doi:10.1158/1535-7163.MCT-12-0135
7. Matondo M, Bousquet-Dubouch MP, Gallay N, et al. Proteasome inhibitor-induced apoptosis in acute myeloid leukemia: a correlation with the proteasome status. Leuk Res. 2010;34(4):498–506. doi:10.1016/j.leukres.2009.09.020
8. O’Brien ME, Gaafar RM, Popat S, et al. Phase II study of first-line bortezomib and cisplatin in malignant pleural mesothelioma and prospective validation of progression free survival rate as a primary end-point for mesothelioma clinical trials (European Organisation for Research and Treatment of Cancer 08052). Eur J Cancer. 2013;49(13):2815–2822. doi:10.1016/j.ejca.2013.05.008
9. Fennell DA, McDowell C, Busacca S, et al. Phase II clinical trial of first or second-line treatment with bortezomib in patients with malignant pleural mesothelioma. J Thorac Oncol. 2012;7(9):1466–1470. doi:10.1097/JTO.0b013e318260dfb9
10. Christoph DC, Eberhardt WE. Systemic treatment of malignant pleural mesothelioma: new agents in clinical trials raise hope of relevant improvements. Curr Opin Oncol. 2014;26(2):171–181. doi:10.1097/CCO.0000000000000053
11. Cerami E, Gao J, Dogrusoz U, et al. The cBio cancer genomics portal: an open platform for exploring multidimensional cancer genomics data. Cancer Discov. 2012;2(5):401–404. doi:10.1158/2159-8290.CD-12-0095
12. Gao J, Aksoy BA, Dogrusoz U, et al. Integrative analysis of complex cancer genomics and clinical profiles using the cBioPortal. Sci Signal. 2013;6(269):pl1. doi:10.1126/scisignal.2004088
13. Galateau-Salle F, Churg A, Roggli V, Travis WD; World Health Organization Committee for Tumors of the P. The 2015 World Health Organization classification of tumors of the Pleura: advances since the 2004 classification. J Thorac Oncol. 2016;11(2):142–154. doi:10.1016/j.jtho.2015.11.005
14. Patriarca S, Ferretti S, Zanetti R. [TNM Classification of malignant tumours - Eighth edition: which news?]. Epidemiol Prev. 2017;41(2):140–143. doi:10.19191/EP17.2.P140.034
15. Byrne MJ, Nowak AK. Modified RECIST criteria for assessment of response in malignant pleural mesothelioma. Ann Oncol. 2004;15(2):257–260. doi:10.1093/annonc/mdh059
16. Walter RF, Mairinger FD, Wohlschlaeger J, et al. FFPE tissue as a feasible source for gene expression analysis–a comparison of three reference genes and one tumor marker. Pathol Res Pract. 2013;209(12):784–789. doi:10.1016/j.prp.2013.09.007
17. Mairinger FD, Walter RF, Theegarten D, et al. Gene Expression Analysis of the 26S Proteasome Subunit PSMB4 Reveals Significant Upregulation, Different Expression and Association with Proliferation in Human Pulmonary Neuroendocrine Tumours. J Cancer. 2014;5(8):646–654. doi:10.7150/jca.9955
18. Bustin SA, Benes V, Garson JA, et al. The MIQE guidelines: minimum information for publication of quantitative real-time PCR experiments. Clin Chem. 2009;55(4):611–622. doi:10.1373/clinchem.2008.112797
19. Walter RF, Zarogoulidis P, Mairinger FD, et al. Cell viability of fibroblasts to pifenidone and sirolimus: a future concept for drug eluting stents. Int J Pharm. 2014;466(1–2):38–43. doi:10.1016/j.ijpharm.2014.03.003
20. Astoul P, Roca E, Galateau-Salle F, Scherpereel A. Malignant pleural mesothelioma: from the bench to the bedside. Respiration. 2012;83(6):481–493. doi:10.1159/000339259
21. Kontopodis E, Kotsakis A, Kentepozidis N, et al. A phase II, open-label trial of bortezomib (VELCADE((R))) in combination with gemcitabine and cisplatin in patients with locally advanced or metastatic non-small cell lung cancer. Cancer Chemother Pharmacol. 2016;77(5):949–956. doi:10.1007/s00280-016-2997-7
22. Konac E, Varol N, Kiliccioglu I, Bilen CY. Synergistic effects of cisplatin and proteasome inhibitor bortezomib on human bladder cancer cells. Oncol Lett. 2015;10(1):560–564. doi:10.3892/ol.2015.3250
23. Miyamoto Y, Nakagawa S, Wada-Hiraike O, et al. Sequential effects of the proteasome inhibitor bortezomib and chemotherapeutic agents in uterine cervical cancer cell lines. Oncol Rep. 2013;29(1):51–57. doi:10.3892/or.2012.2072
24. Yerlikaya A, Altikat S, Irmak R, Cavga FZ, Kocacan SA, Boyaci I. Effect of bortezomib in combination with cisplatin and 5fluorouracil on 4T1 breast cancer cells. Mol Med Rep. 2013;8(1):277–281. doi:10.3892/mmr.2013.1466
25. Mairinger FD, Walter RF, Ting S, et al. Mdm2 protein expression is strongly associated with survival in malignant pleural mesothelioma. Future Oncol. 2014;10(6):995–1005. doi:10.2217/fon.13.261
26. Walter RF, Mairinger FD, Ting S, et al. MDM2 is an important prognostic and predictive factor for platin-pemetrexed therapy in malignant pleural mesotheliomas and deregulation of P14/ARF (encoded by CDKN2A) seems to contribute to an MDM2-driven inactivation of P53. Br J Cancer. 2015;112(5):883–890. doi:10.1038/bjc.2015.27
27. Nicholson J, Neelagandan K, Huart AS, Ball K, Molloy MP, Hupp T. An iTRAQ proteomics screen reveals the effects of the MDM2 binding ligand Nutlin-3 on cellular proteostasis. J Proteome Res. 2012;11(11):5464–5478. doi:10.1021/pr300698d
28. Tabe Y, Sebasigari D, Jin L, et al. MDM2 antagonist nutlin-3 displays antiproliferative and proapoptotic activity in mantle cell lymphoma. Clin Cancer Res. 2009;15(3):933–942. doi:10.1158/1078-0432.CCR-08-0399
29. Jin L, Tabe Y, Kojima K, et al. MDM2 antagonist Nutlin-3 enhances bortezomib-mediated mitochondrial apoptosis in TP53-mutated mantle cell lymphoma. Cancer Lett. 2010;299(2):161–170. doi:10.1016/j.canlet.2010.08.015
 © 2019 The Author(s). This work is published and licensed by Dove Medical Press Limited. The
full terms of this license are available at https://www.dovepress.com/terms
and incorporate the Creative Commons Attribution
- Non Commercial (unported, 3.0) License.
By accessing the work you hereby accept the Terms. Non-commercial uses of the work are permitted
without any further permission from Dove Medical Press Limited, provided the work is properly
attributed. For permission for commercial use of this work, please see paragraphs 4.2 and 5 of our Terms.
© 2019 The Author(s). This work is published and licensed by Dove Medical Press Limited. The
full terms of this license are available at https://www.dovepress.com/terms
and incorporate the Creative Commons Attribution
- Non Commercial (unported, 3.0) License.
By accessing the work you hereby accept the Terms. Non-commercial uses of the work are permitted
without any further permission from Dove Medical Press Limited, provided the work is properly
attributed. For permission for commercial use of this work, please see paragraphs 4.2 and 5 of our Terms.