Back to Archived Journals » Research and Reports in Forensic Medical Science » Volume 9
Bone-mineral density: clinical significance, methods of quantification and forensic applications
Authors Kranioti EF ![]() , Bonicelli A
, Bonicelli A ![]() , García-Donas JG
, García-Donas JG
Received 17 December 2018
Accepted for publication 20 May 2019
Published 25 July 2019 Volume 2019:9 Pages 9—21
DOI https://doi.org/10.2147/RRFMS.S164933
Checked for plagiarism Yes
Review by Single anonymous peer review
Peer reviewer comments 2
Editor who approved publication: Professor Henrik Druid
Elena F Kranioti1,2, Andrea Bonicelli,1 Julieta G García-Donas1,3
1Edinburgh Unit for Forensic Anthropology, School of History, Classics and Archaeology, University of Edinburgh, Edinburgh EH8 9AG, UK; 2Department of Forensic Sciences, Medical School, University of Crete, Heraklion 71110, Greece; 3Skeletal Biology Research Center, School of Anthropology and Conservation, University of Kent, Canterbury CT2 7NR, Kent, UK
Abstract: Bone-mineral density (BMD) is a measure of the inorganic mineral content in bone, and is one of the more informative assessments of bone quality in both clinical studies and forensic investigations. Several factors, such as age, sex, disease, genetics, and lifestyle, affect BMD measurements, and normative standards must be applied for specific groups and individuals. One of the most common disorders associated with low BMD is osteoporosis and increased fracture risk, due to a decrease in bone strength and an increase in bone fragility. Medical conditions like diabetes or hyperthyroidism and other parameters like peak bone mass and postmenopausal estrogen deficiency also impact BMD. Single- and dual-energy photon absorptiometry, quantitative computet tomography, and magnetic resonance imaging are some of the technological modalities for BMD quantification, and each presents distinct advantages and limitations, depending on the purpose of the analysis, the specific characteristics of the individual, the bone site under examination, and the equipment and trained personnel available. Recently, BMD values were applied to forensic medicine in a variety of scenarios ranging from age and sex estimation to the assessment of malnutrition and the use of finite-element modelling. Despite technical and methodological inconsistencies reported in the literature on BMD readings, there is scope for expanding the use of this variable in forensic settings.
Keywords: bone-mineral density, bone, medical imaging, quantification, forensic medicine
Introduction
Bone’s composite nature gives it its unique mechanical properties. Organic matrix (mainly type I collagen) and mineral matrix (hydroxyapatite crystal embedded in the collagen fibers) are the main components of bone. Considering their contribution in terms of material properties, it has been proven that the mineral component plays a major role in bone strength, while the organic matrix is primarily responsible for its toughness and plastic deformation.1–4 Changes in matrix composition have an effect on material properties. As such, it has been shown that physiological or pathologically induced increase in mineral content and collagen is responsible for variations in elastic properties, while collagen maturity is highly correlated with plastic behavior.5
The increase of fracture risk cannot only be attributed to tissue-material properties, as structural properties play a central role in the mechanical integrity of bone. Architectural organization and bone mass are the other factors that can influence resistance to applied force. The interaction of cortical and trabecular bone quantity allows balancing of bone mass and strength. After skeletal maturity, external stress is one of the main factors that controls not only the activation and deactivation of remodeling but also the balance between bone removal and deposition. This phenomenon, coupled with hormone stimulation, can lead to an increase or decrease in bone mass and architecture that is more pronounced in trabecular than cortical bone. With regard to trabecular bone, the main contributors to bone strength are trabecular number, thickness, orientation, and connectivity.6,7 For this reason, volumetric bone-mineral density (vBMD) evaluation has been used as the main clinical and preoperative screening tool for low bone mass and increased fracture risk. vBMD is defined as the ratio of BM content to bone size, expressed in grams per cubic centimeter.8 Another way to measure BMD is areal BMD (aBMD), defined as BM content per unit area (g/cm2). The two values are slightly different, as equivalent values for vBMD in bones of different size would result in different aBMD: the larger the bone, the greater the aBMD value.9
Peak bone mass represents the maximum amount of whole-body BM content reached during the life of an individual. About a quarter of an individual’s peak bone mass is acquired in an interval of 2 years surrounding the time the maximum height of the individual is reached, with 90% of peak bone mass reached by the age of 18 years.10 BMD can be affected by many factors, such as sexual maturation, age, genetics, physical activity, lifestyle, dietary calcium, and hormonal status/menopause.10–13 The development of osteoporosis due to the physiological aging process or to metabolic disorders leads to alterations in bone remodeling rates. This results in reduced bone strength and an increase in fragility and bone-fracture risk. Osteoporosis is commonly diagnosed by measurement of BMD,14–17 with the commonest method used being dual-energy X-ray absorptiometry (DXA) scanning of the lumbar spine and hip.18 The increased risk of fracture is certainly due to a series of age-related changes in bone metabolism that result in deterioration of architecture and bone composition. Apart from the clinical application of BMD, forensic medicine and anthropology use BMD for estimating sex and age, identifying pathological conditions like chronic malnutrition, and assessing diagenetic changes in bone material.19–21 In addition, BMD has been used in paleoanthropological studies to assess osteoporosis in archeological populations, although taphonomic influences were acknowledged to confound BMD values.22,23
We review factors affecting BMD and the commonest techniques used to quantify it. An overview of applications of BMD for forensic medicine and future recommendations are also presented.
Factors affecting BMD levels
Age and sex
Aging causes changes in cortical bone microstructure and higher bone porosity, and age correlates negatively with BMD and bone strength.24 Fragility is the result of bone loss and degradation of bone structure.25 Assessment of haversian canal and osteon area produced by an increase in osteon-remodeling rates with age indicates an increase in intracortical porosity, which may be used as an indicator for the diagnosis of osteoporosis and age-related risk of fracture.26,27 Moreover, cortical BMD aging changes vary by skeletal site, and the severity of BMD decline also depends on tissue mineralization, defined as the percentage of BM in the solid phase, along with the aforementioned porosity.24 An early study conducted on humeral cortices from cadavers noted that cortical porosity increased with age, from 4% to 10% from 40 to 80 years, yet BMD did not demonstrate age-related variation.28 Riggs et al29 found overall BMD reduction of 47% in the spine and 30%–39% in mid- and distal radii across the human life span. Especially marked decreases were seen in females >65 years of age. In a large South Korean sample, BMD demonstrated an accelerated phase of decline for the femoral neck during early adulthood.30 Therefore, differences in normative values for different populations and other extrinsic influences should be considered when assessing and comparing age trajectories for BMD values.30 Moreover, discrepancies in results reported by different studies might be due to the variables used (measurements of BMD corrected for vascularization and resorption spaces)28 and other factors, such as skeletal site and methodological approaches, which may also partly account for different outcomes.30
In general, an increased skew of the balance of bone remodeling toward bone resorption produces a decrease in BMD and bone strength in males and females.24,31 Peak bone mass will be reached at different ages depending on the skeletal site, with the earliest age being 14–18.5 years for the hip in both sexes.32 Adult bone strength depends directly on skeletal development and growth during the first decades of life. Males tend to reach peak bone mass at an older age than females, with higher bone content and density being accomplished at a later maturational stage.33 Both sexes gain 40% of their skeletal mass between 12 and 16 years of age. However, males will demonstrate a slight increase in aBMD at the lumbar spine and mid-femoral shaft in the late years of adolescence, while females will not.34 Underlying differences in physiological bone growth and peak bone mass between males and females play an important role in BMD sex variation.
After reaching peak bone mass at the end of skeletal maturation, BMD begins to decline. BMD values later in life represent the influence of skeletal development and changes in the rate of bone loss, with both factors being determinants of osteoporosis development in postmenopausal females.35 Estrogen deficiency causes an increase in remodeling and subsequent bone loss in this group, with low estrogen levels also reducing skeletal tissue formation in response to mechanical stimuli.36 At older ages, higher incidence of osteoporosis is seen in females in comparison to males, regardless of females’ hormonal status, linking the disorder not only to hormonal deficiency but also to lower female skeletal mass reached at puberty or inherently higher BMD loss with aging.33,37,38 Nonetheless, skeletal fragility also increases with age in males, as demonstrated by the increasing frequency of minimal-to-moderate trauma associated with other risk fracture factors, such as previous trauma and bone strength, among others.39 For example, in individuals >55 years old, BMD differences in weight- and non-weight-bearing bones have been correlated with variations in age and sex.40 Moreover, males in the same age cohort present bone failure (fracture), especially on the lumbar spine, at higher BMD measures than females.33 Sex differences in bone loss due to age exhibit regional variation. Warming et al41 performed a cross-sectional and longitudinal study on healthy subjects (not suffering from metabolic disease). The cross-sectional data demonstrated a similar percentage of bone loss at different sites (hip, spine, ultradistal forearm) in males and females aged 20–80 years, with the exception of the distal forearm, where females had a 50% greater bone loss in old age compared to males.41 Cross-sectional and longitudinal data for females both support:
minimal premenopausal bone loss only at the hip, an obvious postmenopausal bone loss at the distal forearm and hip that lasts throughout postmenopausal life, and a bone loss at the lumbar spine that is only found in the first decade after menopause.41
Males in the same study exhibited continuous bone loss at the hip throughout life, whereas an accelerated bone loss was found at the distal forearm. This research reported some discrepancies between cross-sectional and longitudinal data, but in general was in agreement with previously published studies.42,43 In order to ensure accurate assessment of BMD values, age- and sex-related standards might be adjusted to body size, peak bone mass, skeletal size, and as shown in the next section, population-specific references.44
Ancestry and heritability
More than 80 loci have so far been associated with BMD.45 Molecular studies have shown a link between osteoporosis and genes responsible for the regulation of bone metabolism, with a close correlation between the disorder and the vitamin D–receptor gene.46 Studies showed that femoral bone strength and BMD for black ancestral groups were greater compared to white groups.47 White American females demonstrated a higher prevalence of osteoporosis and low BMD in comparison with their male counterparts and black females.47,48 In white females, fracture risk corresponds to maternal family history, suggesting a genetic predisposition for higher fracture risk and lower BMD.49 Moreover, South African and black American females showed fewer BMD differences than differences between black and white groups from the same geographic area, demonstrating the impact of genetics on BMD.47 Furthermore, a study on 112 female twin pairs revealed a genetic influence on BMD values.50 According to the results, 60%–80% of individual femoral neck BMD was attributable to genetic factors. Similar results were obtained in other studies.51 Although a great amount of evidence exists for a population/genetic effect on BMD variation, ancestry often masks other factors that might account for BMD variance, such as diet, activity, and socioeconomic status, which should be taken into consideration depending on the context.52
Lifestyle
Genes and environment interact influencing bone metabolism.11–13 Individual habits, such as diet, exercise, alcohol intake, and smoking, also have an impact on BMD. A positive relationship between mechanical strain and BMD has long been noted. BMD changes in response to loading exhibit variation depending on the type, duration, intensity, and frequency of physical activities.53 Clinical studies support that low- or moderate-intensity exercise enhances BMD in young adults and postmenopausal women,54 while no effect is reported for middle-aged men.55 However, physical activity has been shown to be beneficial for general bone health across the age spectrum, optimizing peak bone mass and mitigating the age-related decline in BMD.56
Diet affects general bone health as bone cells responsible for the remodeling process respond to nutritional intake and bones serve as storage sites for minerals, maintaining a balance between absorption and excretion. Among the vitamins and minerals that contribute to a healthy skeleton, calcium, vitamins D, C and K, manganese, potassium, and zinc are considered particularly important.39 Moreover, variability in the amount of physical activity, as well as variation in calcium intake, can differentially affect BMD over the life course. Beshgetoor et al57 found that femoral and lumbar spine BMD increased with time, while a decrease was observed for the control sample, with no interaction effect being reported between sport and calcium intake in relation to BMD. Although calcium is considered an essential nutrient for bone health, it is difficult to establish the optimal calcium intake due to interactions among diet, physical activity, postmenopausal hormonal changes, and genetics.57 A study on children and adolescents investigating calcium intake, exercise, age, sex, genetics, hormonal status, and weight found that the highest correlations with BMD were for pubertal development and weight in girls and boys, respectively.58
Magnesium supplementation will also increase BMD.39 A positive correlation has been reported between magnesium intake and BMD in the femoral neck and hip, but no correlation was found for magnesium intake and BMD in the lumbar spine or total risk of fracture.59 Overall, additional data sets with larger samples and controlling for other possible influences on BMD are required to reach further conclusions on the effect of vitamins and minerals on BMD.
High consumption of alcohol is expected to have a negative effect on BMD.60,61 Higher calcium intake is associated with decreased bone loss, but alcohol consumption is correlated with low calcium level and bone loss. However, when both alcohol and calcium intake are high, decreased bone loss is observed.55
Pathology
Metabolic diseases alter normal bone-turnover rates, producing changes in the organic and mineral matrix, and thus affect either the mineral or organic components of the skeleton, increasing the fragility of the bone itself.38 The effect of metabolic disease on the degree of mineralization varies depending on bone-turnover rates. High turnover will disrupt mineralization due to a reduction between remodeling cycles, while low bone turnover will increase mineralization at any bone site due to an increase in time span between remodeling cycles.16 The spatial distribution and heterogeneity of minerals within the bone matrix may be another factor contributing to increased bone fragility due to metabolic disease. As a consequence, individuals with a high risk of osteoporotic fracture demonstrate a higher degree of heterogeneity in mineral-density distribution, possibly indicating that the mechanisms controlling remodeling fail to regulate the extreme mineralization of tissue areas that are likely to be mechanically weaker and more prone to fracture.39 Nonetheless, other research has proposed that the regional variation in BMD distribution might respond to functional demands related to the sensitivity of bone to strain in susceptible bone areas.62
Osteoporosis is understood as a continuum, embracing multifactorial pathogenic mechanisms and involving systemic and local bone-cell regulators as well as the interaction of receptors and nuclear transcription factors.36 As such, the osteoporosis spectrum is complex and heterogeneous, and bone densitometry has demonstrated different rates of bone loss depending on skeletal site and life stage.38 Moreover, secondary osteoporosis—not occurring in relation to any underlying disease or medication and mostly seen in postmenopausal females and males of advanced age63—can be seen associated with a wide variety of underlying conditions, such as rheumatoid arthritis, osteogenesis imperfecta, hyperthyroidism, Turner syndrome, or chronic alcoholism, among others.38
Trauma
The ability of skeletal elements to resist applied forces is linked to bone mineralization, a primary determinant of strength and stiffness in compression. While higher mineralization increases these properties, it will also increase bone brittleness, thereby decreasing toughness and augmenting the risk of bone trauma.64 In addition to BMD, bone resistance to fracture is shaped by other structural and microstructural properties like cortical thickness, cross-sectional area, moment of inertia, cortical porosity, and microcracks. Crystallinity also contributes; a higher number of large bone crystals with age increases brittleness by decreasing bone’s mechanical properties, thus making the bone more prone to fracture.65 Another complication associated with fragility and bone fracture might be systemic bone loss after fracture, as witnessed in experimental and clinical studies.66 In limb fractures, BMD within the injured limb decreases after fracture from 3% to 31% compared to baseline values measured close to the time of fracture.67–70 This is a result of reduced formation of bone following fractures while resorption levels either remain unchanged or increase.71 In part, the bone recovers with time, but bone mass may never return to the initial levels.66 Fractures trigger bone loss not only locally, within the damaged region, but also systemically, affecting other skeletal sites.66,72
Methods of BMD quantification
In terms of locations for quantification of BMD, several skeletal elements have proven more diagnostic than others. In general, metabolic rate, if considered as rate per volume, is higher in trabecular bone than cortical.73,74 For this reason, the ideal locations for BMD measurements are sites with high trabecular to cortical ratio. These areas are called regions of interest (ROIs). In addition, the degree of perceivable changes in trabecular architecture and density seems to be higher in the axial skeleton, making it the preferred site for screening techniques (eg, spine). Nevertheless, other sites with high trabecular/cortical ratio have also proved suitable ROIs for BMD analysis such as the forearm, tibia, and calcaneus.75
Several methods have been employed on ROIs in order to assess BMD, each presenting both advantages and limitations (Table 1).
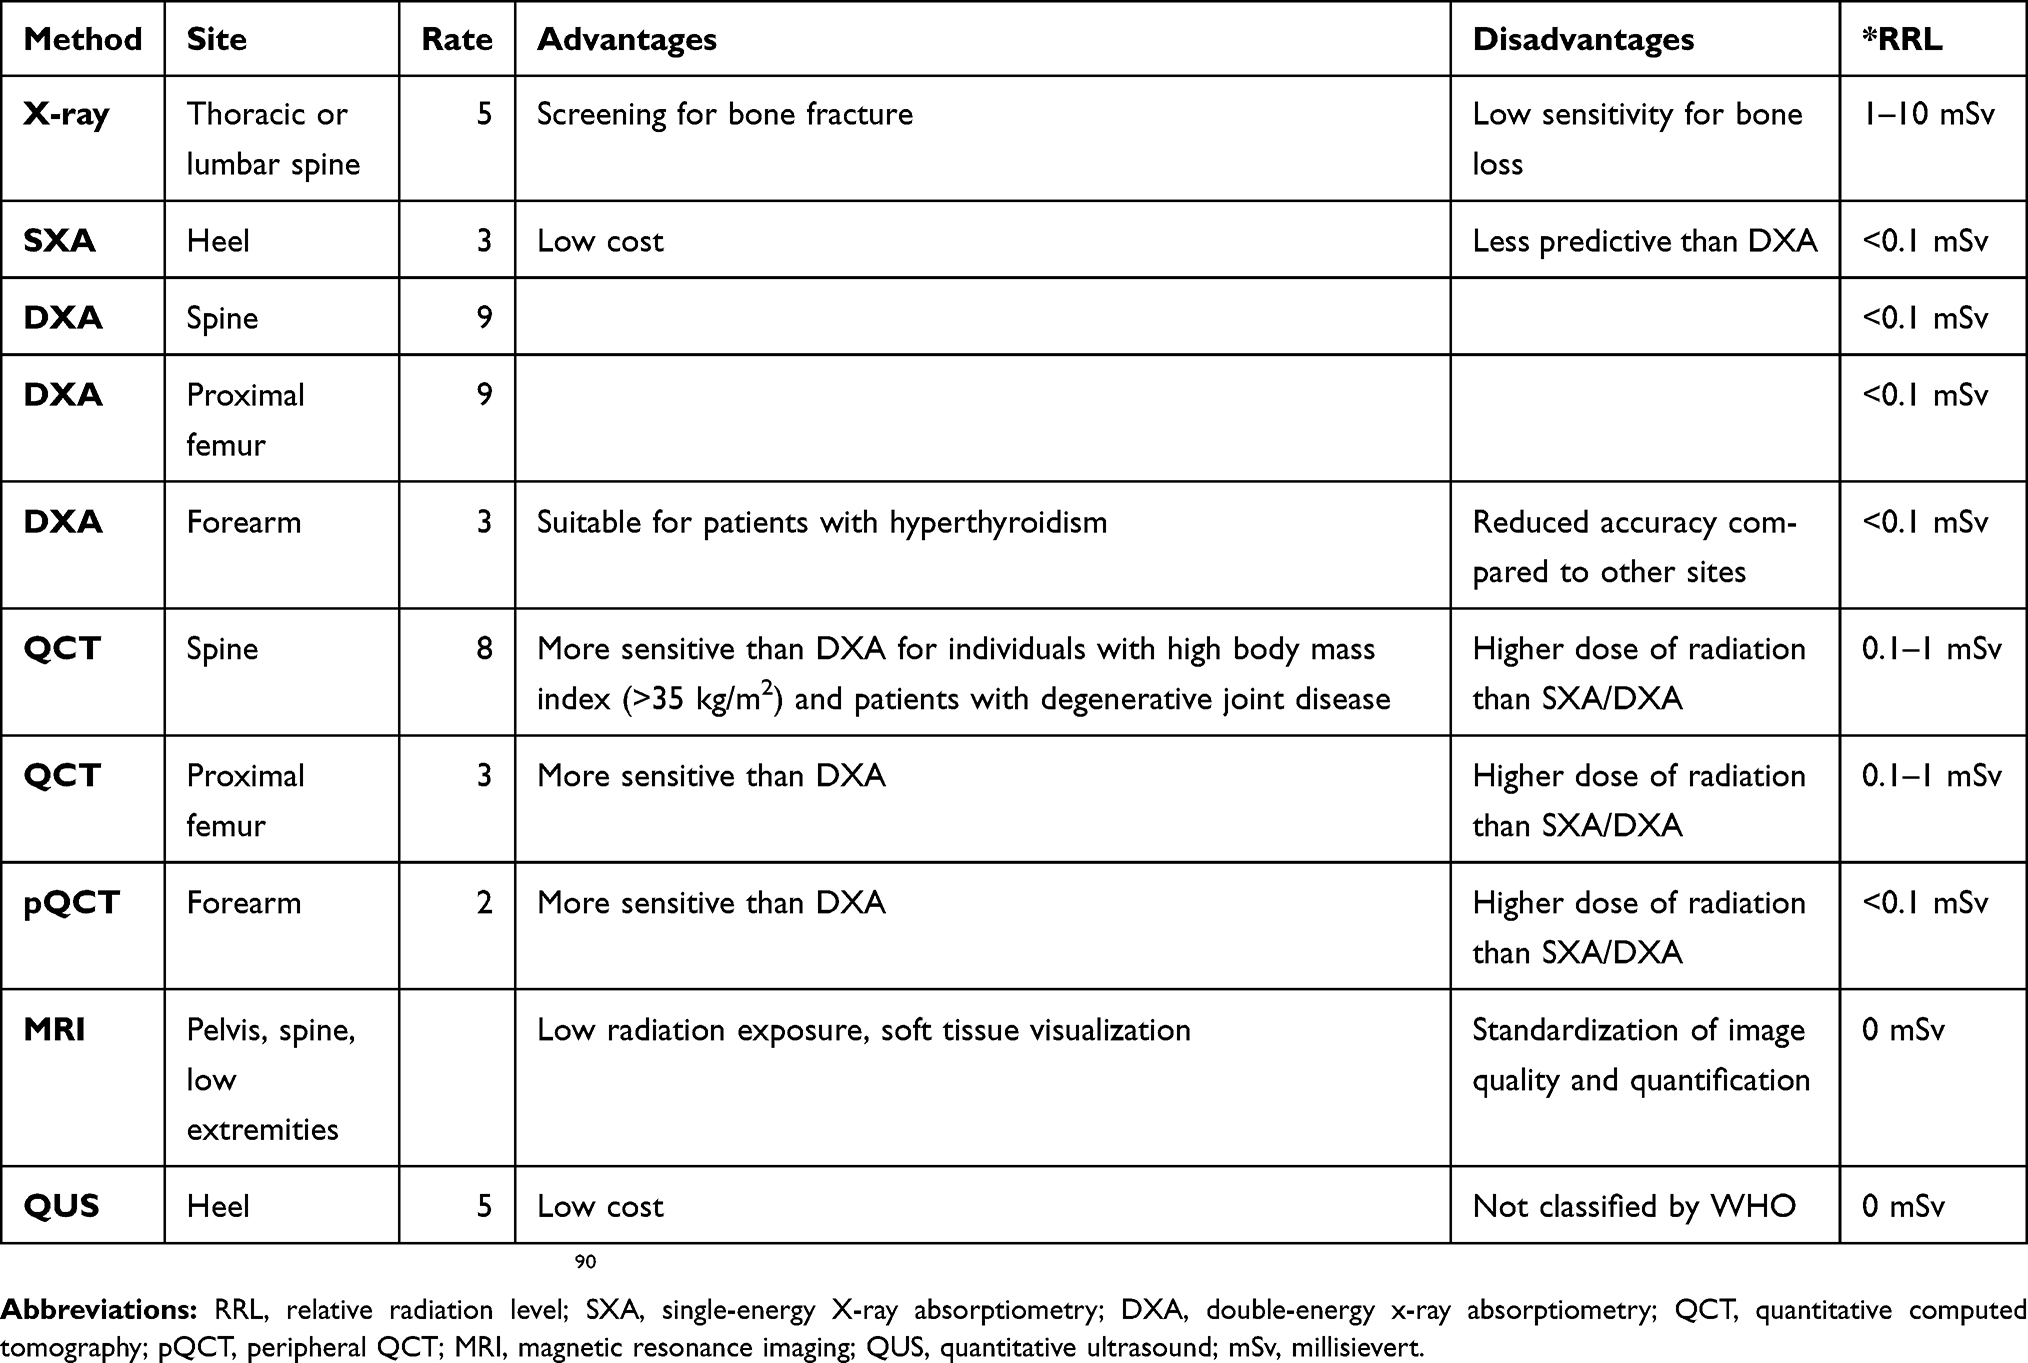 |
Table 1 Advantages and disadvantages of modalities used for assessment of bone mineral density |
Diagnostic radiography/X-ray
X-ray absorption is proportional to the amount of calcium present in bone, and decrease in bone mass becomes apparent after a reduction of 20%–40% in BMD. X-rays can visualize gross morphology, but do not allow a quantitative evaluation of the degree of bone loss. The three main parameters that can be assessed with radiography and are of interest in the analysis of BMD are trabecular pattern, cortical thinning, and increased radiolucence, all phenomena related to the development/diagnosis of osteopenia and osteoporosis.76 The main use of this technique is to identify factors that could affect the quantification of BMD loss, such as presence of fracture, abnormalities, or other pathological conditions (eg, osteoarthritis). Estimation of BMD itself is heavily affected by observer experience. Radiographic equipment is relatively cheap and widely available, and is a useful screening tool to rule out factors that could affect the correct investigation of bone-mass loss, yet has little utility for actually quantifying BMD.76 Nevertheless, an attempt to quantify BMD in radiography from the neck of the femur in order to evaluate the potential for age estimation has been reported in the literature. It was suggested that grayscale values from X-ray images are directly proportional to BMD. Results showed good correlation between grey scale and BMD values.77
Single-energy photon absorptiometry (SPA) and dual-energy photon absorptiometry (DPA)
SPA, introduced in 196378 for measuring BMD in the appendicular skeleton, normally employs. 125I as a source for a monoenergetic photon (emits an average energy of 27 keV) detected by a sodium iodide counter. The procedure is based on the difference in PA between bone and surrounding soft tissue. Calculation of mineral tissue is expressed in grams over square centimeters scanned. Advantages include the accuracy and precision of the measurement and the low radiation dose the patient is exposed to during the examination. Drawbacks include the fact that the object of study might consist of only two materials with different absorption coefficients, which means that the method may fail to distinguish cortical from trabecular bone. Changes in the thickness of the surrounding soft tissue may also increase variation. Therefore, the main targets remain the distal radius, followed by the calcaneus, humerus, femur, and fingers.76,79,80 The same physical principle was later applied in dual-energy PA (DPA) in order to avoid the inconsistency introduced by the variation in thickness of the soft tissue surrounding the bone. It employs a dual-energy radionuclide, usually emitted from a 153Gd source and keV that allows deeper penetration power for structures such as the spine. Calculating the attenuation of the two energies gives an approximation of soft-tissue thickness. The result is a measurement of BM contentthat, divided by the area, provides an estimation of BMD. The main targets for this examination are L2–L5 and the femoral neck, although a certain degree of disagreement about the ideal location for the test exists in the literature. Similarly to SPA, it presents good precision, accuracy, and low radiation exposure for the patient, with no variation due to different orientation of the sample.76,79,80
Neutron activation
This technique is based on the activation of 48Ca to 49Ca (other elements used are Na, Cl, and P) and quantification of γ-rays, which enables the amount of the original element present. The target is enclosed in a polyethylene structure to control the uniformity of neutron flux. The subject is then placed on a bed with an NaI receptor that counts the photons emitted, and the spectrum is then subtracted by the one created from a calibrated phantom. This gives an estimation of bone-calcium content, because 98% of the calcium in the body is of skeletal origin.79 The main limitation is the amount of radiation the patient is exposed to. This could be controlled by using other elements as neutron source, although irradiation geometry must be taken into consideration to give greater stability to the measurement.
Single-energy X-ray absorptiometry (SXA and double-energy x-ray absorptiometry (DXA)
SXA was developed to solve problems related to decay of the photon source. It employs an X -ray tube, and the main target for the examination is the forearm, specifically the area where radius and ulna are 8 mm apart. The procedure is quick, but, as in DPA, has some limitations, mainly concerning the detection of fracture in ROIs that could affect BMD measurement.81 Nowadays, DXA is the most commonly used procedure for assessing variations in BMD. The improved spatial resolution and precision, speed of execution and, thus limited radiation exposure make this technique by far more efficient than previous ones. To evaluate BMD, the attenuation properties of different materials are calculated in relation to the energy of photons. Various locations can be used for the test, with the lower spine and femur being the most popular. A full-body scan is also commonly performed. Another advantage is that the measurement is expressed as an absolute value of aBMD (g/cm2). This allows direct comparison across studies and time to analyze age and sex trends or compare previous scans to evaluate a patient’s clinical history.76,82 DXA also calculates body mass and distinguishes between lean and fat mass, due to differences in tissue-attenuation properties. This allows monitoring of patients’ general health conditions that could affect BMD loss.83 As a number of errors can affect the estimation (eg, precision of the algorithm, correct calibration, external artifacts), great attention is given to quality checks when performing this test as incorrect evaluation could lead to erroneous clinical decisions.84 A major drawback is the lack of consistency in measurements between instruments from different producers: this can reach up to 20% of variation between two scans.
Quantitative computed tomography (QCT)
QCT is the alternative methodology to DXA for accurate BMD assessment. The standard procedure for axial QCT involves scanning the patient laying on a calibration phantom to convert the Hounsfield units (HU) into vBMD, and the image is acquired laterally. The measurements taken between T12 and L4 are converted to physical density in accordance with the reference sample, and vBMD is measured in grams per cubic centimeter. The issue of measurements taken on scanners from different manufacturers is normally solved by creating a standard calibration that is also specific to the bone targeted in the analysis. The increased exposure to radiation is higher compared to DXA analysis (60 µSv for single-energy CT compared to 1 µSv), which increases resolution and improves discrimination of uncalcified tissue. Despite this, fat mass remains the main factor that induces quantification error. Dual-energy QCT represents a potential solution, due to its higher penetration power, and age-related regression can correct potential underestimation of BMD.75,76,85 A further way to reduce exposure is the employment of volumetric QCT (vQCT). This allows the acquisition of larger portions of bone in a few seconds. It also provides increased precision, with only 5%–10% deviation from the actual value. A variation of axial and vQCT is the single-slice CT, where a slice of 8–10 mm thickness is automatically selected as the ROI. Automated selection and evaluation of the ROIs under analysis clearly represent a great advantage, in order to give consistency to the examination. In terms of quantitative analysis, although no absolute agreement is present in the literature, a BMD value of <80 mg/cm3 is considered symptomatic of osteoporosis. The main advantages of CT-based methods include the possibility of identifying artifacts created by degenerative joint disease or arterial calcification (common in elderly individuals) and restricting measurement to trabecular bone, which would not be possible with DXA. Similarly, when examining obese patents, the ability of CT analysis to isolate bone-tissue largely reduces the noise encountered in XA. However, due to the possibility of obtaining quick and accurate results, DXA remains the routinely used procedure for assessing degeneration of bone structure.75,76,85 Peripheral QCT (pQCT) is a low-radiation-dose analysis that has been developed for areas like the distal radius and ulna. Although the potential in application of this technique is great, it is used mainly for treatment control. A further improvement that shows promising results is high-resolution pQCT, which noticeably reducesthe signal-to-noise ratio and spatial resolution.75,76
Another recent implementation is biomechanical CT, which employs finite-element-analysis (FEA) models to predict mechanical properties of the structure and fracture risk. Material properties are given to the model in accordance with grayscale values obtained by cadaveric experiments. A controlled load is then applied to the model, in order to recreate a standardized mechanical test or physiological loading. The potential of the approach relies on its capacity to predict risk of fracture and monitor treatment efficiency. The primary limitation of this technique is that it does not account for a number of factors – collagen quality, mineral crystal structure, microdamage – that can noticeably affect the estimation.76,86
Magnetic resonance imaging (MRI)
In MRI, due to the lack of ionization, bone is visualized as low-intensity spaces in the high-intensity soft tissue. The target of the examination is the peripheral skeleton in locations where the trabecular area is larger and contrast with fat bone marrow enhanced. Quantitative analysis is normally carried out in steps –– binarization, registration, and segmentation –– following semiautomated protocols that enhance reproducibility of the measurement. With this procedure, several parameters of bone density and microarchitecture (bone volume/total volume, vBMD, trabecular number, trabecular thickness, and trabecular separation) are quantified. The main advantage is the lack of exposure to ionizing radiation. Although notable advances in this type of imaging have occurred in the last few decades and fully automated protocols for structural analysis have been developed, the difficulties in standardizing image quality and quantification, combined with the high cost of the technique, have ensured that DXA and QCT remain the top choices for BMD assessment.76,87
Quantitative ultrasound (QUS)
QUS represents a noninvasive procedure to investigate skeletal disorders. The clear advantages are low cost and the fact that patients receive no radiation dose. The main difference with the previous procedures is that no image is created. The propagation of the waves causes a displacement in the medium that is proportional to elastic properties and mass density. The frequency usually employed is between 200 kHz and 1.5 MHz. In order to quantify bone-mass density, the quantitative ultrasound index (QUI) has been developed, involving a combination of evaluated speed of sound (meters per second) and broadband ultrasound attenuation (BUA in decibels per megahertz).88 The most common locations this procedure is applied to are the calcaneus and phalanx, but other long-bone sites can also be assessed, such as the tibial and radial midshaft. The necessity of interpreting results represents the first drawback, as specialized personnel are required.2 Furthermore, as the devices used are portable, environmental conditions must be taken into consideration, as they can affect the measurement. It can also be applied to the investigation of bone elastic properties. Despite the great potential of this examination, it is clear that further validation is necessary before it achieves more widespread use.79,89
Compton scattering
Compton scattering is used mainly for research and normally applied on the radius or calcaneus. It is based on the diffraction pattern of γ-rays compared to the transmitted portion as a function of mineral content in a specified volume of material. It is employed after scanning and identifying the ideal location using low-intensity X-rays, due to the possibility of clearly discriminating between cortical and trabecular bone. The monoenergetic collimated beam is detected by a collimated receptor at a known angle so that the scattering intensity can give an estimation of BMD. This technique differentiates between the organic and inorganic components of bone tissue, as scattering volume directly probes trabecular bone total density per unit volume. Although the methodology has proven to be extremely efficient and accurate for in vitro studies, clinical applicability is limited, due to the difficulty in assessing bone volume consistently and accurately. Similarly, difficulties have been encountered regarding the choice of a unique phantom that can make measurements comparable between different instruments.79
Applications in forensic medicine
DXA and CT are the most frequently used methods of BMD quantification in forensic medicine. DXA’s main use is as a diagnostic tool for such pathologies as osteopenia, osteoporosis, and osteomalacia, but it has also been used in forensic applications such as estimation of age, sex, and ancestry.19,91,92 Other methods, such as X-Rays and MRI, have been increasingly used to assess fractures and foreign objects or to estimate age in living individuals. However, they are not currently employed to quantify BMD for forensic purposes.
Sex, age, and ancestry BMD applications
Sex differences in BMD values have been explored with DXA on several skeletal elements. It is widely known that BMD values decline more quickly in postmenopausal females and osteoporotic patients. DXA studies on the femur have shown a positive correlation of height and weight with BMD, which was more pronounced in males than females.19 These results contradict those of Paschall and Ross,40 who reported no sex differences in the BMD values of the femoral neck, yet the same study reported BMD differences between sexes in the cranium. Fisher et al91 found sex differences in BMD levels of the hyoid bone. In fact, sex discrimination reached 64% accuracy when BMD was used as a single variable. Curate et al93 quantified BMD in the total area of the femur (the sum of femoral neck, trochanteric region, and intertrochanteric/proximal diaphysis) to develop sex estimation formulae and reached 91% accuracy. Sex differences in BMD levels are not always enough as a single indicator to provide sex-estimation methods of forensic value. However, the existence of sexual dimorphism in age-related changes in BMD suggests that BMD could be used in conjunction with other variables to improve sex-prediction models.91
A new method (DXAGE) for age estimation using femur BMD from 100 female Portuguese individuals was developed by Navega et al,94 producing an error range of 9.19–13.49 years between known age and predicted age. The authors highlighted the potential of BMD for estimating age in forensic cases and for incomplete human remains. Bethard et al95 tested DXAGE on a large sample of female American individuals, obtaining higher bias and inaccuracy than expected. Error variation depended on the age cohort, suggesting caution in application of the method for forensic cases. More validation studies are required to ensure accurate outcomes. Regarding the application of BMD methods, interobserver error, subjectivity, and observer experience do not bias the results, as is the case with most anthropological methods.94,95 However, taphonomic influences need to be taken into consideration for both forensic and archeological skeletal material. It is well known that chemical changes in bone due to diagenetic processes alter BMD values.20,94
Castillo and Ruiz19 investigated the relationship of femoral BMD with sex, age, and body mass index (BMI) in a sample of 70 individuals. The ROIs selected for this study were the femoral neck, trochanter, the intertrochanter, the proximal femur, and Ward’s triangle. The highest correlation of age with BMD values was observed at the Ward’s triangle. The authors provided sex-specific regression equations for estimation of age based on BMD values at the Ward’s triangle, with R2 of 0.886 (SE 4.149 years) and 0.919 (SEE 4.855 years) for males and females respectively. Paschall and Ross40 hypothesized that BMD values from weight and non-weight-bearing bones could provide information about sex and age variation. To test this hypothesis, the authors explored BMD differences in femora and crania and concluded that the former was correlated with age, while the latter presented sex variation. They provided an age-estimation formula derived from femoral neck BMD for pooled samples, with an error of 13 years. Wheatley96 considered the effect of ethnicity on femoral BMD. In agreement with other studies, he found statistically significant differences between black and white females in BMD of Ward’s triangle.47 Ethnic differences were also confirmed in BMD levels of femoral neck, total hip, and lumbar spine in postmenopausal women of similar BMI.97 Meeusen et al92 explored the value of the femoral neck axis in sex and ancestry estimation using DXA in a sample of black, white, and native Americans. Accuracy for sex estimation reached 86%, but for ancestry it did not exceed 56%. In summary, while ethnicity differences are reported, differences have not been well defined enough to allow for reliable and accurate ancestry estimation.
Other forensic applications
BMD comprises a useful metric to explore cases of fatal starvation or neglect in juveniles.21,98 Neglected and malnourished children have delayed skeletal maturation and weight and height values in the lower-third percentile of standard growth charts.98 DXA can be applied in living patients and is considered ideal for children as it is quick and minimally invasive. It can also be applied in skeletonized remains without any severe taphonomic alterations or weathering. A case study of an 11-month-old deceased infant that was assessed for negligence and malnutrition is reported by Ross.98 Lumbar spine was selected for DXA for two reasons: it is considered the most reproducible location for measuring BMD and it contains a larger amount of trabecular bone which is more sensitive to metabolic changes.98 Next the Z-score was calculated as follows:

According to the World Health Organization, a Z-score is considered the best system to compare a child’s anthropometric values to the reference population mean (WHO Global Database on Child Growth and Malnutrition, 1997).99 Total BMD (g/cm2) for L1–L4 for the 11-month-old infant was 0.226, while the BMD values for a group of newborns and 1-year-old infants were 0.336 g/cm2 and 0.339 g/cm2, respectively. Z-scores were calculated for each normal group and were found to be less than −2 which is the pediatric standard of low bone density.98 As such, the infant had lower BMD than expected compared to both newborns and 12-year-old children. This evidence in combination with other forensic findings could corroborate malnutrition and negligence.
Often in clinical forensic medicine, inquiries involve alleged abuse or neglect in familial or institutional environments, misconduct of paramedical personnel in rehabilitation clinics or elder shelters, and torture by means of violence or starvation. BMD values in living individuals, both children and elderly, can provide important insight into alleged cases of abuse or neglect. Differences in BMD ranges between noninstitutionalized individuals and age- and sex-matched controls that cannot be explained with pathological or hereditary evidence should alert physicians for cases of possible professional misconduct or abuse.
An important forensic question in a variety of incidents is the mechanism of inflicted trauma in relation to the observed or reported evidence. Skeletal trauma patterns are influenced by a variety of intrinsic and extrinsic factors that define the final outcome. Extrinsic factors include the force and velocity of impact, as well as the shape and area of contact with the human body. Intrinsic factors include all individual characteristics, such as position of the body, bone strength, and all the factors affecting it (eg, age and pathology).100 Biomechanical CT allows for modeling of the human body using quantified material properties for BMD and soft -issue density and subsequent simulation of any event. FEA models are currently employed to assess mechanisms of head injury during shaking, impact, fall, and gunshot incidents in forensic scenarios.101–104
The well-established association of BMD with age, sex, stature, weight, diet, physical exercise, pathology, and genetics suggests that it can be used as a predictor in a variety of forensic scenarios in both living and deceased individuals. For example, the combination of FEA modeling of the human skeleton and individual BMD of a deceased individual with the use of postmortem CT can allow scientists to explore if fatal fractures on the individual could have been a result of pathological conditions, such as spontaneous fractures due to osteoporosis or chronic alcoholism, as opposed to intentional violence. Personalized FEA modeling can better explain variations from the mean than when generalized FEA models are used.
Precautionary notes and recommendations
The first and most important step in the application of BMD quantification in clinical and forensic medicine is selection of the appropriate modality, which is highly dependent on the purpose of the examination. For example, when using DXA for BMD quantification and comparison to a reference sample, one should pay attention to the calibration of the device and the use of phantoms as these products may vary between different commercial suppliers. BMD varies with skeletal site, which also impacts the interpretation of the findings.105 Table 1 lists pros and cons of imaging modalities in relation to skeletal sites for BMD assessment.
In addition, postmortem intervals will have an impact on the reliability of BMD quantification. Ross98 confirmed empirically that skeletal remains without severe postmortem alteration or weathering can be assessed using DXA, but archeological remains with postmortem breakage exposing bone fragments to soil or other environments are certainly problematic.106 Hale and Ross107 also considered the effect of freezing on DXA measurement of BMD in surrogate models. This study found that BMD values increased consistently during the freezing process, which concurs with previous studies.108 For frozen specimens, Sutlovic et al20 found inconsistencies in the correlation of BMD readings from DXA and chemically derived values of calcium and phosphorus. Therefore, for accurate BMD readings, it is recommended that thawed specimens be used.107
Genetic and sex variation in BMD is well established in the literature, yet a debate exists on the use of a single-ethnicity reference population for evaluating BMD. For example, when predicting fracture risk, rather than a representation of genetic differences in bone-structure properties, ethnicity may well be a proxy for other factors, such as socioeconomic status, diet, and physical activity.52 This should be considered in forensic applications and the selection of reference samples. Interpretation of BMD values of the target sample should likewise be done with exceptional caution. Naturally, comparisons of skeletal remains without context to any reference sample cannot be evaluated with a high degree of confidence.106
Conclusion
BMD is highly correlated with age, sex, stature, weight, diet, physical exercise, pathology, and genetics, which makes it a useful predictor in a variety of forensic scenarios involving both living and deceased individuals. Despite technical and methodological inconsistencies reported in the literature on BMD, there is considerable scope for expanding the use of this variable in forensic settings.
Acknowledgment
The authors would like to thank Ben Osipov for his constructive comments and English review.
Disclosure
The authors report no conflicts of interest in this work.
References
1. Boivin G, Bala Y, Doublier A, et al. The role of mineralization and organic matrix in the microhardness of bone tissue from controls and osteoporotic patients. Bone. 2008;43(3):532–538. doi:10.1016/j.bone.2008.05.024
2. Currey JD. The many adaptations of bone. J Biomech. 2003;36(10):1487–1495. doi:10.1016/S0021-9290(03)00124-6
3. Currey JD, Brear K, Zioupos P. The effects of ageing and changes in mineral content in degrading the toughness of human femora. J Biomech. 1996;29(2):257–260. doi:10.1016/0021-9290(95)00048-8
4. Wang X, Shen X, Li X, Mauli Agrawal C. Age-related changes in the collagen network and toughness of bone. Bone. 2002;31(1):1–7. doi:10.1016/S8756-3282(01)00697-4
5. Bala Y, Depalle B, Douillard T, et al. Respective roles of organic and mineral components of human cortical bone matrix in micromechanical behavior: an instrumented indentation study. J Mech Behav Biomed Mater. 2011;4(7):1473–1482. doi:10.1016/j.jmbbm.2011.05.017
6. Hirano T, Turner CH, Forwood MR, Johnston CC, Burr DB. Does suppression of bone turnover impair mechanical properties by allowing microdamage accumulation? Bone. 2000;27(1):13–20. doi:10.1016/S8756-3282(00)00284-2
7. Crockett JC, Rogers MJ, Coxon FP, Hocking LJ, Helfrich MH. Bone remodelling at a glance. J Cell Sci. 2011;124(7):991–998. doi:10.1242/jcs.063032
8. Deng HW, Xu FH, Davies KM, Heaney R, Recker RR. Differences in bone mineral density, bone mineral content, and bone areal size in fracturing and non-fracturing women, and their interrelationships at the spine and hip. J Bone Miner Metab. 2002;20(6):358–366. doi:10.1007/s007740200052
9. Srinivasan B, Kopperdahl DL, Amin S, et al. Relationship of femoral neck areal bone mineral density to volumetric bone mineral density, bone size, and femoral strength in men and women. Osteoporos Int. 2012;23(1):155–162. doi:10.1007/s00198-011-1822-8
10. Bailey D, Mckay H, Mirwald R, Crocker P, Faulkner R. A six‐year longitudinal study of the relationship of physical activity to bone mineral accrual in growing children: the University of Saskatchewan bone mineral accrual study. J Bone Miner Res. 2009;14(10):1672–1679. doi:10.1359/jbmr.1999.14.10.1672
11. Simkin A, Ayalon J, Leichter I. Increased trabecular bone density due to bone-loading exercises in postmenopausal osteoporotic women. Calcif Tissue Int. 1987;40(2):59–63. doi:10.1007/BF02555706
12. Kiel DP, Zhang Y, Hannan MT, Anderson JJ, Baron JA, Felson DT. The effect of smoking at different life stages on bone mineral density in elderly men and women. Osteoporos Int. 1996;6(3):240–248. doi:10.1007/BF01622741
13. Berard A, Bravo G, Gauthier P. Meta-analysis of the effectiveness of physical activity for the prevention of bone loss in postmenopausal women. Osteoporos Int. 1997;7(4):331–337.
14. Khurana, JS. Bone Pathology. USA: Humana Press; 2009. doi:10.1007/978-1-59745-347-9
15. Hernlund E, Svedbom A, Ivergård M, et al. Osteoporosis in the European Union: medical management, epidemiology and economic burden. A report prepared in collaboration with the International Osteoporosis Foundation (IOF) and the European Federation of Pharmaceutical Industry Associations (EFPIA). Arch Osteoporos. 2013:8–136. doi:10.1007/s11657-013-0136-1
16. Peel N. Disorders of bone metabolism. Orthop I Gen Princ. 2017;36(1):15–20. doi:10.1016/j.mpsur.2017.10.003
17. Office of the Surgeon General (US). Bone Health and Osteoporosis: A Report of the Surgeon General. Rockville (MD): Office of the Surgeon General (US); 2004.
18. Blake GM, Fogelman I. Methods and clinical issues in bone densitometry. In: Principles of Bone Biology. USA: Academic Press; 2008:1883–1894. doi:10.1016/B978-0-12-373884-4.00021-5
19. Fernadez Castillo R, Lopez Ruiz M. Assessment of age and sex by means of DXA bone densitometry: application in forensic anthropology. Forensic Sci Int. 2011;209:53–58. doi:10.1016/j.forsciint.2010.12.008
20. Sutlovic D, Boric I, Sliskovic L, et al. Bone mineral density of skeletal remains: discordant results between chemical analysis and DXA method. Leg Med. 2016;20:18–22. doi:10.1016/j.legalmed.2016.03.008
21. Hale AR, Ross AH. Scanning skeletal remains for bone mineral density in forensic contexts. J Vis Exp. 2018;29(31):1–19. doi:10.3791/56713
22. Curate F. Osteoporosis and paleopathology: a review. J Anthropol Sci. 2014;92:119–146. doi:10.4436/JASS.92003
23. Elkin DC. Volume density of South American camelid skeletal parts. Int J Oste. 1995;5:29–37. doi:10.1002/oa.1390050104
24. Wang X. Cortical bone mechanics and composition: effects of age and gender. In: Silva M, editor. Skeletal Aging and Osteoporosis. Springer; 2013:53–85. doi:10.1007/978-3-642-32563-2
25. Feng X, McDonald J. Disorders of bone remodeling. Annu Rev Pathol Mech Dis. 2011;6:121–145. doi:10.1146/annurev-pathol-011110-130203.Disorders
26. Squillante RG, Williams JL. Videodensitometry of osteons in females with femoral neck fractures. Calcif Tissue Int. 1993;52(4):273–277. doi:10.1007/BF00296651
27. Havill LM, Allen MR, Harris JAK, et al. Intracortical bone remodeling variation shows strong genetic effects. Calcif Tissue Int. 2013;93(5):472–480. doi:10.1007/s00223-013-9775-x
28. Laval-Jeantet A, Bergot C, Carroll R, Garcia-Schaefer F. Cortical bone senescence and mineral bone density of the humerus. Calcif Tissue Int. 1983;35:268–272. doi:10.1007/BF02405044
29. Riggs BL, Iii LJM, Clinic M. Differential changes in bone mineral density of the appendicular and axial skeleton with aging. J Clin Invest. 1981;67:328–335. doi:10.1172/JCI110039
30. Lee EY, Kim D, Kim KM, Kim KJ. Age-related bone mineral density patterns in Koreans (KNHANES IV). J Clin Endocrinol Metab. 2012;97:3310–3318. doi:10.1210/jc.2012-1488
31. Compston J. Age related changes in bone remodelling and structure in men: histomorphometric studies. J Osteoporos. 2011;2011:1–4. doi:10.4061/2011/108324
32. Weaver CM, Fuchs RK. Skeletal growth and development. In: Burr DB, Allen MR, editors. Basic and Applied Bone Biology. London: Academic Press; 2013:245–260. doi:10.1016/B978-0-12-416015-6.00012-5
33. Alswat KA. Gender disparities in osteoporosis. J Clin Med Res. 2017;9(5):382–387. doi:10.14740/jocmr2970w
34. Petit MA, Macdonald HM, Mckay HA, Lloyd T. Bone acquisition in adolescence . In: Osteoporosis,
35. Hui SL, Slemenda CW, Johnston CC. The contribution of bone loss to postmenopausal osteoporosis. Osteoporos Int. 1990;30–34(1).
36. Raisz LG. Pathogenesis of osteoporosis: concepts, conflicts, and prospects. Sci Med. 2005;115:12. doi:10.1172/JCI27071.3318
37. Frost HM. Bone’s mechanostat: A 2003 update. Anat Rec Part A. 2003;275(A):1081–1101. doi:10.1002/ar.a.10119
38. Khurana J, Fitzpatrick L. Osteoporosis and metabolic bone disease. In: Khurana J, editor. Bone Pathology.
39. Marcus R, Feldman D, Nelson D, Rosen C, editors. Osteoporosis.
40. Paschall A, Ross AH. Biological sex variation in bone mineral density in the cranium and femur. Sci Justice. 2018;58(4):287–291. doi:10.1016/j.scijus.2018.01.002
41. Warming L, Hassager C, Christiansen C; Center for C and BR. Changes in bone mineral density with age in men and women: a longitudinal study. Osteoporos Int. 2002;13:105–112. doi:10.1161/circulationaha.111.039586
42. Karlsson MK, Obrant KJ, Nilsson BE, Johnell O. Changes in bone mineral, lean body mass and fat content as measured by dual energy X-ray absorptiometry: a longitudinal study. Calcif Tissue Int. 2000;66(2):97–99. doi:10.1007/s002230010020
43. Melton LJ
44. Khosla S, Atkinson EJ, Connor MKO, Fallon WMO, Riggs BL. Cross-sectional versus longitudinal evaluation of bone loss in men and women. Osteoporos Int. 2000;1:592–599.
45. Medina-Gomez C, Kemp JP, Trajanoska K, et al. Life-course genome-wide association study meta-analysis of total body BMD and assessment of age-specific effects. Am J Hum Genet. 2018;102(1):88–102. doi:10.1016/j.ajhg.2017.12.005
46. Liu YZ, Liu YJ, Recker RR, Deng HW. Molecular studies of identification of genes for osteoporosis: the 2002 update. J Endocrinol. 2003;177(2):147–196. doi:10.1677/joe.0.1770147
47. Nelson DA, Pettifor JM, Barondess DA, Cody DD, Uusi-Rasi K, Beck TJ. Comparison of cross-sectional geometry of the proximal femur in white and black women from Detroit and Johannesburg. J Bone Miner Res. 2004;19(4):560–565. doi:10.1359/JBMR.040104
48. Melton L, Chrischilles E, Cooper C, Lane A, Riggs B. How many women have osteoporosis? J Bone Miner Res. 1992;7(9). doi:10.1359/jbmr.2005.20.5.886
49. Cummings SR, Nevitt MC, Browner WS, et al. Risk factors for hip fracture in white women. N Engl J Med. 1995;332(12):767–774. doi:10.1056/NEJM199503233321202
50. Seeman E, Hopper JL, Young NR, Formica C, Goss P, Tsalamandris C. Do genetic factors explain associations between muscle strength, lean mass, and bone density? A twin study. Am J Physiol Metab. 1996;270(2):E320–E327. doi:10.1152/ajpendo.1996.270.2.E320
51. Runyan SM, Stadler DD, Bainbridge CN, Miller SC, Moyer-Mileur LJ. Familial resemblance of bone mineralization, calcium intake, and physical activity in early-adolescent daughters, their mothers, and maternal grandmothers. J Am Diet Assoc. 2003;103(10):1320–1325. doi:10.1016/S0002-8223(03)01075-7
52. Miller PD. Controversial issues in bone densitometry. In: Bilezikian J, Lawrence G, Martin T, editors. Principles of Bone Biology.
53. Morseth B, Emaus N, Jørgensen L. Physical activity and bone: the importance of the various mechanical stimuli for bone mineral density. A review. Nor Epidemiol. 2011;20(2):173–178.
54. Nordstrom P, Nordstrom G, Lorentzon R. Correlation of bone density to strength and physical activity in young men with a low or moderate level of physical activity. Calcif Tissue Int. 1997;60(4):332–337.
55. Huuskonen J, Vaisanen SB, Kroger H, Jurvelin JS, Alhava E, Rauramaa R. Regular physical exercise and bone mineral density: A four-year controlled randomized trial in middle-aged men. The DNASCO study. Osteoporos Int. 2001;12(5):349–355. doi:10.1007/s001980170101
56. Kohrt WM, Bloomfield SA, Little KD, Nelson ME, Yingling VR. Physical activity and bone health. Med Sci Sports Exerc. 2004;36(11):1985–1996. doi:10.1249/01.MSS.0000142662.21767.58
57. Beshgetoor D, Nichols JF, Rego I, Effects of training and calcium intake on bone mineral density in female master cyclist, runners and non-athletes. Int J Sport Nutr Exerc Metab. 2000;(10):290–301. doi:10.1123/ijsnem.10.3.290
58. Boot A, de Ridder M, Pols H, Krenning EP, Keizer-Schrama SMPFDEM. Bone mineral density in children and adolescents: relation to puberty, calcium intake, and physical activity. J Clin Endocrinol Metab. 2014;82(1):57–62.
59. Farsinejad-Marj M, Saneei P, Esmaillzadeh A. Dietary magnesium intake, bone mineral density and risk of fracture: a systematic review and meta-analysis. Osteoporos Int. 2016;27(4):1389–1399. doi:10.1007/s00198-015-3400-y
60. Jang H, Hong J, Han K, et al. Relationship between bone mineral density and alcohol intake: a nationwide health survey analysis of postmenopausal women. PLoS One. 2017;12(6)1–11.
61. Tucker KL, Jugdaohsingh R, Powell J, et al. Effects of beer, wine, and liquor intakes on bone mineral density in older men and women. Am J Clin Nutr. 2009;89(4):1188–1196. doi:10.3945/ajcn.2008.26765
62. de Jong WC, van Ruijven LJ, Brugman P, Langenbach GEJ. Variation of the mineral density in cortical bone may serve to keep strain amplitudes within a physiological range. Bone. 2013;55(2):391–399. doi:10.1016/j.bone.2013.04.026
63. Mirza F, Canalis E. Secondary osteoporosis: pathophysiology and management. Eur J Endocrinol. 2015;173:131–151. doi:10.1530/EJE-15-0118
64. Wallace JM. Skeletal Hard Tissue Biomechanics. In: Burr B, Allen M, editors. Basic and Applied Bone Biology. London: Academic Press; 2013:115-130.
65. Augat P, Schorlemmer S. The role of cortical bone and its microstructure in bone strength. Age Ageing. 2006;35(SUPPL.2):27–31. doi:10.1093/ageing/afl081
66. Osipov B, Emami A, Christiansen B. Systemic bone loss after fracture. Clin Rev Bone Miner Metab. 2018;16(4):116–130.
67. Veitch S, Findlay S, Hamer A, Blumsohn A, Eastell R, Bm I. Changes in bone mass and bone turnover following tibial shaft fracture. Osteoporos Int. 2006;17(3):364–372. doi:10.1007/s00198-005-2025-y
68. Ingle B, Hay S, Bottjer H, Eastell R. Changes in bone mass and bone turnover following distal forearm fracture. Osteoporos Int. 1999;10(5):399–407. doi:10.1007/s001980050246
69. Findlay S, Eastell R, Ingle B. Measurement of bone adjacent to tibial shaft fracture. Osteoporos Int. 2002;13(12):980–989. doi:10.1007/s001980200136
70. Ceroni D, Martin X, Delhumeau C, Rizzoli R, Kaelin A, Farpour-Lambert N. Effects of cast-mediated immobilization on bone mineral mass at various sites in adolescents with lower-extremity fracture. J Bone Jt Surg (Am Vol). 2012;93(3):2018–16.
71. Akesson K, Ljunghall S, Jonsson B, et al. Assessment of biochemical markers of bone metabolism in relation to the occurrence of fracture: a retrospective and prospective population-based study of women. J Bone Miner Res. 1995;10(11):1823–1829. doi:10.1002/jbmr.5650101127
72. Petersen M, Gehrchen P, Nielsen P, Lund B. Loss of bone mineral of the hip assessed by DEXA following tibial shaft fractures. Bone. 1997;20(5):491–495.
73. Mullender MG, Van Der Meer DD, Huiskes R, Lips P. Osteocyte density changes in aging and osteoporosis. Bone. 1996;18(2):109–113. doi:10.1016/8756-3282(95)00444-0
74. Clarke B. Normal bone anatomy and physiology. Clin J Am Soc Nephrol. 2008;3(Suppl 3):131–139. doi:10.2215/CJN.04151206
75. Bonnick SL. Bone Densitometry in Clinical Practice - Application and Interpretation.
76. Reiser MF, Hricak H, Knauth M. Osteoporosis and Bone Densitometry Measurements. Berlin (Germany): Springer; 2013.
77. Macchiarelli R, Bondioli L. Linear densitometry and digital image processing of proximal femur radiographs: implications for archaeological and forensic anthropology. Am J Phys Anthropol. 1994;93(1):109–122. doi:10.1002/ajpa.1330930108
78. Cameron J, Sorenson J. Measurement of bone mineral in vivo: an improved method. Science (80-). 1963;142:230–232. doi:10.1126/science.142.3589.230
79. Speller RD, Royle GJ, Horrocks JA. Instrumentation and techniques in bone density measurement. J Phys E Sci Instrum. 1989;22:202–214. doi:10.1088/0022-3735/22/4/001
80. Chugh T, Kumar A, Kumar R, Mehrotra P. Bone density and its importance in orthodontics. J Oral Biol Craniofacial Res. 2013;3(2):92–97. doi:10.1016/j.jobcr.2013.01.001
81. Panel E, Robert I, Roberts CC, et al. Appropriateness criteria osteoporosis and bone mineral density. J Am Coll Radiol. 2017;14:S189–S202. doi:10.1016/j.jacr.2017.02.018
82. Glüer CC. 30 years of DXA technology innovations. Bone. 2017;104:7–12. doi:10.1016/j.bone.2017.05.020
83. Shepherd JA, Ng BK, Sommer MJ, Heymsfield SB. Body composition by DXA. Bone. 2017;104:101–105. doi:10.1016/j.bone.2017.06.010
84. Morgan SL, Prater GL. Quality in dual-energy X-ray absorptiometry scans. Bone. 2017;104:13–28. doi:10.1016/j.bone.2017.01.033
85. Manske SL, MacDonald HM, Nishiyama KK, Boyd SK, McKay HA. Clinical tools to evaluate bone strength. Clin Rev Bone Miner Metab. 2010;8(3):122–134. doi:10.1007/s12018-009-9066-2
86. Keaveny TM. Biomechanical computed tomography-noninvasive bone strength analysis using clinical computed tomography scans. Ann N Y Acad Sci. 2010;1192(1):57–65. doi:10.1111/j.1749-6632.2009.05348.x
87. Kraiger M, Martirosian P, Opriessnig P, et al. A fully automated trabecular bone structural analysis tool based on T2*-weighted magnetic resonance imaging. Comput Med Imaging Graph. 2012;36(2):85–94. doi:10.1016/j.compmedimag.2011.07.006
88. Pais R, Campean R, Simon SP, Bolosiu CR, Muntean L, Bolosiu HD. Accuracy of quantitative ultrasound parameters in the diagnosis of osteoporosis. Cent Eur J Med. 2010;5(4):478–485. doi:10.2478/s11536-009-0076-8
89. Glüer CC, Eastell R, Reid DM, et al. Association of five quantitative ultrasound devices and bone densitometry with osteoporotic vertebral fractures in a population-based sample: the OPUS Study. J Bone Miner Res. 2004;19(5):782–793. doi:10.1359/JBMR.040304
90. Ward RJ, Roberts CC, Bencardino JT, et al. ACR Appropriateness Criteria®Osteoporosis and bone mineral density. J Am Coll Radiol. 2017. doi:10.1016/j.jacr.2017.02.018
91. Fisher E, Austin D, Werner HM, Chuang YJ, Bersu E, Vorperian HK. Hyoid bone fusion and bone density across the lifespan: prediction of age and sex. Forensic Sci Med Pathol. 2016;12(2):146–157. doi:10.1007/s12024-016-9769-x
92. Meeusen RA, Christensen AM, Hefner JT. The use of femoral neck axis length to estimate sex and ancestry. J Forensic Sci. 2015;60(5):1300–1304. doi:10.1111/1556-4029.12820
93. Curate F, Albuquerque A, Ferreira I, Cunha E. Sex estimation with the total area of the proximal femur: a densitometric approach. Forensic Sci Int. 2017;275:110–116. doi:10.1016/j.forsciint.2017.02.035
94. Coelho O, Sc M, Navega D, Sc M, Ph D. DXAGE: a new method for age at death estimation based on femoral bone mineral density and artificial neural networks*. J Forensic Sci. 2018;63(2):497–503. doi:10.1111/1556-4029.13582
95. Bethard JD, Berger JM, Maiers J, Ross AH. Bone mineral density adult age estimation in forensic anthropology: a test of the DXAGE application. J Forensic Sci. 2018;3–6. doi:10.1111/1556-4029.13987
96. Wheatley BP. An evaluation of sex and body weight determination from the proximal femur using DXA technology and its potential for forensic anthropology. Forensic Sci Int. 2005;147:141–145. doi:10.1016/j.forsciint.2004.09.076
97. Nam H-S, Kweon -S-S, Choi J-S, et al. Racial/ethnic differences in bone mineral density among older women. Int J Exerc Sci. 2013:190–198. doi:10.1007/s00774-012-0402-0
98. Ross AH. Fatal starvation/malnutrition: medicolegal investigation from the Juvenile Skeleton. In: Ross AH, Abel, SM, editors. The Juvenile skeleton in Forensic Abuse Investigations. USA: Springer; 2011:151–165. doi:10.1007/978-1-61779-255-7
99. De Onís, M and Blössner M. WHO Global Database on Child Growth and Malnutrition. Geneva: World Health Organization, 1997.
100. Kranioti E. Forensic investigation of cranial injuries due to blunt force trauma: current best practice. Res Reports Forensic Med Sci. 2015;5:25–37. doi:10.2147/RRFMS.S70423
101. Roth S, Vappou J, Raul JS, Willinger R. Child head injury criteria investigation through numerical simulation of real world trauma. Comput Methods Programs. 2009;93(1):32–45. doi:10.1016/j.cmpb.2008.08.001
102. Tse KM, Bin TL, Yang B, Tan VBC, Lee HP. Effect of helmet liner systems and impact directions on severity of head injuries sustained in ballistic impacts: a finite element (FE) study. Med Biol Eng Comput. 2017;55(4):641–662. doi:10.1007/s11517-016-1536-3
103. Jiang B, Zhu F, Cao L, Presley BR, Shen M, Yang KH. Computational study of fracture characteristics in infant skulls using a simplified finite element model. J Forensic Sci. 2017;62(1):39–49. doi:10.1111/1556-4029.13241
104. Raul JS, Baumgartner D, Willinger R, Ludes B. Finite element modelling of human head injuries caused by a fall. Int J Legal Med. 2006;120(4):212–218. doi:10.1007/s00414-005-0018-1
105. Clarke BL, Ebeling PR, Jones JD, et al. Predictors of bone mineral density in aging healthy men varies by skeletal site. Calcifed Tissue Int. 2002:137–145. doi:10.1007/s00223
106. Manifold BM. Bone mineral density in children from anthropological and clinical sciences: a review. Gruyter Open. 2014;77(2):111–135. doi:10.2478/anre-2014-0011
107. Hale AR, Ross AH. The impact of freezing on bone mineral density: implications for forensic research. J Forensic Sci. 2017;62(2):399–404. doi:10.1111/1556-4029.13273
108. Wähnert D, Hoffmeier KL, Lehmann G, Fröber R, Hofmann GO, Mückley T. Temperature influence on DXA measurements: bone mineral density acquisition in frozen and thawed human femora. BMC Musculoskelet Disord. 2009;10:25. doi:10.1186/1471-2474-10-25
 © 2019 The Author(s). This work is published and licensed by Dove Medical Press Limited. The
full terms of this license are available at https://www.dovepress.com/terms
and incorporate the Creative Commons Attribution
- Non Commercial (unported, 3.0) License.
By accessing the work you hereby accept the Terms. Non-commercial uses of the work are permitted
without any further permission from Dove Medical Press Limited, provided the work is properly
attributed. For permission for commercial use of this work, please see paragraphs 4.2 and 5 of our Terms.
© 2019 The Author(s). This work is published and licensed by Dove Medical Press Limited. The
full terms of this license are available at https://www.dovepress.com/terms
and incorporate the Creative Commons Attribution
- Non Commercial (unported, 3.0) License.
By accessing the work you hereby accept the Terms. Non-commercial uses of the work are permitted
without any further permission from Dove Medical Press Limited, provided the work is properly
attributed. For permission for commercial use of this work, please see paragraphs 4.2 and 5 of our Terms.