Back to Journals » International Journal of Nanomedicine » Volume 10 » Special Issue on diverse applications in Nano-Theranostics
Bone dynamics in the upward direction after a maxillary sinus floor elevation procedure: serial segmentation using synchrotron radiation micro-computed tomography
Authors Seo S, Bark CW ![]() , Lim J, Kim Y
, Lim J, Kim Y ![]() , An SSA
, An SSA ![]()
Received 9 May 2015
Accepted for publication 18 July 2015
Published 25 August 2015 Volume 2015:10(Special Issue on diverse applications in Nano-Theranostics) Pages 129—136
DOI https://doi.org/10.2147/IJN.S88282
Checked for plagiarism Yes
Review by Single anonymous peer review
Peer reviewer comments 2
Editor who approved publication: Dr Thomas Webster
Seung-Jun Seo,1,* Chung Wung Bark,2,* Jae-Hong Lim,1 Yong-Gun Kim3
1Industrial Technology Convergence Center, Pohang Accelerator Laboratory, POSTECH, Pohang, Gyeongbuk, 2Department of Electrical Engineering, Gachon University, Seongnam, 3Department of Periodontology, School of Dentistry, Kyungpook National University, Daegu, Republic of Korea
*These authors contributed equally to this work
Objective: Maxillary sinus floor augmentation has been shown to be the most predictable surgical technique for enhancing the bone volume in the posterior area of the maxilla. The purpose of this study was to analyze the serial slice image segmentation of newly formed bone and bone substitutes after sinus floor elevation using synchrotron radiation X-ray micro-computed tomography (SR-µCT).
Materials and methods: Bone biopsy specimens were collected after 6 months of sinus floor augmentation. From the six bone biopsy specimens, the cross-sectional images at every 8 µm along the apical direction from the inferior border using serial segmentation from three-dimensional reconstructed X-ray images were analyzed. The amount of new bone and bone substitutes were measured at each slicing image (300–430 images per specimen).
Results: The bone dynamics between the new bone and bone substitutes along the inferior–superior direction in humans after maxillary sinus floor elevation (MSFE) were analyzed using the whole sample region. Although these observations suggest that the specimens are structurally inhomogeneous, sinus floor elevation was confirmed to be a reliable surgical procedure for increasing the amount of bone.
Conclusion: SR-µCT is highly effective for obtaining high-resolution images. An analysis of biological specimens using SR-µCT is quite reliable and this technique will be an important tool in the wide field of tissue engineering.
Keywords: maxillary sinus floor elevation, synchrotron radiation, micro-computed tomography, serial segmentation, new bone formation
Introduction
Sinus floor elevation for dental implant placement in the posterior maxilla with deficient bone height is a well-known procedure for bone grafting.1–5 Previous studies have reported successful outcomes with bone substitutes (BSs) in sinus floor elevation procedures.2,6 Of the various BSs available, xenogeneic BSs (Bio-Oss®) are used widely and consist of the mineral phase of bovine bone, inorganic and a natural hydroxyapatite-containing ultrastructure.7
The quantitative determination of new bone (NB) is one of the key factors for judging the efficacy of various bone grafting materials for maxillary sinus floor elevation in humans. To observe and estimate the amount of NB after a surgical treatment, hematoxylin–eosin (H&E) photomicrography is one of the most widely used techniques in histology, because the conventional dye-stained photomicrographs are exceptionally good for highlighting biological structures, including bulk tissues and bones. In general, histologic techniques based on cutting and grinding are used to assess the ability of NB formation using BSs. Conventional histomorphometry using H&E photomicrography, which uses samples obtained by a trephine bur, provides the information for bone dynamics along the coronal–apical direction from the longitudinal sectional view along the direction of the sagittal plane. On the other hand, a very limited number of sections are analyzed in conventional histomorphometry due to the complex physical process of slicing the bone samples and the time consuming and high cost of sample preparation.
To avoid those demerits of conventional histomorphometry, nondestructive micro-CT (μCT) has been used in bone analysis in various areas, such as growth and development, and animal models. μCT provides a multiple-angled attenuated X-ray projection to reconstruct a three-dimensional (3D) representation of a specimen, which characterizes the spatial distribution of the material density with a spatial resolution of approximately 1.6 μm.8 In addition, it enables the calculation of 3D measures without the need to assume a geometric model, which ultimately defines the stereology.8 This means that μCT would provide the ability for stereological-based histomorphometry with a precise bone quantity. Although μCT provides many of the above-mentioned merits, it has some limitations for achieving high-resolution images using a desktop X-ray lab source due to polychromatic radiation and the low X-ray flux of X-ray sources. In addition, the wide use of μCT has been limited by the difficulty of volumetric analysis, serial segmentation, and handling of giga-byte data for post-processing. For those reasons, previous research focused on comparing μCT with conventional methods regarding the bone mineral density of iliac crest, vertebrae, femur,9–11 and trabecular pattern in an animal model.
In this study, a synchrotron radiation source was used to provide monochromatic radiation of an extremely high flux, which enables X-ray images to be obtained with high speed and high resolution. To provide the accurate fraction from complex and volumetric samples without limited sampling issues, this study used serial slice image segmentation of a bone biopsy specimen at every 8 μm from the cross-sectional images of 3D reconstructions along the longitudinal direction after MSFE using synchrotron radiation X-ray micro-computed tomography (SR-μCT). The quantitative degree of bone regeneration was analyzed based on the 300–430 virtual slices from the 3D reconstruction images of the six samples. Although conventional desktop μ-CT cannot distinguish the complex shaped tissues with similar densities, such as regenerated bone, SR-μCT visualizes the bone regeneration pattern and spatial organization of the hard tissue structures and is an excellent tool for examining the 3D microarchitecture.
Materials and methods
Patient selection
Partially edentulous patients with at least one posterior upper tooth missing were selected with a residual bone height between 1.5 and 4.5 mm. The exclusion criteria were all systemic and local factors interfering with bone or soft tissue healing. Patients with metabolic disorders, such as osteoporosis or diabetes, or any history of sinus diseases, were also excluded. Informed consent was obtained from all patients.
Sinus floor augmentation for implant placement and biopsy
All patients were treated by the same surgeon using the lateral approach. After flap elevation, an osteotomy on the lateral wall of the maxilla was performed to create a window. The space created between the maxillary alveolar process and the elevated Schneiderian membrane was filled using deproteinized bovine bone (Bio-Oss®, Geistlich Pharma AG, Wolhusen, Switzerland). To avoid infections, the patients received Augmentin® 625 mg, Etodin® 200 mg, and Stilen® 1 T daily over a 7-day period.
After 6 months of uneventful healing, the implant sites were prepared with trephine burs (3.0 mm outer diameter, 2.0 mm inner diameter) to obtain bone cores from the implant sites (vertical biopsies). In each patient, one biopsy was harvested at one of the sites, where a dental implant was to be placed (Table 1). The bone specimens were fixed in 4% neutral-buffered paraformaldehyde and used for the conventional histological, histomorphometric, and SR-μCT investigations. The specimen contained both a grafted area and a residual alveolar process. The residual native bone was included in the histological examination, but not in the histomorphometric and SR-μCT analyses. In the analysis, the interested volume and area were approximately 3 mm (height) ×2 mm (diameter) for SR-μCT and approximately 3 mm (height) ×2 mm (width) for histomorphometric analysis in the grafted area at each of the six samples. The upper part of Figure 2 presents a schematic diagram of the experimental procedure.
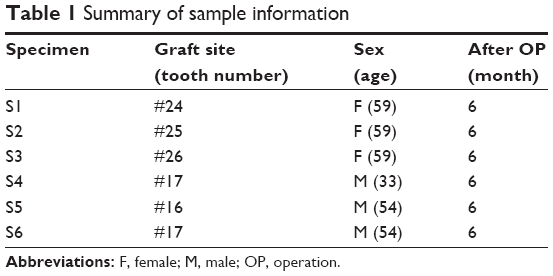 | Table 1 Summary of sample information |
Synchrotron X-ray micro-computed tomography
SR-μCT was performed at the Bio-Medical Imaging Beamline 6C of the Pohang Light Source-II in Pohang, Korea. This beamline provides a monochromatic beam of a relatively large spectral bandwidth (ΔE/E) of approximately 1% using multilayer mirrors. The mirrors were coated with 26 (±0.5) Å thick bilayers of tungsten and boron carbide (Incoatec GmbH, Geesthacht, Germany). The mirror manipulator system, otherwise called the double multilayer monochromator, is capable of tuning the X-ray photon energy between 10 and 55 keV (Vactron Inc., Daegu, Korea). In all, 23 keV was chosen for this experiment and was illuminated on the sample that had been mounted on a stack of precision rotation (ABRS; Aerotech, PA, USA) and linear stages (LYS-9013, Vactron Inc.). The transmitting beam was recorded using a detector system (MICRX030; Optique Peter, Lentilly, France) optically coupling a scintillator screen of 50 μm thick YAG:Ce (Crytur, Turnov, Czech Republic) to a scientific CMOS camera Zyla (Andor, Belfast, UK, 3,900×2,400 pixels). The field of view was 4.0 mm × 3.4 mm, with an effective pixel size of 1.6 μm. The sample-to-detector distance was set to 20 cm. For the tomographic scan, 360 projection images were taken at each 0.5° sample rotation from 0° to 180°. The exposure time per projection was 0.2 second. Figure 1 presents the treatment site and schematic layout of the setup.
 | Figure 1 The procedure of Maxillary sinus floor elevation. |
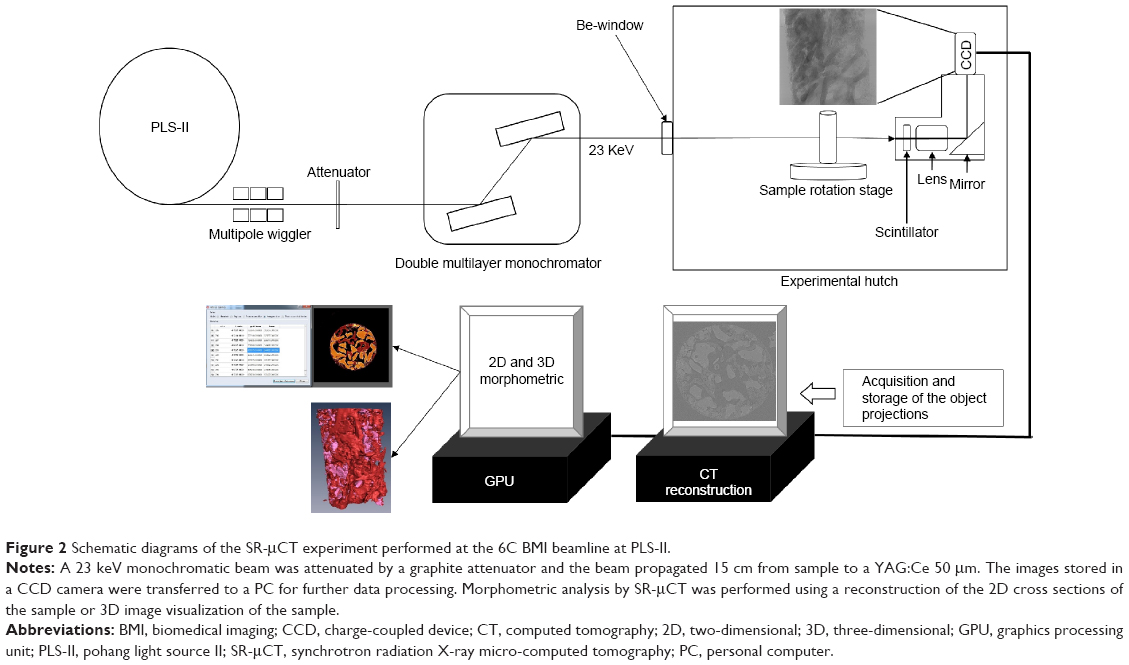 | Figure 2 Schematic diagrams of the SR-μCT experiment performed at the 6C BMI beamline at PLS-II. |
Image processing and segmentation analysis
The quantitative degree of bone regeneration was analyzed based on the virtual slices taken from the serial slice image segmentation every 8 μm from the cross-sectional images of the 3D reconstructions along the longitudinal direction. As a result, 300–430 virtual slices were analyzed. The number of slices depends on the length of the bone samples. The CT slice images were produced using commercial software Octopus (Version 8.4; inCT Co., Aalst, Belgium) which implements an ordinary filtered back projection algorithm. The resulting images are a map of the local X-ray attenuation coefficient plus the enhanced boundaries made by the interference of transmitting coherent X-rays. In the images, the newly formed bone fragments were clearly distinguished from the Bio-Oss® in the gray level. Image analysis software (Amira Version 5.5; FEI Co., Hillsboro, OR, USA) was used for 3D visualization. The slice images were noise filtered and then smoothed using the edge-preserving-smoothing function of the software. Segmentation was carried out based on the difference in the gray level between the Bio-Oss® and the newly formed bone and the volume was calculated by counting the number of voxels belonging to each material. At each slice, the measurements were performed to calculate the percentage (ie, area fraction) of mineralized bone, residual graft material, and soft tissue components.
This study was approved by the Ethics committee of the Kyungpook National University Hospital.
Results
For all patients, perforation of the Schneiderian membrane, which is a frequent complication that often results in incomplete bone regeneration, did not occur. No postoperative complications were encountered after sinus elevation. Normal wound healing was observed after the surgical procedures. The SR-μCT method provides the ratio of the BS and newly generated bone every 8 μm along the longitudinal direction from the serial slice images of the specimens. The pseudo-volume contents were observed from the area contents with a sufficient number of virtual slices of the individual specimens.
From the 3D image sets of SR-μCT, the cross sections that showed close similarity to the photomicrographs could be identified easily. Figure 3A and B shows a 3D visualization image of a bone biopsy specimen acquired by SR-μCT. This was a whole bone specimen containing NB and BSs (Bio-Oss®), newly formed bones were presented with red color, and BSs were present with pink color. The 3D visualization software that can make a cross-sectional view in the arbitrary direction is indispensable, as shown in Figure 3C.
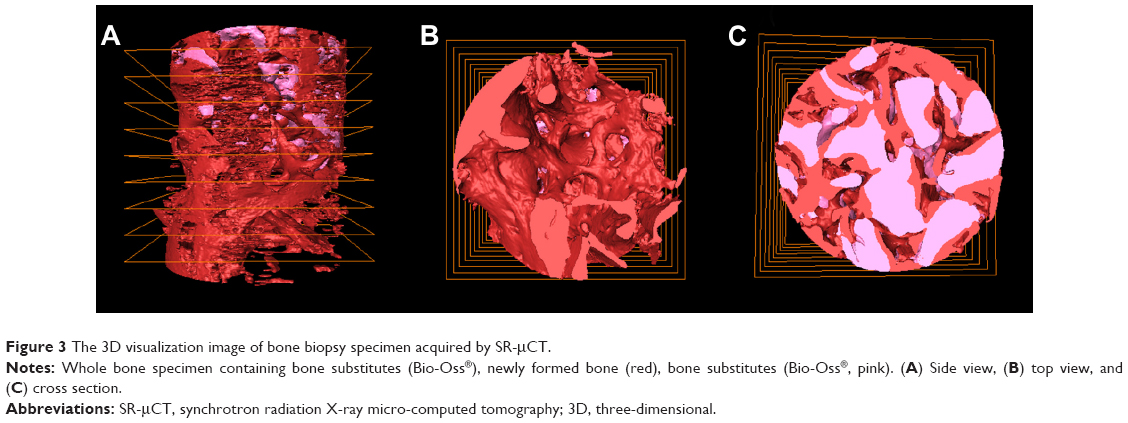 | Figure 3 The 3D visualization image of bone biopsy specimen acquired by SR-μCT. |
Figure 4 presents slice images of the six bone biopsy specimens harvested before implant placement in the graft area. As shown in Figure 4, the BS fractions appear lighter, the NB denser, and the soft tissues are invisible (black region). The slicing images produced differentiated the three major constituents of the grafted volume quite well: NB, BS material of Bio-Oss®, and soft tissues. Field of the Material Statistics module was used to determine the grafted volume statistics for each sample. Once a structure is segmented, the function easily measures its volume and area. This module takes a uniform or stacked label field as well as an optional scalar field as the input and computes some of the statistical quantities for the regions defined in the label field:
|
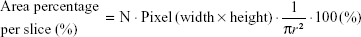
N (NB): number of pixels inside the NB area in a slice;
N (BS): number of pixels inside the BS area in a slice;
r: radius of the sample cross section.
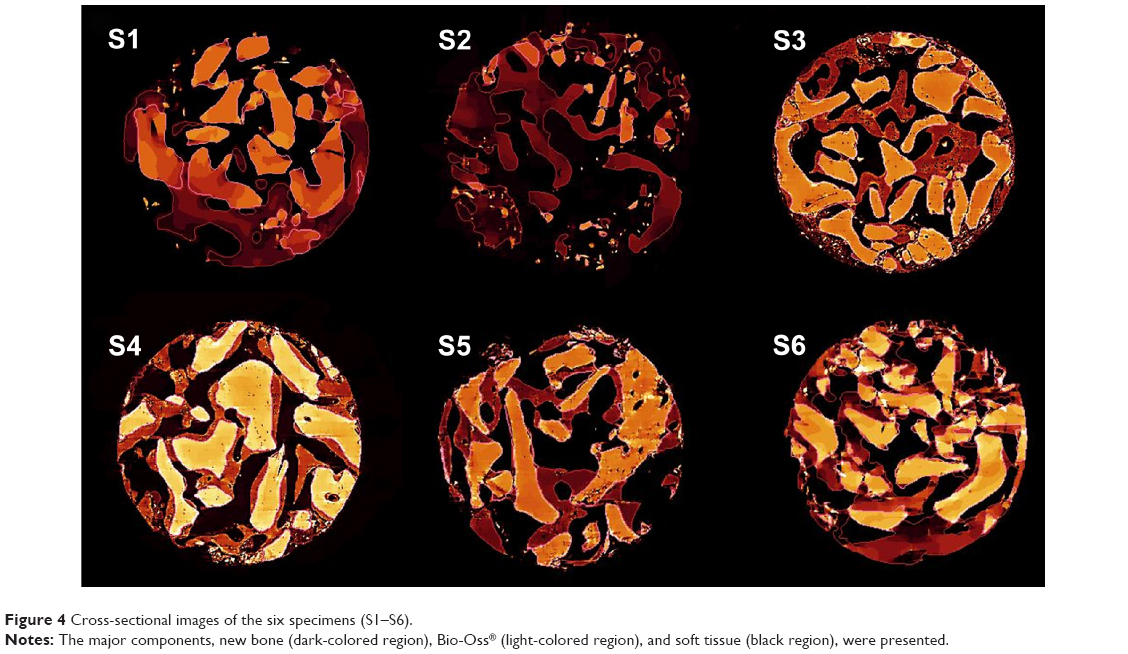 | Figure 4 Cross-sectional images of the six specimens (S1–S6). |
In the mode of volume or area per slice, the slices were stored as results (N) in the spreadsheet. The results were labeled by the materials and the volume of these materials in each slice. The same output was produced by the area per slice mode. In both cases, the voxel size was used to calculate the value. Therefore, the area corresponds to the volume when multiplied by the voxel size.
As shown in Figure 5, the ratio and distribution of NB and BSs were measured every 8 μm from six specimens. The 3D reconstructed images of each specimen are shown in the background of the graph, which was correlated with each sliced position. As a result, the bone dynamics between NB and BSs along the inferior–superior direction in human after MSFE can be analyzed using the whole sample region. One advantage of using SR-μCT is that the information it provides is the full sample region without physical procedures to obtain an H&E photomicrograph. The specimen was analyzed in the cross-sectional position, and the analysis readily extends to the entire volume. This suggests that the specimen is structurally inhomogeneous. The positional variation of the NB and BS fractions clearly indicates that the entire graft is not as homogeneous. Previous CT studies also revealed differences but they were not as large as in the present study.
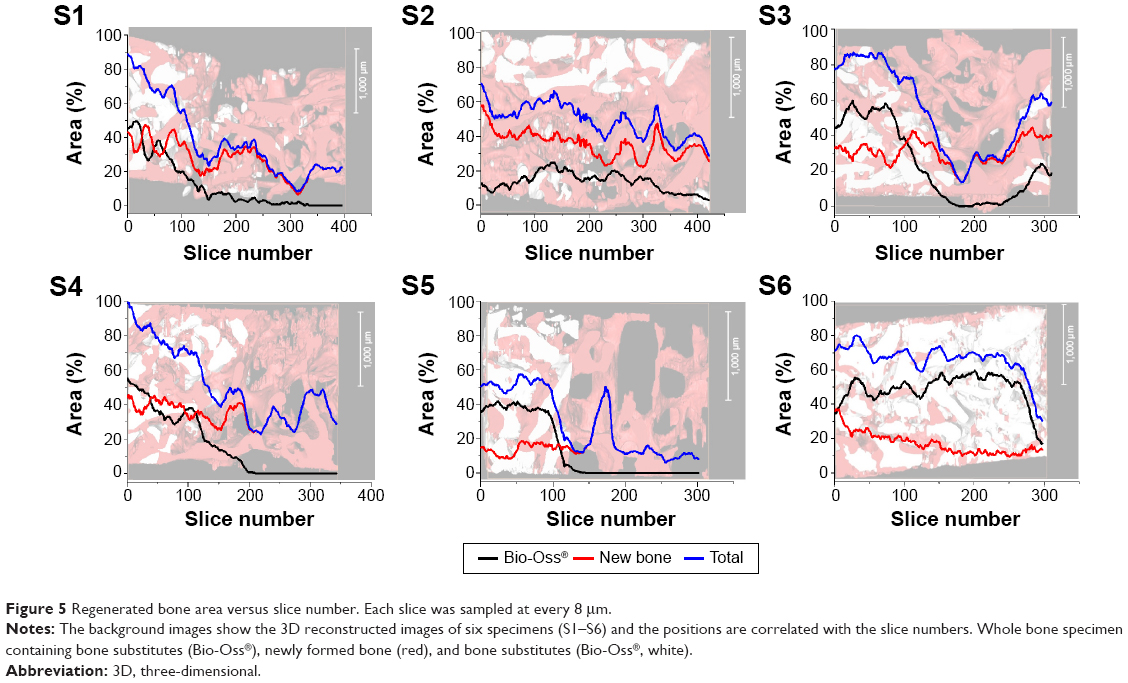 | Figure 5 Regenerated bone area versus slice number. Each slice was sampled at every 8 μm. |
Discussion
This study was a pilot study to analyze the bone dynamics in the sinus upward direction after MSFE. Most previous studies12–16 reported the total evaluation of the bone dynamics with a limited number of conventional histology with various BSs and biomaterials, and the quantitative observation of bone dynamics within the whole volume of specimen is quite limited.
The conventional histology using the H&E photograph is the standard method for examining the interface between the NB and BSs in the field of conductivity and osteoinductivity.17,18 The conventional method provides cellular details and other information on the bone dynamics.18 On the other hand, the results analyzed based on the limited number of two-dimensional sections can be incomplete and misleading due the 3D aspects of the actual tissue sample. Recently, 3D observations of the tissue sample can be possible using μCT.19–21
This paper presented an approach to evaluate human bone biopsy specimens by high-flux SR-μCT. Using SR-μCT, the bone dynamics of human bone were observed directly along the inferior–superior direction after 6 months of MSFE and 6 months after the sinus floor elevation, it was confirmed that bone augmentation in maxillary sinus had been performed successfully. Each specimen had different amounts of Bio-Oss® remaining and different NB:BS ratios after 6 months of MSFE. The entire graft was not as homogeneous, even in the individual specimens. On the other hand, the ratio of NB was much higher in the positions where the BSs had been applied than one in the untreated regions. This suggests that the region with BSs can be changed to the NB region, even though the speed of the transition differs according to the position and status of the patients. From this observation, the MSFE technique is quite reliable for the placement of dental implants in deficient bone areas of the posterior region of the maxilla.
Different bone dynamics between the specimen of the upper and lower parts of sinus floor are expected due to the different environment near the BSs. In other words, the upper part should have less effect from the cell, which builds a bone structure including osteoblasts, than the lower parts. On the other hand, no significant difference was observed between the two parts in terms of the bone dynamics.
These results can have two explanations. First, the observation region was limited to 3 mm along the upper direction, which is not a sufficient length scale to observe the difference between the upper and lower parts. This can be overcome by extending the observation region to 15 mm in the next experimental design. Second, the maturation period, 6 months recovery time, was too long to observe the early behavior of the BSs. To exclude this situation, different maturation periods can be applied to observe the early stages of bone regeneration. In addition, compaction of bone during the process using a trephine bur can occur easily due to differences in the bone density between the sponge bone and the compact bone. This would make it difficult to observe the difference between the upper and lower parts. Therefore, more study will be needed to determine the correlation with the position along the upper direction.
Conclusion
Using synchrotron radiation, quantitative analysis of the bone dynamics of the whole volume of six specimens in human bones was performed 6 months after MSFE. The continuous bone regeneration pattern including the ratio and distribution of NB and BSs were measured every 8 μm from each specimen. In this study, the maxillary sinus floor elevation was confirmed to be a reliable surgical procedure that aims to increase the amount of bone. The use of SR-μCT is quite effective for obtaining high-resolution images due to the phase-contrast effect of synchrotron radiation. High-throughput analysis of maxillary sinus floor elevation can be performed with high accuracy without the 3-week complex sample preparation procedure. An analysis of biological specimens using SR-μCT is quite reliable, and this technique would be a very important tool in the wide field of tissue engineering.
Acknowledgments
This research was supported by Kyungpook National University Research Fund, 2013 (2014). This research was supported by Basic Science Research Program through the National Research Foundation of Korea (NRF) funded by the Ministry of Science, ICT and Future Planning (No 2013005417). This work was supported by the National Research Foundation of Korea (NRF) grant funded by the Korea government (MSIP, 2008-0062282).
Disclosure
The authors report no conflicts of interest in this work.
References
Jensen OT, Sennerby L. Histologic analysis of clinically retrieved titanium microimplants placed in conjunction with maxillary sinus floor augmentation. Int J Oral Maxillofac Implants. 1998;13:513–521. | ||
Del Fabbro M, Testori T, Francetti L, et al. Systematic review of survival rates for implants placed in the grafted maxillary sinus. Int J Periodont Restorat Dent. 2004;24:565–577. | ||
Wallace SS, Froum SJ. Effect of maxillary sinus augmentation on the survival of endosseous dental implants. A systematic review. Ann Periodontol/Am Acad Periodontol. 2003;8:328–343. | ||
Froum SJ, Wallace SS, Cho SC, et al. Histomorphometric comparison of a biphasic bone ceramic to anorganic bovine bone for sinus augmentation: 6- to 8-month postsurgical assessment of vital bone formation. A pilot study. Int J Periodont Restorat Dent. 2008;28:273–281. | ||
Froum SJ, Wallace SS, Elian N, et al. Comparison of mineralized cancellous bone allograft (Puros) and anorganic bovine bone matrix (Bio-Oss) for sinus augmentation: histomorphometry at 26 to 32 weeks after grafting. Int J Periodont Restorat Dent. 2006;26:543–551. | ||
Chiapasco M, Casentini P, Zaniboni M. Bone augmentation procedures in implant dentistry. Int J Oral Maxillofac Implants. 2009;24(Suppl):237–259. | ||
Tadic D, Epple M. A thorough physicochemical characterisation of 14 calcium phosphate-based bone substitution materials in comparison to natural bone. Biomaterials. 2004;25:987–994. | ||
Charwat-Pessler J, Musso M, Entacher K, et al. Improving CT image analysis of augmented bone with Raman spectroscopy. J Appl Math. 2013;2013:10. | ||
Engelke K, Graeff W, Meiss L, et al. High spatial resolution imaging of bone mineral using computed microtomography. Comparison with microradiography and undecalcified histologic sections. Invest Radiol. 1993;28:341–349. | ||
Muller R, Koller B, Hildebrand T, et al. Resolution dependency of microstructural properties of cancellous bone based on three-dimensional mu-tomography. Technol Health Care Offic J Eur Soc Eng Med. 1996;4:113–119. | ||
Uchiyama T, Tanizawa T, Muramatsu H, et al. A morphometric comparison of trabecular structure of human ilium between microcomputed tomography and conventional histomorphometry. Calcified Tissue Int. 1997;61:493–498. | ||
Lee YM, Shin SY, Kim JY, et al. Bone reaction to bovine hydroxyapatite for maxillary sinus floor augmentation: histologic results in humans. Int J Periodont Restorat Dent. 2006;26:471–481. | ||
Tan WC, Lang NP, Zwahlen M, et al. A systematic review of the success of sinus floor elevation and survival of implants inserted in combination with sinus floor elevation. Part II: transalveolar technique. J Clin Periodontol. 2008;35:241–254. | ||
Browaeys H, Bouvry P, De Bruyn H. A literature review on biomaterials in sinus augmentation procedures. Clin Implant Dent Relat Res. 2007;9:166–177. | ||
Yildirim M, Spiekermann H, Biesterfeld S, et al. Maxillary sinus augmentation using xenogenic bone substitute material Bio-Oss in combination with venous blood. A histologic and histomorphometric study in humans. Clin Oral Implants Res. 2000;11:217–229. | ||
John HD, Wenz B. Histomorphometric analysis of natural bone mineral for maxillary sinus augmentation. Int J Oral Maxillofac Implants. 2004;19:199–207. | ||
Zerbino DD. [Biopsy: its history, current and future outlook]. Lik Sprava. 1994:1–9. | ||
Avwioro OG. Histochemistry and Tissue Pathology, Principles and Techniques. Nigeria: Claverianum Press; 2010. | ||
Ruegsegger P, Koller B, Muller R. A microtomographic system for the nondestructive evaluation of bone architecture. Calcified Tissue Int. 1996;58:24–29. | ||
Ritman EL. Micro-computed tomography-current status and developments. Annu Rev Biomed Eng. 2004;6:185–208. | ||
Ruhli FJ, Kuhn G, Evison R, et al. Diagnostic value of micro-CT in comparison with histology in the qualitative assessment of historical human skull bone pathologies. Am J Phys Anthropol. 2007;133:1099–1111. |
 © 2015 The Author(s). This work is published and licensed by Dove Medical Press Limited. The
full terms of this license are available at https://www.dovepress.com/terms
and incorporate the Creative Commons Attribution
- Non Commercial (unported, 3.0) License.
By accessing the work you hereby accept the Terms. Non-commercial uses of the work are permitted
without any further permission from Dove Medical Press Limited, provided the work is properly
attributed. For permission for commercial use of this work, please see paragraphs 4.2 and 5 of our Terms.
© 2015 The Author(s). This work is published and licensed by Dove Medical Press Limited. The
full terms of this license are available at https://www.dovepress.com/terms
and incorporate the Creative Commons Attribution
- Non Commercial (unported, 3.0) License.
By accessing the work you hereby accept the Terms. Non-commercial uses of the work are permitted
without any further permission from Dove Medical Press Limited, provided the work is properly
attributed. For permission for commercial use of this work, please see paragraphs 4.2 and 5 of our Terms.