Back to Journals » Risk Management and Healthcare Policy » Volume 14
Biomedical Solid Waste Management System in Jimma Medical Center, Jimma Town, South Western Ethiopia
Authors Lemma H ![]() , Dadi D, Deti M
, Dadi D, Deti M ![]() , Fekadu S
, Fekadu S
Received 12 April 2021
Accepted for publication 27 August 2021
Published 27 September 2021 Volume 2021:14 Pages 4037—4049
DOI https://doi.org/10.2147/RMHP.S315446
Checked for plagiarism Yes
Review by Single anonymous peer review
Peer reviewer comments 2
Editor who approved publication: Dr Jongwha Chang
Hailu Lemma,1 Dessalegn Dadi,2 Mulunesh Deti,2 Samuel Fekadu2
1Department of Environmental Health Science, Institute of Health, Bule Hora University, Bule Hora, Ethiopia; 2Department of Environmental Health Science & Technology, Institute of Health Science, Jimma University, Jimma, Ethiopia
Correspondence: Hailu Lemma
Department of Environmental Health Science, Institute of Health, Bule Hora University, P.O Box 144, Bule Hora, Ethiopia
Tel +251 910 720 867
Fax +251 464 430 355
Email [email protected]
Introduction: Biomedical waste is a hazardous waste material that is generated during the diagnosis, treatment, or immunization of human beings. Hence, it needs special attention and appropriate management before disposal.
Objective: This study aimed to assess the biomedical solid waste management system in Jimma Medical Center, Jimma town, southwestern Ethiopia, 2020.
Methods: An institution-based cross-sectional study design was used to assess the biomedical solid waste management system from May 12 to 25, 2020. The quantity of biomedical solid waste generated was measured by using a calibrated weight balance. An observational checklist and a semi-structured interview guide were used to assess the current practice of biomedical solid waste management. In addition, during combustion, the concentration of pollutants emitted from the incinerator was measured at a different distance from the source. Analysis of variance was used to compare the mean waste generation rates among wards and the contribution of incinerator emissions at different distances was analyzed by regression.
Result: The average daily biomedical waste generation rate was determined to be 0.92kg/bed/day and/or 0.75kg/patient/day. There was limited segregation of biomedical waste by type at the point of generation. Mixed biomedical waste was collected and transported using substandard open plastic bins. Moreover, the incinerator was operated at a low temperature and high peak average concentrations of PM2.5 (21.7– 999.9 μg/m3) and PM10 (31– 1999.9 μg/m3), total VOC (736– 4754mg/m3), NO2 (0.00– 600 μg/m3) and SO2 (0.00– 300 μg/m3) were recorded at different distances downwind from the incinerator.
Conclusion: The average biomedical waste generation rate was above the threshold value set by the World Health Organization in low-income countries. Its management was also limited. The high concentrations of pollutants released from the incinerator affect the nearby air quality and hence interferes with the health of the local community.
Keywords: biomedical waste, generation rate, management system, incinerator emission
A Letter to the Editor has been published for this article.
Introduction
The global healthcare system has expanded tremendously in many developed and developing countries in the past few decades. This enables the provision of healthcare to more people, covering wide geographical areas.1 Unfortunately, these advance in healthcare activities can result in the generation of an ever-growing amount of waste that is not being treated properly.2
Every year an estimated 16 billion injections are administered worldwide, but not all of the needles and syringes are properly disposed of afterwards, creating a risk of injury and infection and opportunities for reuse.3 In 2010, the World Health Organization (WHO) estimated that injections with contaminated needles and syringes were still responsible for about 33,800 HIV infections, 1.7 million hepatitis B viral infections and 315,000 hepatitis C viral infections in low-income countries.4
Regardless of its impact on the environment and public health in general, proper handling and management of medical waste are still substantially undermined in many developing countries.5 A new Joint Monitoring Program of WHO/UNICEF report in 2019 revealed that there is very limited safe management of healthcare waste in developing countries; only 27% of healthcare facilities had basic waste management services.6 In Ethiopia, as in many developing countries, medical waste production is rising sharply in recent years due to rapid population growth, which increases the amount of biomedical waste generated in the country.7
However, waste management across health institutions is still inadequate and has received less attention.8 The nature and quantity of waste generated as well as institutional practices with regards to the sustainable management of biomedical waste are not examined yet in the study setting. Furthermore, all health facilities have chosen incineration to treat healthcare waste (HCW).9,10 However, a survey conducted on the status of hospital incinerators, found widespread deficiencies in their construction, siting and operation; most of the healthcare facilities (HCFs) (80%) use low-temperature technology that generates air pollution.11
Thus, to minimize and control the risks associated with improper management of biomedical waste, it is imperative to plan and develop an evidence-based intervention strategy.12 However, the quantity of biomedical solid waste generated as well as the existing waste management system practiced in Jimma Medical Center had not yet been examined. Therefore, this study aimed at filling this gap by providing information on biomedical solid waste generation rates, current management practices as well as the concentration of pollutants emitted from the incinerator.
Methods and Materials
Study Area and Period
The study was conducted in departments of Jimma Medical Center (JMC), Jimma town, southwestern Ethiopia from May 12 to 25, 2020. JMC, which was built to serve as a research and teaching center, was also providing medical services for the community. It is located approximately 356 km southwest of Addis Ababa, the capital of Ethiopia. It has an average altitude of 1760 m above sea level, its temperature ranges from a maximum of 25–30 °C and a minimum of 7–20°C and its annual rainfall ranges from 1200–2000 mm.13
Study Design
An institution-based cross-sectional study design was used to assess the biomedical solid waste management system in Jimma Medical Center.
Data Collection Tool and Procedure
First, a walk-through inspection of all wards and/or departments of the medical center was conducted by the investigators to identify the different types of waste generated. To determine biomedical solid waste generation rates, plastic bags of different colors that meet national guidelines were distributed to different wards/departments of the medical center, according to the type of waste generated. The waste characterization was done following the National Healthcare Waste Management Guideline in 2008.14 The buckets and plastic bags were labeled to indicate the different categories of biomedical waste, the place of generation, date, and time of collection. Then the quantity of biomedical solid waste generated was measured by collecting and weighting waste generated from all wards using a calibrated weight balance for seven consecutive days.15
The existing biomedical solid waste management system practiced in Jimma Medical Center was investigated using semi-structured key informant interviews of the waste management committee of the medical center and an observational checklist adapted from the Ethiopian Food Medicine and Healthcare Administration and Control Authority (FMHACA) inspection checklist for HCW management in HCFs.16 The key informant interview was held for the waste management committee of the medical center.5
In addition, during combustion of biomedical waste the concentration of gaseous emissions from the incinerator (total VOCs, NO2, SO2 and CO) and the suspended particulate matter (SPM) with a diameter of 10 and 2.5 µm (PM10 and PM2.5) were measured at different distances (at incinerator site, 50 meters, 100 meters, and 200 meters) downwind from the incinerator, within a maximum 1-km radius.17 In addition, the upwind site from the incinerator was selected and measured to represent the background concentration.18
The concentration of the gaseous emissions from the incinerator was directly measured by a handheld Aeroqual Gas Sensor model S-500L (Aeroqual Ltd, New Zealand), a real-time sampler with attached temperature and relative humidity sensor and interchangeable electrochemical gas sensor head. The concentration of suspended particulate matter (PM2.5 and PM10) was measured by another sensor-based device called a laser particulate meter (Zhuhai Jida Huapu Instrument Co. Ltd, China), model number HP-5800D. The samples were collected at different phases of incinerator operation: at startup, during continuous burning and at hours of burn down.19
Data related to meteorological parameters such as wind speed, wind direction, temperature, and relative humidity were also measured at each sample site. The wind speed was measured by cup anemometer, and wind direction was estimated using a compass and visual observation of the direction in which visible exhaust smoke from the stack of incinerator travelled. The wind was generally blowing from a southeasterly to a northwestern direction for the duration of the measurements. The distance of sample locations was obtained with a handheld geographic positioning system (GPS).
Study Variables
Dependent Variables
- The biomedical solid waste generation rate,
- Existing biomedical solid waste management system,
- The concentration of different gaseous and suspended particulate matter.
Independent Variables
- Type of wards/departments,
- Number of patients (both inpatient and outpatient),
- Distance from incinerator,
- Meteorological parameters:
- Wind speed and direction,
- Temperature and relative humidity.
Data Analysis
The raw quantitative data collected from the field was coded and entered into Epi-Data version 3.1. After the screening and correction of the data entry errors, the data was exported to SPSS version 25 for analysis. The analysis of biomedical solid waste generation rates among wards was computed by one-way ANOVA. The mean concentrations of air quality parameters were computed, and two-way ANOVA was employed to test significant variation in concentrations of pollutants among sample sites. The paired sample t-test was also used to compare significant differences in concentrations of emissions from the incinerator at different downwind sites relative to upwind background concentrations. Moreover, regression analysis was conducted to evaluate the contribution of incinerator emissions on selected air quality parameters at different distances downwind from the incinerator. Furthermore, the Pearson correlation coefficient was used to test the correlations of concentration of air pollutants with meteorological parameters and the daily total amount of biomedical solid waste generated with the patient flow.
Qualitative data from key informant interviews and observation was analyzed by theme. Thematic analysis of the data was conducted manually, by sorting and organizing information according to its thematic similarities and differences. Then, the information was categorized and studied to understand the relationships between it and/or within the overall context of the study.
Data Quality Assurance
To assure data quality, training was given to data collectors before collection, and the weighing scale was calibrated before the actual measurements started. Daily on-site supervision was made by the supervisor during the actual measurements. Key informant interview questionnaires and observation checklists were pretested with a pilot survey of a similar study population at Shenen Gibe general hospital before the actual data collection period to ensure the trustworthiness of the data collection tool. The air sampling instruments were calibrated before use according to the manufacturer’s instructions. At each location, the digitally displayed values of each parameter were recorded when the equipment reading became stabilized. Additionally, the measurement of the selected parameters was taken in triplicate.
Ethical Consideration
Ethical approval and clearance was obtained from the ethical review committee of Jimma University, Institute of Health and Faculty of Public Health. A formal letter was given to Jimma Medical Center administration office and a letter of permission for data collection was obtained from the JMC administration office. The purpose of the study was explained to respondents. The respondents were also assured that data was and would remain confidential. During data collection, each respondent was informed about the purpose, scope, and expected outcome of the research and appropriate verbal and written consent was obtained.
Dissemination Plan of Study Findings
After the analysis and interpretation of the data, the necessary information was disseminated to concerned bodies, the research and publication office, Jimma Medical Center, and Jimma University.
Results
Patient Flow in Jimma Medical Center
During data collection, a total of 3809 patients visited all wards and outpatient departments of the medical center within a week, of which 3103 (81.46%) were admitted to the inpatient department and the remaining 706 (18.5%) were seen in the outpatient department. The total average daily patient flows in the medical center, inpatients and outpatients only, were 544.14±76.67, 443.28±26.92, and 100.8±50.95, respectively.
Biomedical Solid Waste Generation Rate
The total biomedical solid waste generated in Jimma Medical Center within seven consecutive days was 2872kg/week. The average biomedical solid waste generation rate determined in kg/day, kg/patient/day (sum of occupied bed and outpatient attendants) and kg/bed/day (occupied beds) was 410.29±78.46kg/day, 0.75kg/patient/day and 0.92kg/bed/day, respectively. The daily distribution of total biomedical solid waste generation was higher on weekdays and lower on weekends (Figure 1).
 |
Figure 1 The daily distribution of the total amount of biomedical solid waste generated in Jimma Medical Center, Jimma zone, south western Ethiopia, May 2020. |
Biomedical Solid Waste Generation Rate in Different Wards
The daily average biomedical waste generated in all wards/departments of Jimma Medical Center was 410.29±78.46kg/day. A great amount of biomedical waste was generated from the OPD ward (69.43±16.89kg/day (16.92%)), whereas fewer amounts of biomedical waste were generated from the ophthalmology ward (0.86±1.57kg/day (0.21%)). There was a statistically significant variation in the average biomedical waste generation rate in different wards (F = 39.087, p = 0.000) (Table 1).
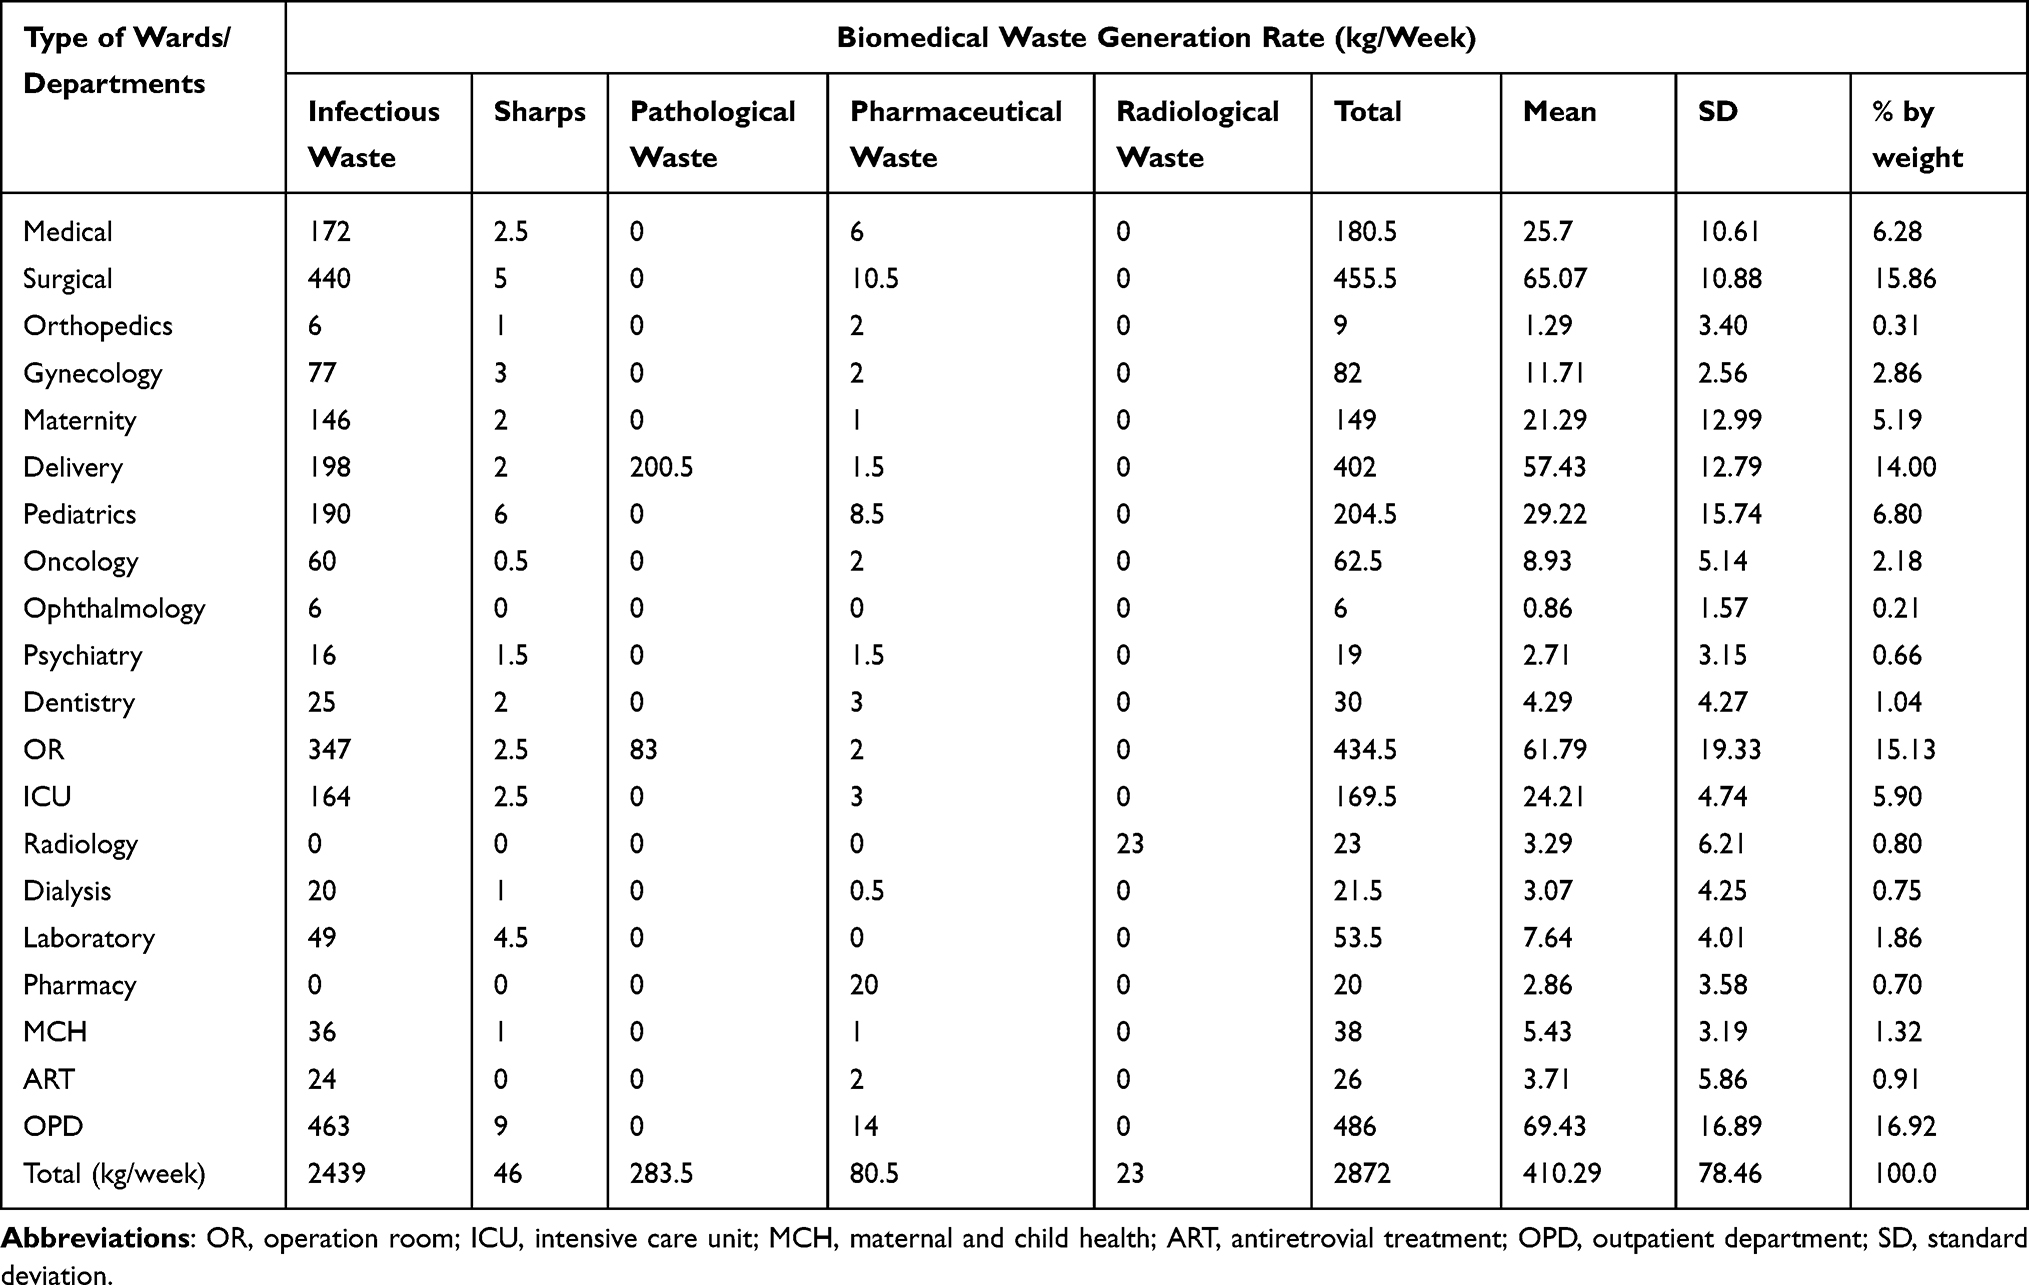 |
Table 1 Total Biomedical Solid Waste Generated in Different Wards by Type of Waste Within 7 Days of Data Collection Time in Jimma Medical Center, Jimma, Southwestern Ethiopia, 2020 |
Biomedical Solid Waste Generation Rate by Type of Waste
Biomedical waste generated in Jimma Medical Center consisted of: infectious waste, sharps, pathological waste, pharmaceuticals, and radiological waste (Table 1). The majority of these were infectious (348.4±20.26kg/day (84.93%)) and pathological waste (40.5±6.64kg/day (9.87%), and the rest were pharmaceutical (11.5±1.64kg/day (2.8%)), sharps (6.57±0.31kg/day (1.6%), and radiological waste (3.29±0.71kg/day (0.8%)).
Comparison of Daily Biomedical Solid Waste Generation Rate and Patient Flow
The Pearson correlation coefficient (r) was used for testing the existence of any bivariate correlation between the daily total amount of biomedical solid waste generated and the total number of patients who visited the medical center on a daily basis. Accordingly, there was a strong positive correlation between the amount of biomedical solid waste generated and total patient flow (r = 0.88, p = 0.009).
Biomedical Solid Waste Management System
Segregation of Biomedical Solid Waste
In Jimma Medical Center, there was limited segregation of biomedical waste into infectious, pharmaceutical, radiological waste by use of waste containers with a standard color coding and labeling at the point of generation. It was observed that different categories of biomedical waste were deposited together in perforated plastic baskets (Figure 2A–C). The sharps and placentas were kept separately in red plastic buckets, but the bucket used for sharps was misplaced at the side of the doors at the entrance and exit gates used by patients and visitors (Figure 2D).
 |
Figure 2 The photographs show biomedical waste segregation practices at the point of generation (A–C) and the placement of a bucket in which sharp materials are deposited (D) in Jimma Medical Center, May 2020. |
Collection, Storage, and Transportation of Biomedical Solid Waste
Jimma Medical Center has no proper and purpose-built waste storage area. It was observed that mixed biomedical waste was collected from all wards (Figure 3A) and transported to incineration facilities using open plastic bins twice daily (Figure 3B). In addition, it was observed that healthcare waste handlers were using a cracked plastic bin to transport waste and waste was leaking on the road to the treatment facility (Figure 3C and D).
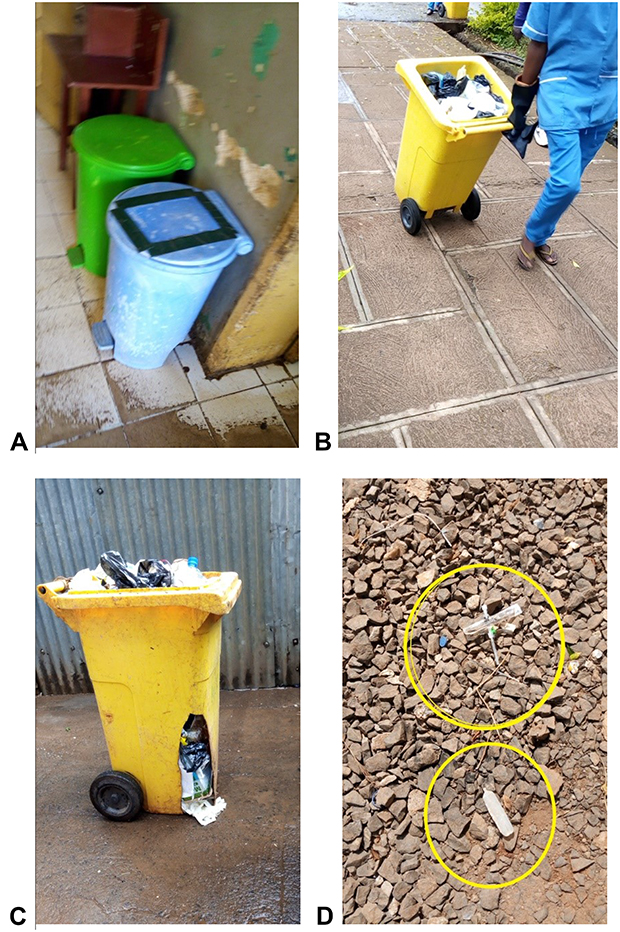 |
Figure 3 The photographs show biomedical waste collection (A), transportation by open plastic bin (B), cracked bin (C) and scattered waste on the road (D) in Jimma Medical Center, May, 2020. |
Treatment and Disposal Practice
The most common biomedical waste treatment method used in Jimma Medical Center was a high-temperature double-chamber incinerator (Figure 4A). However, the incinerator was operated at low temperatures (at about 203OC in the primary chamber and 458OC in the secondary chamber) (Figure 4B) and dense smoke emission was observed from its chimney (Figure 4C). Some systems, such as the door opening/closing crane and burner button, were also not functioning automatically and, instead, were operated manually. There was a fugitive emission observed at the waste inlet site (Figure 4D). The pathological waste was buried in the placenta pit, which has an unsecured cover (Figure 4E). Furthermore, the medical center was also practicing burning in the old brick incinerator and open dumping (Figure 4F).
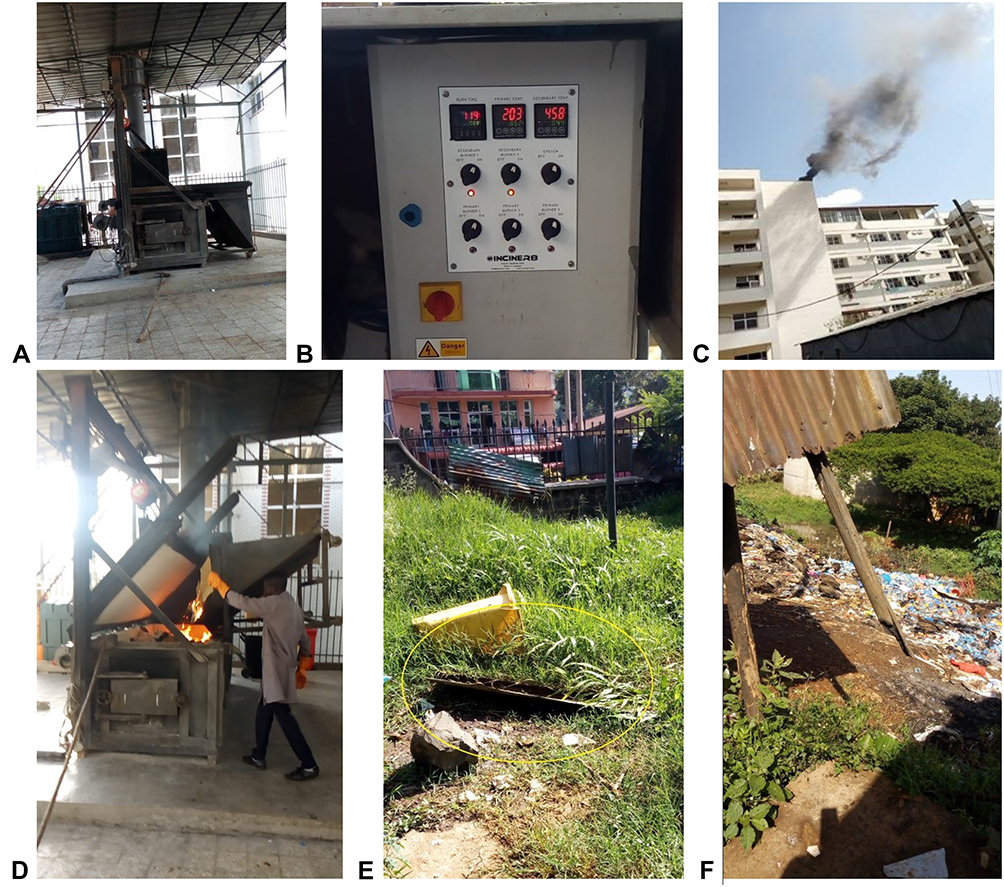 |
Figure 4 The photographs show the incinerator site (A), temperature display board (B), dense smoke emission from the chimney of the incinerator (C), fugitive emission and manual waste firing (D), placenta pit (E) and open dumping (F) in Jimma Medical Center, May, 2020. |
Waste Management Guideline, Instructions, and Minimization Practices
The Ethiopian Federal Ministry of Health prepared the National Healthcare Waste Management Guideline in 2008. But Jimma Medical Center does not use this guideline; it has its own written instructions to implement waste segregation. The waste minimization practices were almost absent in the medical center.
Training and Safety Devices
The medical center had organized training related to infection prevention and biomedical waste management for waste handlers, environmental health professionals, and heads of departments on a yearly basis. There was no regular training given for all staff and waste handlers.
Moreover, it was observed that in some instances waste handlers were using disposable and surgical gloves for handling biomedical waste because of the unavailability of appropriate gloves. In addition, some of the waste handlers were not wearing gloves while handling waste. The incinerator operators do not have all necessary personal protective equipment (i.e., face mask, eye goggles, safety shoe, etc.).
Concentration of Suspended Particulate Matter and Gaseous Pollutants
The high peak average concentrations of PM2.5 (999.9μg/m3) and PM10 (1999.9μg/m3), were recorded at the stack of the incinerator and waste inlet site, while high peak average concentrations of gaseous pollutants, total VOC (4754mg/m3), NO2 (600μg/m3) and SO2 (300μg/m3), were recorded at the stack of the incinerator and the least values, PM2.5 (27μg/m3), PM10 (31.6μg/m3), NO2(0.00μg/m3), SO2 (0.00μg/m3), were measured at the upwind site and the least values of total VOC (736mg/m3) were measured at a downwind site 200m away. The CO emission was not detected at all sites of gas measurement (Table 2). There were significant variations in the concentrations of suspended particulate matter and gaseous measures among the sample sites (F = 282.446; p = 0.000).
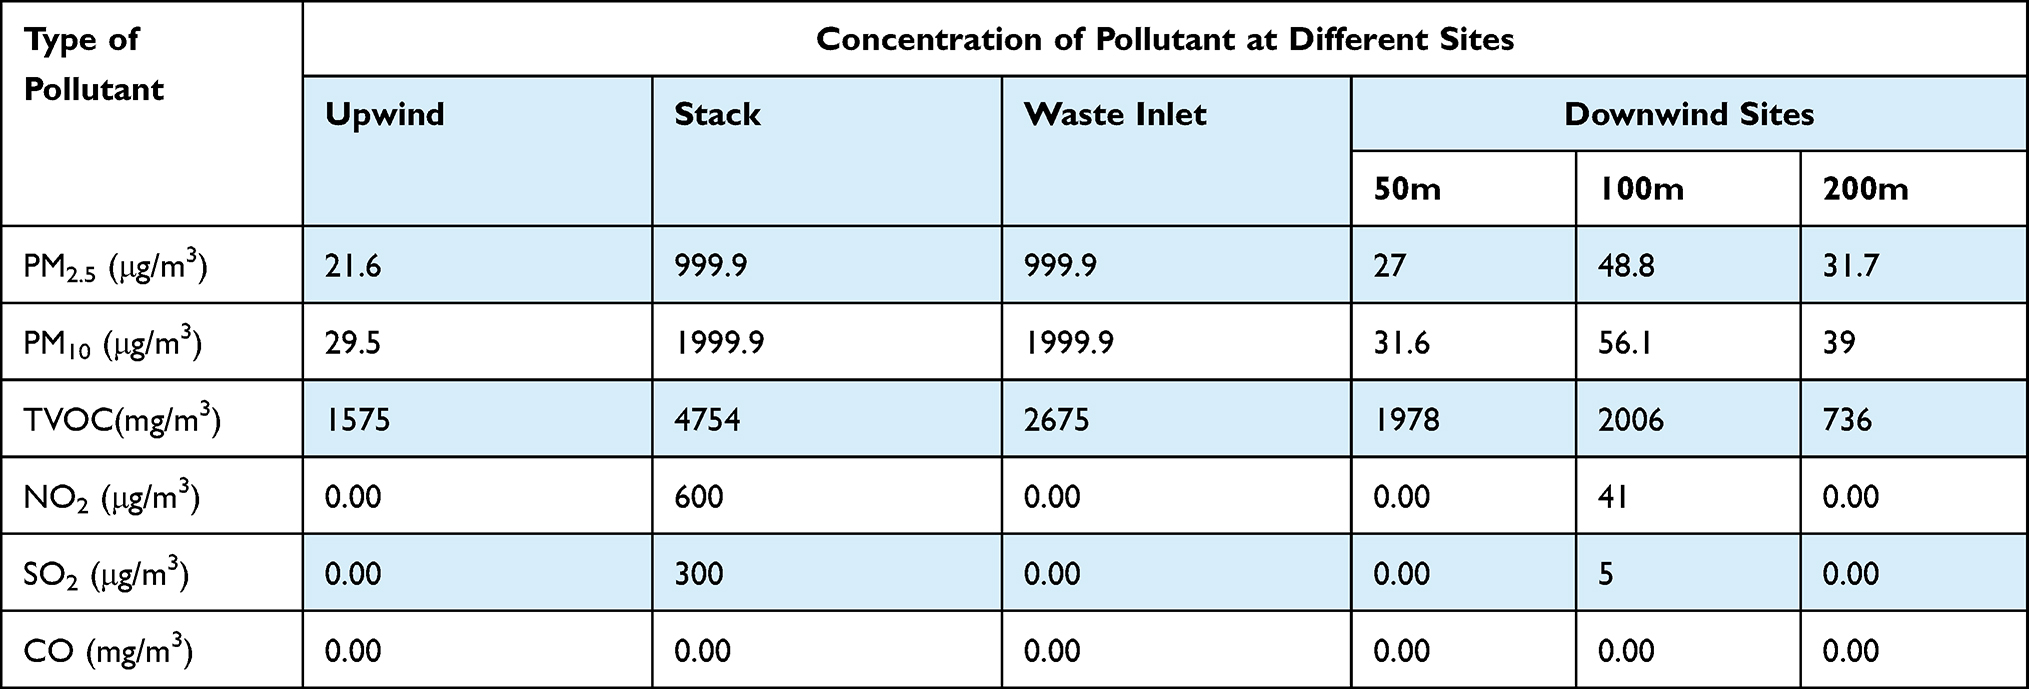 |
Table 2 Concentration of Incinerator-related Emission at Different Sites from the Incinerator of Jimma Medical Center, May 2020 |
Concentration of Pollutants at Upwind and Downwind Sites
The peak average concentration of suspended particulate matter and gaseous pollutants emitted from the incinerator measured at the stack, waste inlet site, 100 and 200m distance downwind to the incinerator were significantly higher than the upwind background concentration (t = −3.896, p = 0.001; t = −4.747, p= 0.00; t = 2.217, p = 0.013 and t = −2.779, p = 0.048), respectively. On the contrary, there was no observed statistically significant variation in concentration of pollutant measured at a 50m distance downwind site relative to the upwind background concentration (t = −2.075, p = 0.053) (Table 2).
Concentration of Pollutant Emitted from the Incinerator at Different Distance Downwind Site
As shown in Figure 5, the peak average concentrations of all pollutants emitted from the incinerator were highest at incinerator site (0m) and gradually declined across distance downwind to the incinerator, and least values were measured at 200m distance downwind from the incinerator. The concentration of each pollutant was background subtracted using values from the corresponding sample collected at the upwind site. It was found that the concentrations of all pollutants were negatively correlated with distance downwind from the incinerator (R = −0.69 to −0.87; p≤0.004). Relatively, total VOC and PM10 had the highest negative correlation with distance downwind from the incinerator (R = −0.87 and R = −0.86), followed by PM2.5(R = −0.85), SO2 (0.70), and NO2 (R = −0.69).
 |
Figure 5 The mean concentrations of emissions at different distances downwind to the incinerator, Jimma Medical Center, May 2020. |
As shown in Table 3, the distance between the incinerator and downwind sites explained between 48–76% (R2 = 0.48–0.76) of the observed variations in the concentrations of different incinerator emissions. Total VOC and PM10 had the highest determination coefficients (R2 = 0.76 and 0.75), while the relatively lowest were found in PM2.5 (0.74), NO2 (R2 = 0.48) and SO2 (0.49).
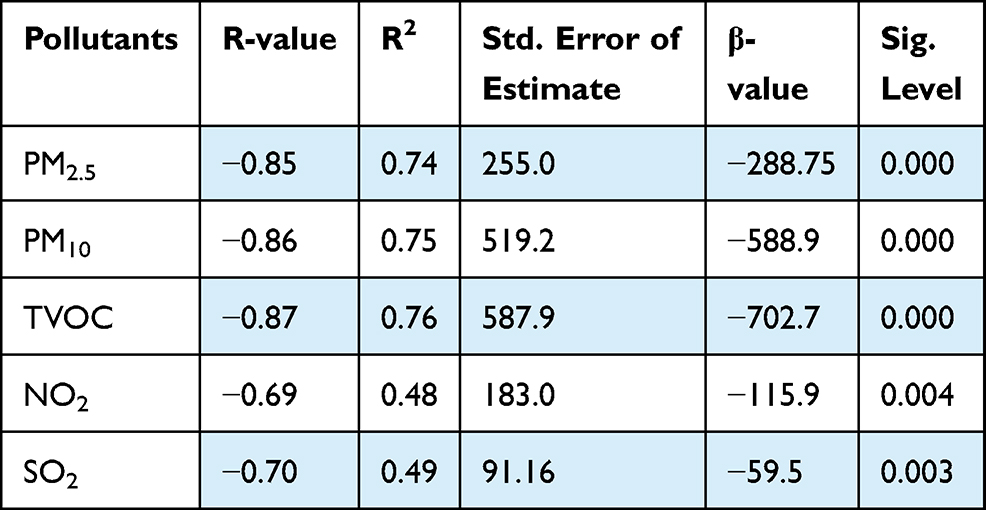 |
Table 3 Correlation and Determination Coefficients of Regressing Pollutant Levels on Distance |
Correlation of the Meteorological Parameters and Concentration of Pollutants
The temperatures recorded in the sample sites were minimum 24 OC to maximum 26 OC and mean values were 25.16±0.7 OC. The correlation analyses performed indicate that the differences in temperature measurements at different sample sites had a significant negative correlation with variation in concentrations of PM2.5 (R = −0.62), PM10 (R = −0.67), total VOC (R = −0.63), NO2 (R = −0.73) and SO2 (R= −0.76) (p<0.05).
In addition, the amount of relative humidity recorded in the study area was minimum 64% to maximum 67%, with mean values of 65.5±0.94%. The variations in relative humidity among the sample sites were negatively correlated with the variation in concentration of all air quality parameters: PM2.5 (R = −0.75), PM10 (R = −0.74), total VOC (R = −0.90), NO2 (R = −0.72) and SO2 (R = −0.73) at different sample sites. The wind speed measured at all sites was very low and variations ranged from 0.07m/s to 0.09m/s, with mean values of 0.0813±0.006m/s (calm wind speed <1m/s). From these results, it could be deduced that wind speed was relatively constant and there was no significant variation across locations (p>0.05) in the recorded wind speed values.
Discussion
The average biomedical solid waste generation rate in Jimma Medical Center was determined to be 0.92kg/bed/day and 0.75kg/patient/day. The result of this study was lower when compared with a study conducted in the USA (2.79 kg/bed/day,) as mentioned in a WHO report,5 and the study conducted in Bahrain (1.177kg/patient/day).20 The higher biomedical waste (BMW) generation rate in developed countries may be due to the higher per capita gross domestic product (GDP), that is, the developed nations’ lifestyles need a large supply of healthcare services, which tends to generate a higher amount of waste in HCFs.21 But our results was higher when compared with the study conducted in public healthcare facilities in Bujumbura, Burundi (0.22kg/patient/day),22 another study conducted at the municipal hospital of Ghana (0.39kg/patient/day),23 and the local study conducted in Mizan Tepi University Specialized Hospital (0.073kg/bed/day)12 and the Gondar teaching hospital (0.37kg/patient/day).9 The variations in average waste generation rates could be speculated to result from the differences in size and levels of healthcare facilities, types of service offered and, on a country to country basis, on the level of economic development.
Moreover, according to WHO, developed countries generate on average up to 0.5kg of hazardous health care waste per hospital bed per day, while low-income countries generate on average 0.2kg of hazardous health care waste per hospital bed per day.3 However, the results from this study identified about 0.92kg/bed/day of total biomedical (hazardous) wastes generated from Jimma Medical Center, which was not congruent with the stated WHO value. The major reason for the high percentage of hazardous waste generation may be due to the limited waste segregation system practiced in the medical center, which possibly may increase the biomedical waste generation rate.
The results of this study confirmed that there was limited segregation of biomedical waste into different categories using color-coded containers and labels. This finding is inconsistent with a study conducted in different hospitals in the USA, which reported that most of the hospitals are segregating infectious waste from other medical waste.24 But similar non-compliance was reported by different national studies conducted in hospitals in Addis Ababa,25 the Referral Hospital of Hawassa University,26 and Mizan Tepi University Teaching Hospital.12 These indicated that the implementation of biomedical waste segregation is a challenge in different healthcare facilities in Ethiopia.
The medical center has no temporary waste storage area and it was observed that mixed waste was collected and transported in open and substandard (cracked) plastic bins to the incinerator facility. This finding is similar to the study conducted in public healthcare facilities in the city of Adama,27 which reported that open or unprotected devices were used for on-site transportation of healthcare waste; another study conducted in HCFs of Amhara region, Ethiopia9 reported that a sub-standard waste container was used to transport healthcare waste and the waste was scattered on the road surrounding treatment sites. This may contribute to the risk of injury and infection for waste handlers, healthcare providers, patients, and visitors.
In Jimma Medical Center, a high-temperature double-chamber incinerator was used for the treatment of biomedical waste in addition to other types of waste disposal methods, including a placenta pit. However, the incinerator was operated at a low temperature (<850 °C). This was against the WHO and national guidelines, which recommend biomedical waste incineration at above 850 °C to minimize the formation and release of chemicals or hazardous emissions.15 These indicate that the current practices of biomedical waste treatment in the Jimma Medical Center could contribute to the generation of air pollutants and affect nearby air quality.
The results of this study also confirmed that the higher average concentration of suspended particulate matter (PM2.5 (999.9 μg/m3) and PM10 (1999.9 μg/m3)) and gaseous pollutants total VOCs (4754mg/m3), NO2 (600 μg/m3) and SO2 (300 μg/m3) were recorded at the stack of the incinerator relative to the other sites. The results of this study were higher when compared to those conducted in India28 and Nigeria29 and lower compared to the study conducted in Kenya.30 The variation in concentration measures may due to the type of incinerator, the operating practices employed and variation of meteorological parameters (temperature and relative humidity) (p<0.05). This indicated that people (especially incinerator operators) who stayed near the source of emissions during waste incineration might be more exposed to health risks. Non-use of protective measures by the incinerator operators as observed in this study indicates their exposure to high occupational risk.
The concentration of suspended particulate matter and gaseous pollutants measured at different downwind sites (near stack, at the waste inlet, 100 and 200m) from the incinerator were significantly higher than the upwind background concentration (p<0.05), while there was no observed significant difference in concentration air pollutants measured at a 50m downwind site relative to an upwind background one (p>0.05). This indicated that the incinerator emissions made a significant contribution to the incremental differences in air quality parameters near stack, at waste inlet site, at 100 and 200m distance downwind to incinerator relative to the upwind background. However, incinerator emissions made no significant contribution to variations in pollutant concentrations at a 50m downwind site. The results from the present study were consistent with the study conducted in Vietnam, which reported that incinerator emissions increase the concentration of pollutants at downwind sites relative to upwind sites.31 It was also consistent with a study conducted in Jordan which revealed that the concentration of pollutants reached the ground level and increased the concentration of pollutants at about 200m downwind distance from the source.32
Moreover, there was a significantly higher concentration of all air quality parameters near the incinerator sites, while more remote ones had reduced levels. Distance between the incinerator and downwind sites explained between 48–76% (R2 = 0.48–0.76) of the observed variation in the concentrations of selected air quality parameters. This indicates that emissions from biomedical waste incineration significantly pollute the nearby air quality. Relatively, a much higher rate of change in the total VOC and PM10 concentrations can be observed close to the incinerator site when compared with those at greater distances (R2 = 0.76 and 0.75, respectively). The large diameter suspended particulate matter quickly settles under gravity and may only have an effect in the limited surrounding area. This steep decrease in the concentration of pollutants was very similar to that observed in other studies in the USA33 and Nigeria,34 which revealed that the distance from the source of pollution is negatively correlated with the concentration of pollutants. On the other hand, it is not in agreement with the study conducted in Bangladesh,35 which reported a higher concentration of pollutants at nearly 1km distance far from the incinerator. This may be due to the variation in meteorological factors among the studies sites. In general, the study result indicated that the low temperature (<850OC) incineration of biomedical waste contributed to the significant air pollution impact in the area nearest the source and it was not likely to be discernible at sites distanced downwind from the incinerator.
Conclusion
The average biomedical waste generation rate in Jimma Medical Center (0.92kg/bed/day and/or 0.75kg/patient/day) was above the threshold value of the hazardous healthcare waste generation rate in low-income countries, as reported by WHO, and its management was poor. There is a lack of appropriate waste segregation, storage, transport, treatment, and disposal practices in the medical center. Consequently, all biomedical wastes were mixed, collected, and transported using sub-standard open plastic bins. Moreover, the incinerator was operated at a low temperature for the treatment of biomedical waste, which contributes to the release of huge amounts of air pollutants that create potential local air pollution and health risk for the nearby community.
Acknowledgments
We would like to thanks Gudina Terefe (Ph.D., Associate Professor), Dr. Lemi Melese, Sr. Rahel Enyew, and Mr. Meseret Abdissa for their advice, assistance, and cooperativeness in providing all the necessary data. Our sincere thanks also go to Jimma University, Institute of Health Science, Environmental Health Science and Technology staff members and secretary, National Meteorological Agency Jimma branch, Jimma Medical Center, all our friends and family members who supported us by giving necessary data, constructive ideas, and encouragement.
Disclosure
The authors declare that they have no known competing financial interests or personal relationships that could have appeared to influence the work reported in this paper.
References
1. Nor Faiza MT, Noor Artika HYM. Health C are waste management and sustainable development goals in Malaysia. J Wastes Biom Ass Manag. 2019;1(1):18–20.
2. Shalini S, Harsh M. Evaluation of bio-medical waste management practices in a government medical college and hospital. Nat J Commun Med. 2012;3(1):80–84.
3. WHO. Waste from health care activities; 2016. Available from: http://www.who.int/mediacentre/factsheets/fs253/en/.
4. WHO. Status of Health-Care Waste Management in Selected Countries of the Western Pacific Region, 2008–2013; 2015.
5. Emmanuel J, Pieper U, Rushbrook P, et al. Safe Management of Wastes from Health-Care Activities. World Health Organization. 2014.
6. WHO/UNICEF. Water, Sanitation and Hygiene in Health Care Facilities: Status in Low- and Middle-Income Countries. Geneva: World Health Organization; 2019.
7. Abebe MA. Study of hazardous biomedical waste management practices and development of hazardous biomedical waste management guidelines in Addis Ababa. Int J Sci Eng Sci. 2017;1(8):19–32.
8. Teshiwal Deress Yazie MGT. Healthcare waste management current status and potential challenges in Ethiopia: a systematic review. BMC Res Notes. 2019:1–7. doi:10.1186/s13104-019-4316-y.
9. Tesfahun E. Healthcare Waste in Ethiopia a Study of Waste Generation, Composition and Management in the Amhara National Regional State, Ethiopia. Waste Management & Research. 2015.
10. Kasahun AFA. Ethiopia: Needs Assessment for Implementation of a Public–Private Partnership in Health Care Waste Management in Addis Ababa City. Arlington, VA: AIDSTAR-One; 2014.
11. Berihun D, Solomon Y. Preliminary assessment of the status of hospital incineration facilities as a health care waste management practice in Addis Ababa City, Ethiopia. Adv Recycling Waste Manage. 2017;2:4.
12. Asrat M, Meleko A, Tesfaye T, Asrat meleko HA, Adane A. Assessment of health care waste generation rate and evaluation of its Management System in Mizan Tepi University Teaching Hospital (MTUTH), Bench Maji Zone, South West Ethiopia. Ann Rev Resear. 2018;1(4):555566.
13. National meteorological Agency (NMA). National meteorological services agency agrometeorological bulletin seasonal agro meteorological bulletin. Climate Serv. 2015;15(3):1–19.
14. FMoH. National Guidelines. Addis Abeba, Ethiopia: Federal Ministry of Health, Hygiene and Environmental Health Department; Health-Care Waste Management; 2008.
15. WHO. Overview of Technologies for the Treatment of Infectious and Sharp Waste from Health Care Facilities; 2019.
16. EFMHACA. Ethiopian Food, Medicine and Healthcare Administration and Control Authority Directive, Healthcare Waste Management. Vol. 1; 2005:1–36.
17. Elliott P, Shaddick G, Kleinschmidt I, et al. Cancer Incidence. British Journal of Cancer. 2007:702–710.
18. WHO. Monitoring Ambient Air Quality for Health Impact Assessment. WHO Regional Publications, European Series, No. 8585. 85. 1999.
19. Allen RJ, Brenniman GR. Hospital Waste Incineration of Hospital Waste. Journal of Air Pollution and Control Association. 2012:2470.
20. Mohamed LF, Ebrahim SA, Al-thukair AA. Hazardous healthcare waste management in the Kingdom of Bahrain. Waste Manag. 2009;29(8):2404–2409. doi:10.1016/j.wasman.2009.02.015
21. Windfeld ES, Brooks MS. Medical waste management e A review. J Environ Manage. 2015;163:98–108. doi:10.1016/j.jenvman.2015.08.013
22. Niyongabo E, Chul Y, Daeseok J, Kijune K. Generation, management practices and rapid risk assessment of solid medical wastes: a case study in Burundi. J Mater Cycles Waste Manag. 2019;21(4):956. doi:10.1007/s10163-019-00854-0
23. Wiafe S, Nooni IK, Nlasia MS, Diaba SK. Assessing clinical solid waste management strategies in Sunyani Municipality, Ghana– Evidence from three healthcare facilities. Int J Environ Pollut Res. 2015;3(3):32–52.
24. Klangsin P, Harding AK, Harding AK. Medical Waste Treatment and Disposal Methods Used by Hospitals in Oregon, Washington, and Idaho Medical Waste Treatment and Disposal Methods Used by Hospitals in Oregon. Washington, Idaho; 2011:2247.
25. Debere, MK, Gelaye KA, Alamdo AG, Trifa ZM. Assessment of the health care waste generation rates and its management system in hospitals of Addis Ababa, Ethiopia, 2011. BMC Public Health. 2013;28(2011):1–9.
26. Abebe S. Health care solid waste generation and its management in Hawassa Referral Hospital of Hawassa University, Southern, Ethiopia. Int J Innov Res. 2017;6(5):126–132.
27. Hayleeyesus SF. Healthcare Waste Generation and Management in Public Healthcare Facilities in Healthcare Waste Generation and Management in Public Healthcare Facilities in Adama, Ethiopia. Journal of Health & Pollution. 2016.
28. Manzoor J. Impact of Incineration and Disposal of Biomedical Waste on Air Quality in Gwalior City Impact of Incineration and Disposal of Biomedical Waste on Air Quality in Gwalior City. International Journal of Theoretical and Applied Science.2018.
29. Jonah UU, Alhassan MM, Uwem UM. Heavy metal and air quality assessment around a healthcare waste incinerator facility in Nigeria. Am J Mater Synth Process. 2017;2(6):65–70.
30. Njagi NA, Oloo MA, Kithinji J, Kithinji MJ. Health-Care Waste Incineration and Related Dangers to Public Health: case Study of the Two Teaching and Referral Hospitals in Kenya. J Community Health. 2012;1168–1171.
31. Anh H, Nguyen L, Kim T. Integrated Assessment of Brick Kiln Emission. Environ Monit Assess. 2018:105.
32. Matalqah WI, Consulting M, Mohammad B, Smadi A, Alzboon KK. Air Pollution Impact of Medical Waste Incineration in Semi-Arid Areas. Jordan Journal of Earth and Environmental Science. 2017:2018.
33. Zielinska B, Campbell D, Samburova V, Zielinska B, Campbell D, Samburova V. Impact of emissions from natural gas production facilities on ambient air quality in the Barnett Shale area: a pilot study Impact of emissions from natural gas production facilities on ambient air quality in the Barnett Shale area: a pilot study. J Air Waste Manage Assoc. 2014;64(12):1369–1383. doi:10.1080/10962247.2014.954735
34. Annegarn HJ. Emission of pollutants from wood waste incineration at sawmills in Abeokuta metropolis, Nigeria. Int J Environ Stud. 2013;70(6):956–967. doi:10.1080/00207233.2013.845709
35. Haque I, Nahar K, Kabir H, Salam A. Particulate black carbon and gaseous emission from brick kilns in Greater Particulate black carbon and gaseous emission from brick kilns in Greater Dhaka region, Bangladesh. Air Quality, Atmosphere & Health.2018.
 © 2021 The Author(s). This work is published and licensed by Dove Medical Press Limited. The
full terms of this license are available at https://www.dovepress.com/terms
and incorporate the Creative Commons Attribution
- Non Commercial (unported, 3.0) License.
By accessing the work you hereby accept the Terms. Non-commercial uses of the work are permitted
without any further permission from Dove Medical Press Limited, provided the work is properly
attributed. For permission for commercial use of this work, please see paragraphs 4.2 and 5 of our Terms.
© 2021 The Author(s). This work is published and licensed by Dove Medical Press Limited. The
full terms of this license are available at https://www.dovepress.com/terms
and incorporate the Creative Commons Attribution
- Non Commercial (unported, 3.0) License.
By accessing the work you hereby accept the Terms. Non-commercial uses of the work are permitted
without any further permission from Dove Medical Press Limited, provided the work is properly
attributed. For permission for commercial use of this work, please see paragraphs 4.2 and 5 of our Terms.