Back to Journals » OncoTargets and Therapy » Volume 11
Biomarker expression in rectal cancer tissue before and after neoadjuvant therapy
Authors Boogerd LS, van der Valk MJM, Boonstra MC, Prevoo HA, Hilling DE ![]() , van de Velde CJ, Sier CF
, van de Velde CJ, Sier CF ![]() , Fariña Sarasqueta A, Vahrmeijer AL
, Fariña Sarasqueta A, Vahrmeijer AL
Received 4 July 2017
Accepted for publication 21 October 2017
Published 23 March 2018 Volume 2018:11 Pages 1655—1664
DOI https://doi.org/10.2147/OTT.S145473
Checked for plagiarism Yes
Review by Single anonymous peer review
Peer reviewer comments 2
Editor who approved publication: Dr Jianmin Xu
Leonora SF Boogerd,1 Maxime JM van der Valk,1 Martin C Boonstra,1 Hendrica AJM Prevoo,1 Denise E Hilling,1 Cornelis JH van de Velde,1 Cornelis FM Sier,1 Arantza Fariña Sarasqueta,2 Alexander L Vahrmeijer1
1Department of Surgery, 2Department of Pathology, Leiden University Medical Center, Leiden, the Netherlands
Purpose: Intraoperative identification of rectal cancer (RC) can be challenging, especially because of fibrosis after treatment with preoperative chemo- and radiotherapy (CRT). Tumor-targeted fluorescence imaging can enhance the contrast between tumor and normal tissue during surgery. Promising targets for RC imaging are carcinoembryonic antigen (CEA), epithelial cell adhesion molecule (EpCAM) and the tyrosine-kinase receptor Met (c-Met). The effect of CRT on their expression determines their applicability for imaging. Therefore, we investigated whether CRT modifies expression patterns in tumors, lymph node (LN) metastases and adjacent normal rectal tissues.
Patients and methods: Preoperative biopsies, primary tumor specimens and metastatic LNs were collected from 38 RC patients who did not receive CRT (cohort 1) and 34 patients who did (cohort 2). CEA, EpCAM and c-Met expression was determined using immunohistochemical staining and was semiquantified by a total immunostaining score (TIS), consisting of the percentage and intensity of stained tumor cells (0–12).
Results: In both cohorts CEA, EpCAM and c-Met were significantly highly expressed in >60% of tumor tissues compared with adjacent normal epithelium (T/N ratio, P<0.01). EpCAM showed the most homogenous expression in tumors, whereas CEA showed the highest T/N ratio. Most importantly, CEA and EpCAM expression did not significantly change in normal or neoplastic RC tissue after CRT, whereas levels of c-Met changed (P=0.02). Tissues of eight patients with a pathological complete response after CRT showed expression of all biomarkers with TIS close to normal epithelium.
Conclusion: Histological evaluation shows that CEA, EpCAM and c-Met are suitable targets for RC imaging, because all three are significantly enhanced in cancer tissue from primary tumors or LN metastases compared with normal adjacent tissue. Furthermore, the expression of CEA and EpCAM is not significantly changed after CRT. These data underscore the applicability of c-Met and especially, CEA and EpCAM as targets for image-guided RC surgery, both before and after CRT.
Keywords: imaging, tumor markers, CEA, EpCAM, c-Met, preoperative chemo- and radiotherapy
Background
The cornerstone of rectal cancer (RC) treatment is surgical resection, performed via total mesorectal excision.1 Completeness of the surgical resection is pivotal for the prognosis of RC patients. A positive circumferential resection margin is associated with a high rate of local and distant recurrences, high morbidity and mortality.2,3 The introduction of neoadjuvant chemo- and radiotherapy (CRT) led to a significant decrease in the rate of irradical resections.4 Still, a recent meta-analysis reported a positive resection margin rate of 14.7% after abdominoperineal excision and 27% after pelvic exenteration,5 stressing the need for novel diagnostic imaging tools that can enhance contrast between cancer and adjacent normal/fibrotic tissue during surgery. An imaging modality that can fulfill this need is tumor-targeted fluorescence imaging.6 This innovative technique can provide real-time intraoperative tumor visualization by selectively highlighting tumor cells.
Selection of tumor targets for imaging purposes depends on various characteristics including the expression pattern, localization of the biomarker in the cell and the tumor-to-normal (T/N) expression ratio.7,8 Prerequisite is a low or absent expression of a protein in normal tissue in combination with enhanced expression in cancer lesions. Promising targets for detection of RC are carcinoembryonic antigen (CEA), epithelial cell adhesion molecule (EpCAM) and the tyrosine-kinase receptor c-Met.9–11 The glycoprotein CEA is overexpressed in the vast majority of colorectal cancer (CRC) and has already been used for therapeutic and imaging purposes.12,13 Recently, an early phase clinical trial has been initiated utilizing a CEA-targeted fluorescent tracer for intraoperative detection of CRC.32 EpCAM is a transmembrane glycoprotein, involved in cell–cell interactions and cell–stroma adhesion, and is overexpressed in nearly all epithelial malignancies.14 The recognition of EpCAM as one of the most promising pluripotent tumor markers has resulted in (pre)clinical testing of several EpCAM-targeted agents.10,15,16 First-in-human studies with an EpCAM-specific fluorescent agent to visualize various tumors during surgery are planned to start soon in our institution. c-Met, the receptor of hepatocyte growth factor (HGF), is involved in tumor cell proliferation and invasion, and its enhanced expression is associated with a poorer survival.17 The upregulation of c-Met in (pre)malignant colorectal lesions supported the successful clinical testing of a c-Met targeted fluorescent peptide, ie, GE-137, for better endoscopic detection of colorectal adenomas.11,18
Although several studies showed overexpression of CEA, EpCAM and c-Met in CRC tissues,18–20 the effect of CRT on protein expression is still unknown. This issue is however important for the reliable applicability of CEA-, EpCAM- and c-Met-targeted fluorescent contrast agents for RC imaging, as the majority of RC patients receive neoadjuvant CRT. In addition, this knowledge can be utilized for application of CEA-, EpCAM or c-Met-targeted tracers for other imaging purposes, such as positron emission tomography- or single-photon emission computed tomography imaging. The aim of this study was to investigate whether CRT modifies expression of CEA, EpCAM and c-Met in RC tissues and in adjacent normal epithelium. Therefore, we first studied the concordance in protein expression between diagnostic biopsies and tissues from primary resected adenocarcinomas and lymph node (LN) metastases of patients who did not receive neoadjuvant CRT, in order to establish that there are no significant differences between biomarker levels. Subsequently, the effect of CRT was studied in an additional cohort by correlating CEA, EpCAM and c-Met expression between biopsies, obtained prior to the start of CRT, versus primary tumors and metastatic LNs.
Patients and methods
Tissue samples
Formalin-fixed paraffin-embedded (FFPE) tissue blocks from 72 patients, who underwent surgical resection of RC or polypectomy between 2000 and 2015, were obtained from the Pathology Department of the Leiden University Medical Center (LUMC, Leiden, the Netherlands) (Table 1). Medical records and pathology samples were retrospectively reviewed. Patients were divided into two cohorts based on their therapy: cohort 1 was defined by patients without neoadjuvant CRT whereas cohort 2 comprised the neoadjuvantly treated patients (Figure 1). CRT consisted of a combination of chemo- and radiotherapy, eg, 25×2 Gray and Capecitabine with/without Avastin or 5×5 Gray with Capecitabine plus Oxaliplatin (RAPIDO study design).21 Available FFPE tissue blocks of diagnostic biopsy specimens, tumor resection material and metastatic LNs were collected. All biopsies from patients treated with neoadjuvant CRT were obtained via endoscopic procedures, prior to the start of CRT. Multiple biopsy specimens of individual patients were incorporated on one slide. Eight patients showed a pathological complete response (pCR) after CRT. These tissues were also included in the study to assess the expression of biomarkers on normal/fibrotic epithelium. All samples were nonidentifiable and used in accordance with the code for proper secondary use of human tissue as prescribed by the Dutch Federation of Medical Scientific Societies, which does not require informed consent. The use of archived human tissue conformed to an informed protocol that had been reviewed and approved by the institutional review board of the LUMC.
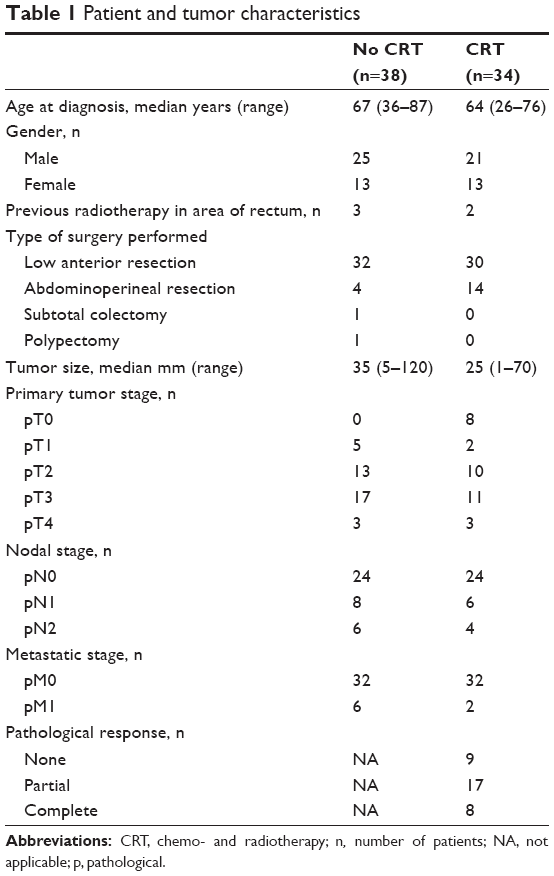 | Table 1 Patient and tumor characteristics |
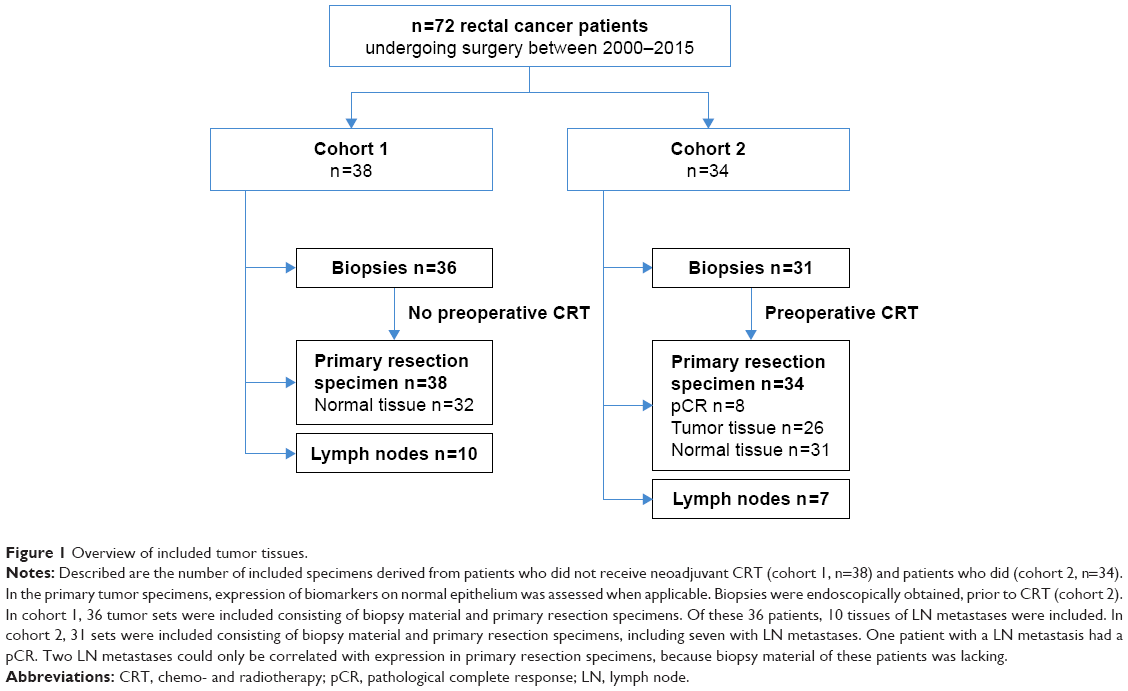 | Figure 1 Overview of included tumor tissues. |
Immunohistochemistry (IHC)
Based on hematoxylin–eosin-stained slides, a representative FFPE tissue block containing tumor and normal tissue from each patient was chosen by a board-certified pathologist (A.F.S.). After sectioning the FFPE blocks in 4 μm slides, these were mounted on adhesive slides (Starfrost), deparaffinized using xylene and rehydrated in decreasing concentrations of ethanol. Subsequently, slides were rinsed with distilled (DI) water and endogenous peroxidase was blocked with 0.3% hydrogen peroxidase (Merck Millipore) for 20 minutes. Slides were rinsed with DI water and antigen retrieval was performed in the DAKO PT LINK, Target Retrieval Solution pH 6.0 at 95°C for 10 minutes. After rinsing with phosphate buffered saline, slides were stained with predetermined dilutions using monoclonal antibodies (mAb) against CEACAM5 (clone CI-P83-1, SC-23928 from Santa Cruz Biotechnology, 0.2 μg/mL, dilution 1:2,500), EpCAM (clone MOC-31, Acris Antibodies, dilution 1:10,000) and a polyclonal antibody against c-Met (polyclonal rabbit, Santa Cruz SC-10, 1 μg/mL, dilution 1:100). After overnight incubation with the primary antibodies, slides were incubated with the secondary antibody (EnVision antimouse horseradish peroxidase [DAKO]) for 30 minutes, followed by diaminobenzidine solution (DAB+; DAKO Kit). All slides were counterstained with hematoxylin, dehydrated and finally mounted with pertex.
Scoring method
All tumor tissues, metastatic LNs, normal appearing mucosae and fibrotic rectal tissues from patients who had a pCR after CRT were scored for expression of CEA, EpCAM and c-Met. The total immunostaining score (TIS) was calculated by multiplying the proportion score (PS) and intensity score (IS), as previously described.20 The PS represented the percentage of positively stained tumor cells and ranged between 0 and 4 (0= none; 1<10%; 2=10%–50%; 3=51%–80%; 4>80%). The IS represented the intensity of the stained tumor cells and could range between 0 and 3 (0= no staining; 1= weak; 2= moderate; 3= strong). Subgroups were defined based on the calculated TIS: 0, no expression; 1–4, weak expression; 6–8, moderate expression; 9–12, intense expression. Homogeneous expression was defined when >80% of tumor cells, with a staining intensity of ≥1, showed expression of one of the biomarkers (PS =4). Evaluation of the IHC staining was performed independently by two observers (A.F.S. and L.B.). All the sections with interobserver disagreement were discussed with a board certified pathologist until agreement was reached.
Statistical analyses
Statistical analyses were performed using SPSS version 23.0 software (SPSS©; IBM Corporation, NY, USA) and GraphPad Prism 6 (GraphPad Software Inc., La Jolla, CA, USA). For each patient, biomarker expression on biopsies, resected primary tumors and metastatic LNs was compared using the Mann–Whitney test. Differences in expression levels between cohort 1 (no CRT) and cohort 2 (CRT) were calculated using the Wilcoxon rank test. This test was also used to calculate differences in expression levels between tumor and adjacent normal tissue per patient. Additionally, a Mann–Whitney test was performed to compare these analyses between patients of cohorts 1 and 2. A Kruskal–Wallis test was used to determine the differences in T/N ratio between all three biomarkers. In all tests, results were considered statistically significant at the level of P<0.05.
Results
Patient and tumor characteristics are summarized in Table 1. Briefly, 38 patients did not receive neoadjuvant CRT (cohort 1). Of these patients, available biopsy specimens (n=36), primary tumor specimens (n=38) and metastatic LNs (n=10) were collected (Figure 1). In cohort 2, 34 patients treated with neoadjuvant CRT were included. Available biopsy specimens (n=31), obtained prior to the start of CRT, primary tumor specimens (n=34) and metastatic LNs (n=7) were collected. Eight out of 34 patients had a pCR after neoadjuvant CRT.
CEA, EpCAM and c-Met expression
Representative examples of CEA, EpCAM and c-Met staining in tumor tissue derived from a patient from cohort 1 are shown in Figure 2. CEA was mainly expressed on the apical side of cancer cells, while EpCAM and c-Met showed a more circumferential, membranous staining. Moreover, lymphoid cells, histiocytes and necrotic areas were also stained positive for c-Met. Figure 3 shows similar representative stainings in a patient from cohort 2. All biomarkers showed some positivity in noncancerous mucin producing cells in neoadjuvantly treated tissues. CEA, EpCAM and c-Met expression scores of all tumor tissues are shown in Table 2. The median TIS of all biomarkers in all tumor tissues was 12. In cohort 1, homogenous expression of CEA, EpCAM and c-Met was found in respectively 28/38 (74%), 34/38 (89%) and 31/38 (82%) of the malignancies in resection material, which was significantly similar to the expression of CEA, EpCAM and c-Met in malignancies in resection material in cohort 2, found in respectively 19/26 (73%), 24/26 (92%) and 22/26 (85%) of samples.
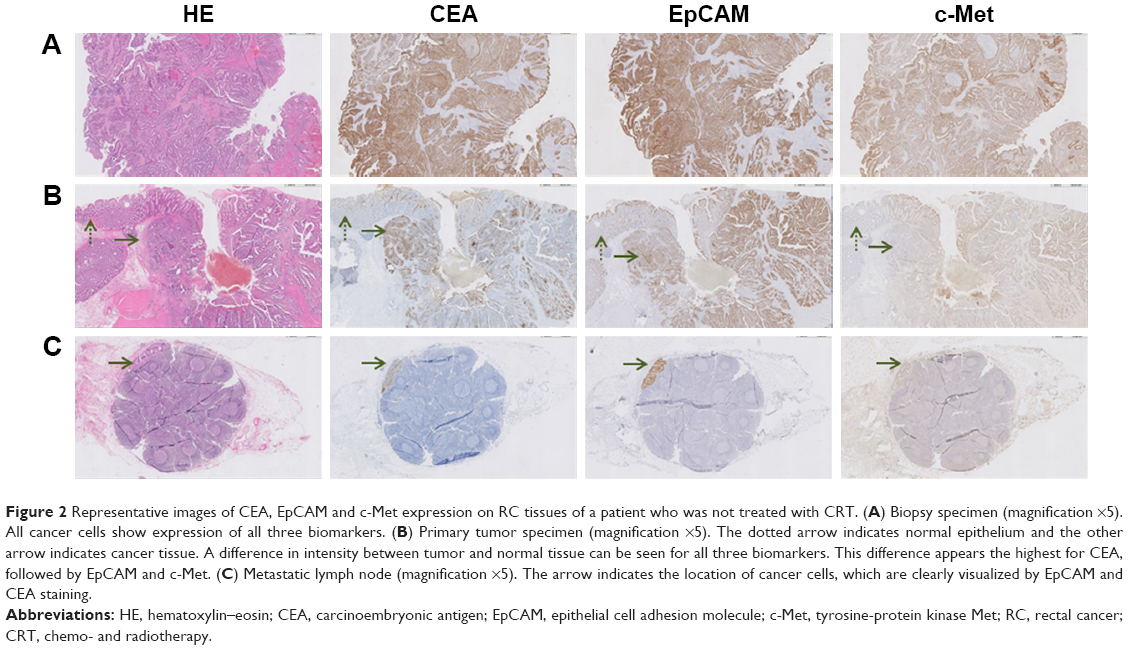 | Figure 2 Representative images of CEA, EpCAM and c-Met expression on RC tissues of a patient who was not treated with CRT. (A) Biopsy specimen (magnification ×5). All cancer cells show expression of all three biomarkers. (B) Primary tumor specimen (magnification ×5). The dotted arrow indicates normal epithelium and the other arrow indicates cancer tissue. A difference in intensity between tumor and normal tissue can be seen for all three biomarkers. This difference appears the highest for CEA, followed by EpCAM and c-Met. (C) Metastatic lymph node (magnification ×5). The arrow indicates the location of cancer cells, which are clearly visualized by EpCAM and CEA staining. |
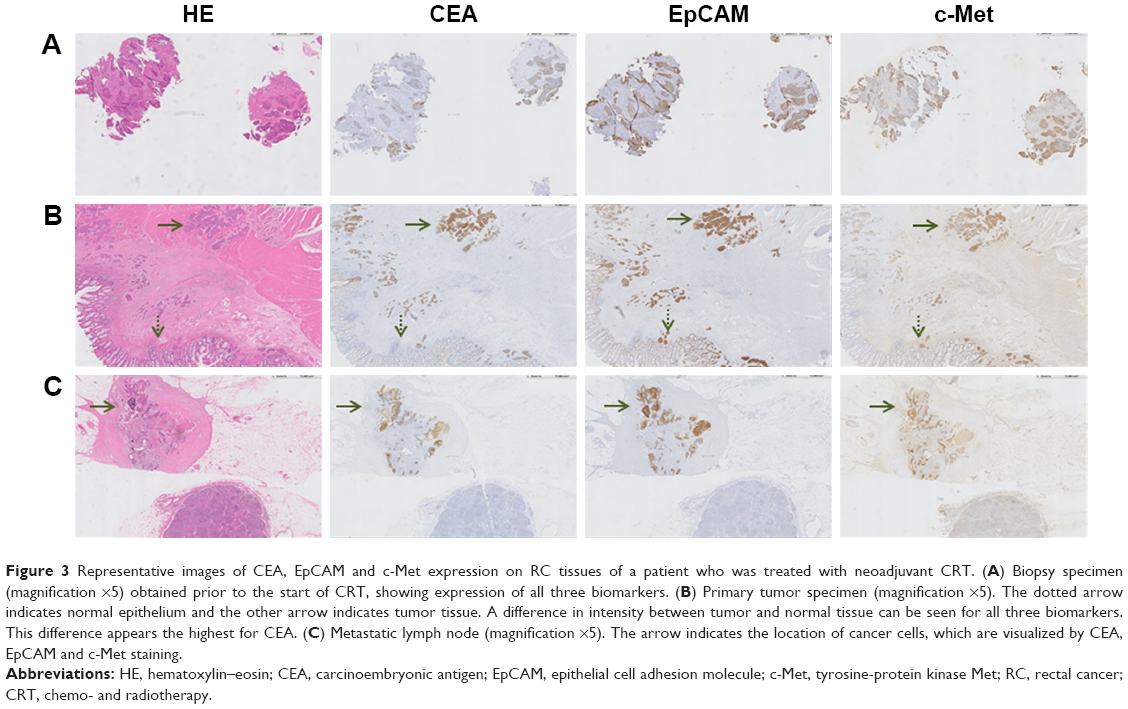 | Figure 3 Representative images of CEA, EpCAM and c-Met expression on RC tissues of a patient who was treated with neoadjuvant CRT. (A) Biopsy specimen (magnification ×5) obtained prior to the start of CRT, showing expression of all three biomarkers. (B) Primary tumor specimen (magnification ×5). The dotted arrow indicates normal epithelium and the other arrow indicates tumor tissue. A difference in intensity between tumor and normal tissue can be seen for all three biomarkers. This difference appears the highest for CEA. (C) Metastatic lymph node (magnification ×5). The arrow indicates the location of cancer cells, which are visualized by CEA, EpCAM and c-Met staining. |
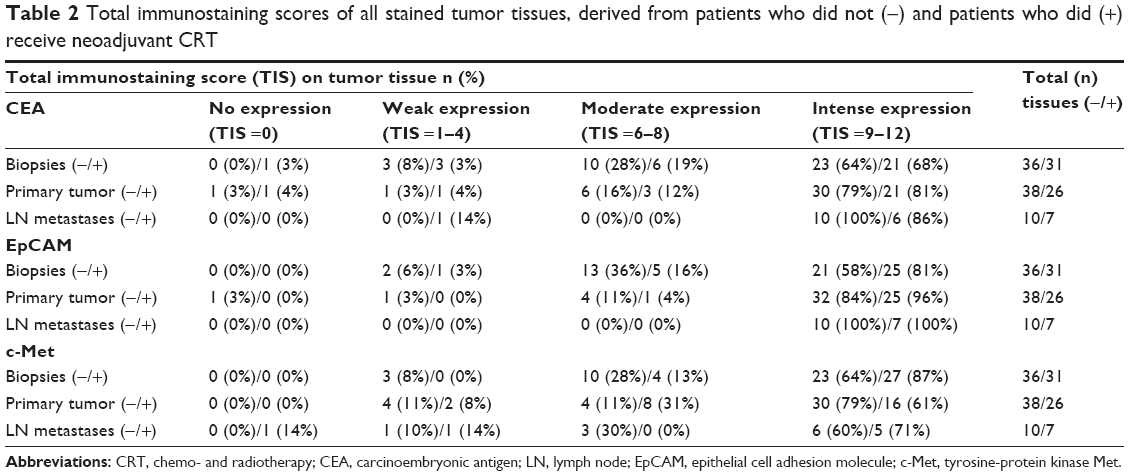 | Table 2 Total immunostaining scores of all stained tumor tissues, derived from patients who did not (−) and patients who did (+) receive neoadjuvant CRT |
Comparison between biomarker expression before and after CRT
The degree of concordance of CEA, EpCAM and c-Met expression between the various tumor tissues, ie, biopsy, tumor in resection material and metastatic LN, is shown in Table 3. In cohort 1, >61% of biopsies showed concordant expression with their corresponding resected tumor. The majority of discordant scores were due to a difference in intense vs moderate expression between the tumor tissues, ie, 10/14 (71%) discordant scores for CEA and EpCAM, and 6/7 (86%) discordant scores for c-Met. There was no significant difference in expression of any of the three biomarkers between endoscopically obtained biopsy specimens and resection specimens per individual patient (P=0.43 for CEA, P=0.10 for EpCAM and P=0.41 for c-Met). These data suggest that differences found between stainings in biopsies and resected material in cohort 2, are exclusively induced by CRT.
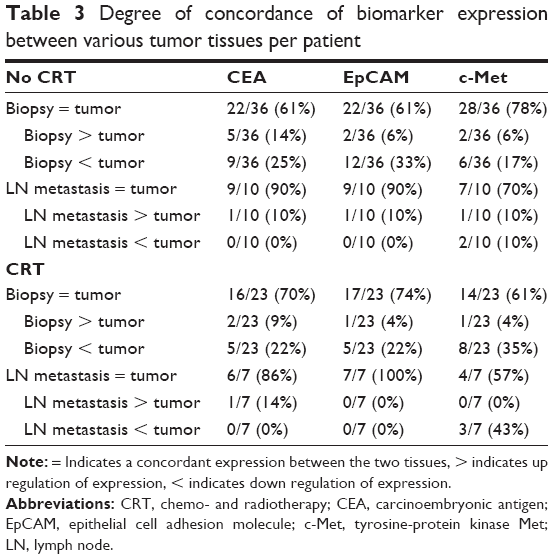 | Table 3 Degree of concordance of biomarker expression between various tumor tissues per patient |
Also in cohort 2, the majority (>61%) of cases showed a concordant expression pattern when comparing biopsies and resection material, despite the fact that biopsies were obtained prior to the start of neoadjuvant CRT and primary tumors after CRT. The concordance between biopsies is shown in Table 2 and graphically displayed in Figure 4. No significant difference in CEA and EpCAM expression was found between the various tumor tissues per patient (P=0.52 for CEA, P=0.11 for EpCAM). However, c-Met expression appeared significantly different between biopsies and resected tumors (P=0.02). Again, most discordant expression scores between biopsies and primary tumors were due to minor differences in TIS between intense vs moderate; 4/7 (57%) disconcordant scores for CEA, 5/6 (83%) for EpCAM and 7/9 (78%) for c-Met. Finally, when comparing all tumor tissues from patients who did not receive CRT with patients who did, no significant differences were found between expression in primary tumors and between expression in metastatic LNs (all P-values >0.05). CEA, EpCAM and c-Met expression did not significantly differ between tumor tissues that showed no response after CRT and tissues that showed a partial pathological response.
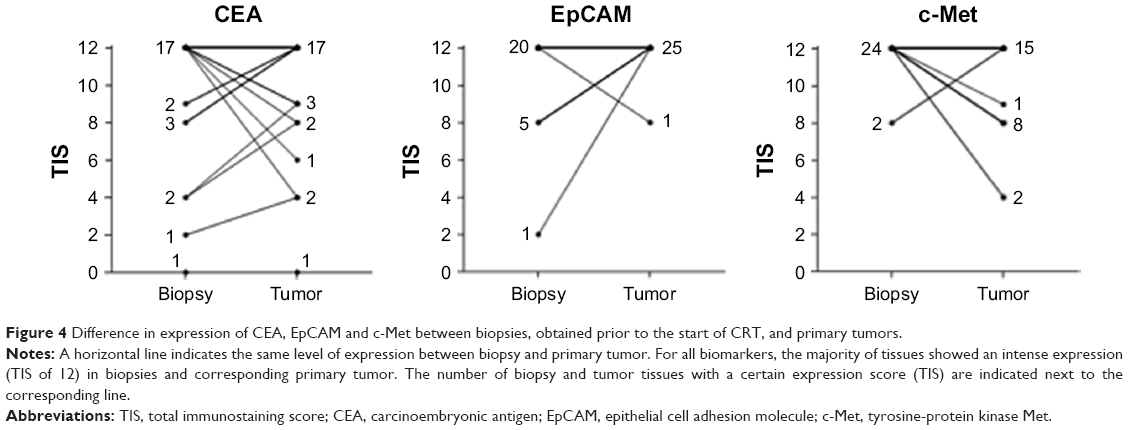 | Figure 4 Difference in expression of CEA, EpCAM and c-Met between biopsies, obtained prior to the start of CRT, and primary tumors. |
Comparison of biomarker expression between carcinoma and adjacent normal tissue
Figure 5 shows the distribution of CEA, EpCAM and c-Met TIS in tumor tissues compared with normal adjacent epithelial tissues, from both cohorts of patient together. All three biomarkers were significantly upregulated in cancer tissue compared to normal tissue of the same patient (P<0.01 for CEA, EpCAM and c-Met). Median TIS expression in normal epithelium were respectively 4 (0–12) for CEA, 12 (0–12) for EpCAM and 8.5 (0–12) for c-Met. A significant difference between biomarkers was found using a Kruskal–Wallis test with the highest mean rank for CEA, followed by equal mean ranks for EpCAM and c-Met (P<0.01).
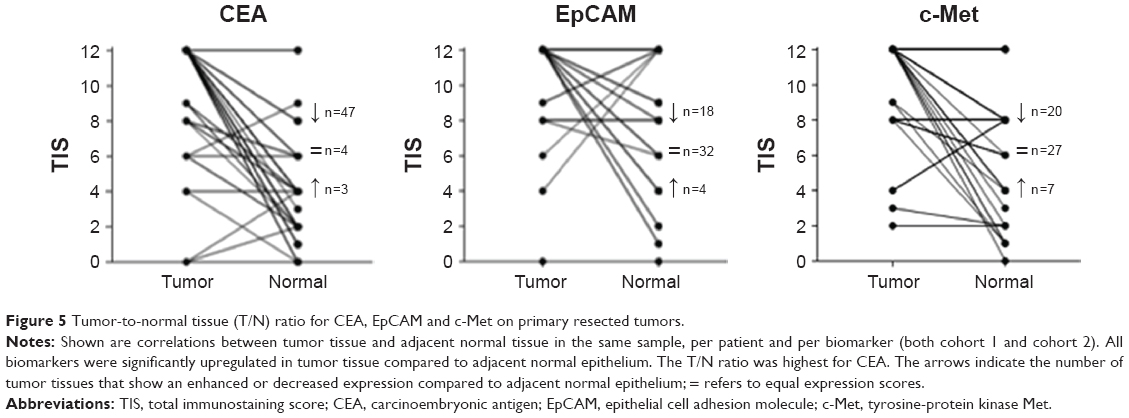 | Figure 5 Tumor-to-normal tissue (T/N) ratio for CEA, EpCAM and c-Met on primary resected tumors. |
Expression on tissue with complete pathological response
Median biomarker expression scores (TIS) in the tumor bed of resected tissue from patients with a pCR after neoadjuvant CRT were respectively 5 (1–12) for CEA, 10.5 (4–12) for EpCAM and 8.5 (4–12) for c-Met. CEA expression was seen on the surface of normal epithelium and similarly EpCAM and c-Met, in mucin producing cells. The muscularis propria showed some expression of c-Met (probably nonspecific binding).
Discussion
Tumor-targeted fluorescence imaging has the potential to revolutionize the current practice of oncologic surgery by selectively highlighting neoplastic cells. This technique may be particularly useful during RC surgery, as clear tumor visualization is sometimes impaired by anatomic constrains such as a narrow pelvis. The present data confirm the results of previous studies that expression of the studied biomarkers CEA, EpCAM and c-Met is increased in tumor tissue as compared with normal mucosa from the same patient, and hence in principle could be used as targets for image-guided assistance during surgery. However, a substantial part of RC patients are nowadays treated with neoadjuvant CRT to induce down staging and to achieve local control.22 Although the addition of CRT leads to a decrease in recurrence rates, it also causes massive tissue fibrosis which in turn hinders intraoperative tumor localization.23 The data presented here demonstrate that the expression of CEA and EpCAM does not significantly differ between endoscopically obtained diagnostic biopsies, resected primary tumors and LN metastases, in patients treated with or without neoadjuvant CRT. These results demonstrate the usability of these biomarkers for RC imaging. Expression of c-Met differed significantly between biopsies and resected tumors in cohort 2, which might reflect an effect of the CRT on protein expression, but could also be the result of a small sample size.
In the current study, we showed that all three proteins are abundantly expressed in the vast majority of RC tissues, confirming previous studies with larger cohorts.18–20 Although IHC is not a fully quantitative technique, and results might depend on the selected antibodies and tissue fixation, the representative figures show that CEA and EpCAM seem to outperform c-Met with respect to staining intensity in tumors. Unlike CEA and EpCAM, which are involved in cell adhesion, c-Met is a tyrosine kinase receptor that becomes activated after binding of the HGF. Due to the pivotal role of c-Met in cancer biology and overexpression in several cancer types, it is regarded as a promising target for molecular tumor imaging, including colorectal neoplasia.11,24 Still, the numbers of this receptor per tumor cell might be lower compared to adhesion molecules like CEA and EpCAM, as reflected in the expression scores within this study.8
A prerequisite for appropriate tumor targets in image-guided surgery is enhanced expression on tumor cells compared to adjacent normal tissue.7 CEA and EpCAM are cell adhesion molecules and both are moderately expressed on normal cylindrical epithelium and goblet cells.25,26 Although EpCAM showed the highest amount of homogenous tumor expression among all three biomarkers, the difference in the TIS between tumor and normal tissue was relatively low. This could seem a disadvantage for EpCAM as a target. However, while analyzing these data, one should take the limitations of IHC scorings into consideration during quantification of protein expression. For instance, a difference between 10,000 EpCAM molecules on a regular cell and 400,000 on a neoplastic cells would probably not be noticed by conventional IHC, but would be enough to discriminate tumor from normal tissue using fluorescence imaging. On the other hand, CEA has the disadvantage of being anchored to the cell membrane via a GPI-anchor, making it vulnerable for shedding in the bloodstream.8 As a result, high levels of soluble CEA could scavenge the intravenously administered targeting agent, which is a disadvantage for CEA-based imaging.
Our group has previously described the preclinical evaluation of a fluorescent labeled EpCAM-specific mAb and a CEA-specific single-chain antibody fragment, respectively and showed successful fluorescent delineation of several tumor models, including CRC and peritonitis carcinomatosis.9,10 As already indicated in the previous paragraph, preclinical models can only partly mimic the human situation. The most important factor that influences the tumor-to-background ratio during clinical application of tumor-targeted agents will be the presence of the targeted receptor on adjacent normal cells. Both EpCAM and CEA expression are described to be confined to the basolateral surface of normal polarized epithelial cells, where these receptors might be less accessible for targeting by intravenous administered agents.26–28 When epithelial cells dedifferentiate into tumor cells, polarity is lost and CEA and EpCAM become expressed throughout the entire membrane. This phenomenon would be advantageous for tumor imaging. Especially for normal enterocytes, with a lifespan of 1–2 days, the continuous shedding of these cells into the bowel lumen would result in relatively low background fluorescence in normal mucosa, especially when imaging occurs a few days after tracer administration.
The main drawbacks of this study are the relatively low numbers of tissue sets and the use of semiquantitative IHC. The collection of tumor tissue before and after CRT implies that both endoscopic diagnostic biopsy material and resection material of the same patient are available at the same institution. Our hospital is a reference hospital for some regional hospitals and therefore many of the diagnostic biopsies are taken elsewhere. Collecting the material is tedious and time consuming. Our approach of studying two cohorts of patients showed that the differences of expression of the three selected biomarkers before and after CRT were limited. IHC is relatively easy to perform, available at low costs compared to other diagnostic techniques, and provides information about the expression patterns of certain proteins in various cell types, which is pivotal information for imaging purposes. Although it is routinely used nowadays, IHC in most cases lacks standardization (pretest variability) and variance in interpretation of the staining (post-test variability).20 To minimize these limitations, we performed IHC staining with validated antibodies and used a scoring method that was previously evaluated.20 Nevertheless, differences in expression could be observed by using various antibodies against the same target. Especially for c-Met, the use of a polyclonal antibody might be difficult in comparison with other studies.
A promising application of CEA, EpCAM or c-Met-targeted fluorescent agents might be the implementation during (endoscopic) surveillance of patients eligible for the Watch-and-Wait strategy (W&W), or during transanal endoscopic microsurgery (TEM).29,30 Over the last years, organ-preserving approaches for RC patients, such as the W&W strategy for patients with a complete clinical response (cCR) and TEM, are gaining interest.30 As recent studies show a local regrowth rate up to 38% in patients selected for W&W, it seems that conventional imaging modalities are not able to select patients sufficiently.31 Therefore, tumor-targeted fluorescence imaging during colonoscopies may assist in identification of a cCR, or residual tumor cells. This application would however only be valuable when markers are sensitive and specific enough to distinguish between normal tissue, fibrotic tissue and scattered tumor cells. In the eight tissues derived from patients with a pCR, all biomarkers showed some expression in the resected fibrotic tumor bed, but were considerably less in the tumors. Larger studies are needed to confirm these findings and assess the expression of these and other biomarkers in patients with a pCR, both for primary and recurrent RC patients.
Conclusion
This study shows that CEA, EpCAM and c-Met are abundantly expressed in RC and LN metastases, and that modifications of protein expression by CRT in tumor or adjacent normal tissue are limited. Homogenous expression in RC tissues of primary tumors and metastatic LNs was highest for EpCAM. But, based on staining of normal adjacent epithelium, CEA appeared the most distinctive biomarker. The data of the present study underscore a reliable applicability of CEA-, EpCAM- and c-Met-targeted imaging agents, which have recently been or will soon be used in clinical practice. A firm conclusion about which biomarker has the highest potential cannot be drawn based only on IHC or on animal models. Only comparative clinical trials can answer this question.
Acknowledgments
The authors gratefully acknowledge PJ Bongers, S Bhairosingh and GW van Pelt for their support and immunohistochemical expertise. This work was supported by the Dutch Cancer Society (grants UL2010-4732 and UL2015-8089) and by the European Research Council through an ERC Advanced Grant (project SURVive, grant 323105).
Disclosure
The authors report no conflicts of interest in this work.
References
Heald RJ. A new approach to rectal cancer. Br J Hosp Med. 1979;22(3):277–281. | ||
Rickles AS, Dietz DW, Chang GJ, et al; Consortium for Optimizing the Treatment of Rectal Cancer (OSTRiCh). High rate of positive circumferential resection margins following rectal cancer surgery: a call to action. Ann Surg. 2015;262(6):891–898. | ||
Nagtegaal ID, Quirke P. What is the role for the circumferential margin in the modern treatment of rectal cancer? J Clin Oncol. 2008;26(2):303–312. | ||
Peeters KC, Marijnen CA, Nagtegaal ID, et al; Dutch Colorectal Cancer Group. The TME trial after a median follow-up of 6 years: increased local control but no survival benefit in irradiated patients with resectable rectal carcinoma. Ann Surg. 2007;246(5):693–701. | ||
Simillis C, Baird DL, Kontovounisios C, et al. A systematic review to assess resection margin status after abdominoperineal excision and pelvic exenteration for rectal cancer. Ann Surg. 2017;265(2):291–299. | ||
Vahrmeijer AL, Hutteman M, van der Vorst JR, van de Velde CJ, Frangioni JV. Image-guided cancer surgery using near-infrared fluorescence. Nat Rev Clin Oncol. 2013;10(9):507–518. | ||
van Oosten M, Crane LM, Bart J, van Leeuwen FW, van Dam GM. Selecting potential targetable biomarkers for imaging purposes in colorectal cancer using target selection criteria (TASC): a novel target identification tool. Transl Oncol. 2011;4(2):71–82. | ||
Boonstra MC, de Geus SW, Prevoo HA, et al. Selecting targets for tumor imaging: an overview of cancer-associated membrane proteins. Biomark Cancer. 2016;8:119–133. | ||
Boonstra MC, Tolner B, Schaafsma BE, et al. Preclinical evaluation of a novel CEA-targeting near-infrared fluorescent tracer delineating colorectal and pancreatic tumors. Int J Cancer. 2015;137(8):1910–1920. | ||
van Driel PB, Boonstra MC, Prevoo HA, et al. EpCAM as multi-tumour target for near-infrared fluorescence guided surgery. BMC Cancer. 2016;16(1):884. | ||
Burggraaf J, Kamerling IM, Gordon PB, et al. Detection of colorectal polyps in humans using an intravenously administered fluorescent peptide targeted against c-Met. Nat Med. 2015;21(8):955–961. | ||
Sahlmann CO, Homayounfar K, Niessner M, et al. Repeated adjuvant anti-CEA radioimmunotherapy after resection of colorectal liver metastases: safety, feasibility, and long-term efficacy results of a prospective phase 2 study. Cancer. 2017;123(4):638–649. | ||
Schoffelen R, Boerman OC, Goldenberg DM, et al. Development of an imaging-guided CEA-pretargeted radionuclide treatment of advanced colorectal cancer: first clinical results. Br J Cancer. 2013;109(4):934–942. | ||
Trzpis M, McLaughlin PM, de Leij LM, Harmsen MC. Epithelial cell adhesion molecule: more than a carcinoma marker and adhesion molecule. Am J Pathol. 2007;171(2):386–395. | ||
Loibner H, Eckert H, Eller N, et al. A randomized placebo-controlled phase II study with the cancer vaccine IGN101 in patients with epithelial solid organ tumors (IGN101/2-01). J Clin Oncol. 2004;22:2619. | ||
Liao MY, Lai JK, Kuo MY, et al. An anti-EpCAM antibody EpAb2-6 for the treatment of colon cancer. Oncotarget. 2015;6(28):24947–24968. | ||
Blumenschein GR Jr, Mills GB, Gonzalez-Angulo AM. Targeting the hepatocyte growth factor-cMET axis in cancer therapy. J Clin Oncol. 2012;30(26):3287–3296. | ||
Di Renzo MF, Olivero M, Giacomini A, et al. Overexpression and amplification of the met/HGF receptor gene during the progression of colorectal cancer. Clin Cancer Res. 1995;1(2):147–154. | ||
Park JW, Chang HJ, Kim BC, Yeo HY, Kim DY. Clinical validity of tissue carcinoembryonic antigen expression as ancillary to serum carcinoembryonic antigen concentration in patients curatively resected for colorectal cancer. Colorectal Dis. 2013;15(9):e503–e511. | ||
Spizzo G, Fong D, Wurm M, et al. EpCAM expression in primary tumour tissues and metastases: an immunohistochemical analysis. J Clin Pathol. 2011;64(5):415–420. | ||
Nilsson PJ, van Etten B, Hospers GA, et al. Short-course radiotherapy followed by neo-adjuvant chemotherapy in locally advanced rectal cancer–the RAPIDO trial. BMC Cancer. 2013;13:279. | ||
van de Velde CJ, Boelens PG, Borras JM, et al. EURECCA colorectal: multidisciplinary management: European consensus conference colon & rectum. Eur J Cancer. 2014;50(1):1.e1–1.e34. | ||
Torres ML, McCafferty MH, Jorden J. The difficulty with localization of rectal cancer after neoadjuvant chemoradiation therapy. Am Surg. 2010;76:974–976. | ||
Pool M, van Dam GM, de Vries EG. Emerging opportunities for c-MET visualization in the clinic. J Nucl Med. 2016;57:663–664. | ||
Hammarstrom S. The carcinoembryonic antigen (CEA) family: structures, suggested functions and expression in normal and malignant tissues. Semin Cancer Biol. 1999;9(2):67–81. | ||
Xin Xie, Chun-Yan Wang, Yun-Xin Cao, et al. Expression pattern of epithelial cell adhesion molecule on normal and malignant colon tissues. World J Gastroenterol. 2005;11(3):344–347. | ||
Tiernan JP, Perry SL, Verghese ET, et al. Carcinoembryonic antigen is the preferred biomarker for in vivo colorectal cancer targeting. Br J Cancer. 2013;108(3):662–667. | ||
Ogura E, Senzaki H, Yoshizawa K, Hioki K, Tsubura A. Immunohistochemical localization of epithelial glycoprotein EGP-2 and carcinoembryonic antigen in normal colonic mucosa and colorectal tumors. Anticancer Res. 1998;18(5B):3669–3675. | ||
O’Neill CH, Platz J, Moore JS, Callas PW, Cataldo PA. Transanal endoscopic microsurgery for early rectal cancer: a single-center experience. Dis Colon Rectum. 2017;60(2):152–160. | ||
Beets GL, Figueiredo NF, Beets-Tan RG. Management of rectal cancer without radical resection. Annu Rev Med. 2017;68:169–182. | ||
Renehan AG, Malcomson L, Emsley R, et al. Watch-and-wait approach versus surgical resection after chemoradiotherapy for patients with rectal cancer (the OnCoRe project): a propensity-score matched cohort analysis. Lancet Oncol. 2016;17(2):174–183. | ||
Boogerd LSF, Hoogstins CES, Schaap DP, et al. Safety and effectiveness of SGM-101, a fluorescent antibody targeting carcinoembryonic antigen, for intraoperative detection of colorectal cancer: a dose-escalation pilot study. Lancet Gastroenterol Hepatol. 2018. (Epub ahead of print). |
 © 2018 The Author(s). This work is published and licensed by Dove Medical Press Limited. The
full terms of this license are available at https://www.dovepress.com/terms
and incorporate the Creative Commons Attribution
- Non Commercial (unported, 3.0) License.
By accessing the work you hereby accept the Terms. Non-commercial uses of the work are permitted
without any further permission from Dove Medical Press Limited, provided the work is properly
attributed. For permission for commercial use of this work, please see paragraphs 4.2 and 5 of our Terms.
© 2018 The Author(s). This work is published and licensed by Dove Medical Press Limited. The
full terms of this license are available at https://www.dovepress.com/terms
and incorporate the Creative Commons Attribution
- Non Commercial (unported, 3.0) License.
By accessing the work you hereby accept the Terms. Non-commercial uses of the work are permitted
without any further permission from Dove Medical Press Limited, provided the work is properly
attributed. For permission for commercial use of this work, please see paragraphs 4.2 and 5 of our Terms.