
Back to Journals » Journal of Asthma and Allergy » Volume 19
Biomarker-Defined Endotypes and Clinical Phenotypes of Asthma: A Cluster-Based Analysis of Type-2 Inflammatory Patterns and Their Clinical Correlates
Authors Feteih IHE  , Ali A
Received 11 January 2026
Accepted for publication 29 April 2026
Published 15 May 2026 Volume 2026:19 591831
DOI https://doi.org/10.2147/JAA.S591831
Checked for plagiarism Yes
Review by Single anonymous peer review
Peer reviewer comments 4
Editor who approved publication: Dr Luis Garcia-Marcos
Ibrahim Hamdy Elsayed Feteih,1,* Asmaa Ali2– 4,*
1Department of Pulmonary and Sleep Medicine, Ain Al-Khaleej Hospital, Al-Ain, Abu Dhabi, United Arab Emirates; 2Department of Laboratory Medicine, School of Medicine, Jiangsu University, Zhenjiang, 212013, People’s Republic of China; 3Department of Allergy, Al-Rashid Allergy Center, KMOH, Sulaibikhat, Kuwait; 4Department of Pulmonary Medicine, Abbassia Chest Hospital, EMOH, Cairo, Egypt
*These authors contributed equally to this work
Correspondence: Asmaa Ali, Email [email protected]
Background: Asthma is a biologically heterogeneous disease characterized by diverse inflammatory mechanisms, yet the clinical translation of this heterogeneity into clearly defined, biomarker-driven endotypes remains limited in real-world populations. Although Type-2 (T2) inflammation predominates in many patients, the overlap between allergic and eosinophilic pathways and the identification of distinct endotypes with specific clinical correlates are not fully characterized. This study aimed to define biomarker-based asthma endotypes using unsupervised clustering and to explore their associated clinical and demographic features.
Methods: In this cross-sectional study, asthmatic patients evaluated at a tertiary hospital were included. Demographics, body mass index (BMI), comorbidities, age of onset, disease duration, spirometry parameters, bronchodilator reversibility, allergic status, and inflammatory biomarkers; total IgE, blood eosinophil count (BEC), and fractional exhaled nitric oxide (FeNO), were retrieved from medical records. Standardized biomarker values were analyzed using hierarchical clustering to define asthma endotypes. Clinical and demographic differences between clusters were subsequently compared.
Results: Among 162 patients, females predominated (69.1%), and overweight/obesity was common (median BMI 29.15 kg/m2). T2 inflammation was highly prevalent: 60% had IgE ≥ 100 IU/mL, 70% had BEC ≥ 300 cells/μL, and 43.8% had FeNO ≥ 25 ppb, with allergic rhinitis present in 71.6%. Airflow limitation was frequent, as 71% had FEV1 < 80% predicted and 86.4% lacked bronchodilator reversibility. Clustering identified four endotypes: mixed allergic-eosinophilic T2-high (35.5%), eosinophilic T2-high (24.5%), allergic T2-high (20%), and T2-low (20%). T2-high clusters showed marked female predominance and greater lung function impairment, particularly in the eosinophilic group (81.5% with FEV1 < 80%). Allergic T2-high patients had the earliest onset, whereas T2-low patients demonstrated minimal biomarker elevation and fewer allergic comorbidities. BEC correlated with IgE (r=0.29) and FeNO (r=0.43), and multivariable analysis linked biomarkers to specific clinical features.
Conclusion: T2-high inflammation predominates in this cohort, comprising 80% of patients and segregating into clinically distinct allergic, eosinophilic, and mixed endotypes. Cluster-based stratification offers meaningful phenotyping that may support personalized biologic selection and precision management strategies.
Keywords: asthma, phenotypes, endotypes, T2 high inflammation, T2 low inflammation
Introduction
Asthma is a heterogeneous chronic airway disease marked by wide variation in symptoms, severity, and treatment response. This variability reflects a complex interaction of genetic predisposition, environmental exposures, and diverse immunological pathways.1 Symptoms such as wheeze, cough, dyspnea, and chest tightness often fluctuate over time and are triggered by allergens, infections, exercise, or irritants.2 The clinical spectrum ranges from mild disease controlled with minimal therapy to severe forms requiring intensive treatment, where airway remodeling, persistent inflammation, and distinct immune signatures contribute to differing trajectories.2,3 Notably, responses to standard therapies as inhaled corticosteroids vary considerably between individuals, underscoring the need for more refined, biologically informed classification systems that support precision medicine.4
Traditional approaches that classify asthma as mild, moderate, or severe, or divide it into allergic and non-allergic subtypes, offer only a partial view of this complexity. These schemes rely heavily on clinical symptoms and do not account for the underlying molecular drivers that shape disease expression, prognosis, and therapeutic response.5 Patients sharing the same clinical label may differ markedly in lung function, exacerbation burden, or biomarker profiles, leading to inconsistent outcomes.6,7 Advances in biomarker research have revealed multiple distinct inflammatory patterns, which most prominently Type 2 (T2)-high and T2-low pathways highlighting the limitations of conventional classification and the importance of integrating molecular, clinical, and environmental information to achieve meaningful patient stratification.8
Modern asthma taxonomy therefore distinguishes phenotypes from endotypes.9 Phenotypes describe observable disease patterns such as early- vs late-onset asthma, obesity-related asthma, or asthma with comorbid allergic rhinitis or chronic rhinosinusitis with nasal polyps, without explaining their biological basis.9 These clinical patterns are useful for anticipating disease courses and guiding initial management, but they often overlap and may shift over time.5 Endotypes, in contrast, refer to subtypes defined by specific biological mechanisms. Identifying endotypes clarifies why patients with similar symptoms respond differently to treatment and allows clinicians to match therapies to the dominant underlying pathway.5,9,10
Among known endotypes, T2 inflammation is the most common and the most therapeutically relevant.11 It is driven primarily by the cytokines IL-4, IL-5, and IL-13, which coordinate IgE production, eosinophil development, mucus hypersecretion, and nitric oxide expression.10,11 These pathways give rise to measurable biomarkers, including BEC, total IgE, and FeNO, which are widely used to reflect underlying inflammatory activity and to guide targeted biologic therapies directed against IgE, IL-5, or the IL-4/IL-13 receptor axis.10–12 The degree and pattern of T2 inflammation vary considerably between patients, emphasizing the importance of biomarker-based stratification to support precision medicine approaches in asthma diagnosis and management.12 Several studies have investigated asthma endotypes using combinations of clinical features and inflammatory biomarkers. BEC, IgE, and FeNO represent the most extensively studied T2 biomarkers and have been used either individually or in combination to identify T2-high asthma and to inform treatment selection.11,12 Cluster-based analyses and large cohort studies have consistently identified eosinophilic, allergic, and mixed inflammatory patterns; however, these studies differ substantially in design, biomarker thresholds, and population characteristics.13 In addition, many prior investigations have focused on selected severe asthma populations or relied on predefined phenotypic classifications, limiting the generalizability and clinical applicability of their findings in broader, real-world settings.10,13 Analytical approaches capable of integrating diverse clinical and biological data are therefore essential for capturing asthma’s multidimensional heterogeneity.13 Cluster analysis provides a robust data-driven method to identify patient subgroups based on shared patterns across symptoms, physiology, and biomarkers, offering insights into underlying disease mechanisms beyond conventional classifications.13,14 While previous studies have demonstrated the utility of clustering in asthma phenotyping,15,16 biomarker-driven endotype definitions remain inconsistent, particularly when applied to routinely available clinical biomarkers. The novelty of the present study lies in applying unsupervised clustering based exclusively on standardized, routinely accessible Type-2 biomarkers (BEC, total IgE, and FeNO) to define clinically relevant endotypes within a real-world asthma cohort, and in systematically evaluating their associations with demographic, clinical, and functional characteristics. Accordingly, this study aimed to characterize asthma heterogeneity through integrated clinical and biomarker profiling and to identify distinct endotypes with potential implications for precision management.
Methods
Patients and Study Design
A cross-sectional study was conducted involving 162 patients with a confirmed diagnosis of asthma based on GINA criteria. Asthma is defined by recurrent episodes of wheezing, shortness of breath, chest tightness, and cough that fluctuate over time, together with variable expiratory airflow limitations demonstrated by objective testing. Diagnosis requires both clinical assessment and documented evidence of airflow variability.17 Asthma severity was defined in accordance with GINA recommendations, integrating both treatment requirements and level of clinical control. Severity was determined retrospectively based on the minimum treatment step required to achieve and maintain control. Accordingly, mild asthma was defined as disease controlled with Step 1–2 therapy, moderate asthma with Step 3 therapy, and severe asthma as requiring Step 4–5 therapy or remaining uncontrolled despite high-intensity treatment.17
Patients were consecutively recruited from the asthma outpatient clinic between May 2024 and September 2025. Individuals presenting with acute asthma exacerbation requiring hospital or ICU admission were excluded. Additional exclusions included patients with a current or previous smoking history to avoid confounding effects on airway inflammation and lung function.
Sample Size Calculation
The sample size was calculated using a single proportion formula based on an expected asthma prevalence of 13% (within the reported range of 11–15%),18 with a 95% confidence level (Z = 1.96) and a precision (margin of error) of 5%. The minimum required sample size was estimated to be 138 participants. The calculation was performed using Minitab version 17.1.0.0 (Minitab Inc., Pennsylvania, USA).
Ethics Approval and Consent to Participate
The study received approval from the UAE Department of Health Ethics Committee (approval no: AKH/2024003) and was conducted in accordance with local regulations and the Declaration of Helsinki. Written informed consent was obtained from all adult participants prior to enrollment. For participants younger than 18 years, written informed consent was obtained from their parents or legal guardians, with assent obtained from the participants themselves when applicable. Participation was voluntary, and all participants or their guardians were fully informed about the study objectives and procedures.
Data Collection and Study End Point
Baseline demographic and clinical information was obtained from patients’ medical records. All biomarker measurements were obtained at baseline during the initial clinical evaluation, prior to measurements or escalation of controller therapy. Patients were clinically stable at the time of assessment, and none were experiencing acute exacerbation. All enrolled participants underwent a standardized set of assessments, including:
- Spirometry was performed in accordance with standard guidelines. Bronchodilator response was assessed as an increase in FEV1 of ≥12% and ≥200 mL following administration of a short-acting bronchodilator. Bronchodilator reversibility was evaluated as a functional parameter at the time of study assessment and was not used as a diagnostic criterion, as all patients had a previously established diagnosis of asthma based on GINA-defined evidence of variable airflow limitation. Patients were classified based on FEV1 % predicted: normal airway function if FEV1 ≥ 80% predicted, and reduced airway function if FEV1 < 80% predicted.17
- Skin prick testing was conducted on the volar forearm using standardized aeroallergen extracts. Histamine and normal saline served as positive and negative controls, respectively. Each allergen was applied with a sterile lancet, ensuring adequate spacing between sites. Reactions were assessed after 15–20 minutes, with a wheal ≥3 mm larger than the negative control considered positive.19
- Complete blood count (CBC) with measurement of blood eosinophils, later categorized into: High eosinophils: ≥300 cells/μL, and low eosinophils: <300 cells/μL.20
- Total serum IgE, classified as: Normal: <100 IU/mL, and elevated: >100 IU/mL.21
- Fractional exhaled nitric oxide (FeNO) as a marker of Type 2 airway inflammation, grouped as: High FeNO: >25 ppb, and Low FeNO: ≤25 ppb.22
These clinical and biomarker variables were used to characterize patient profiles and to support subsequent clustering analyses, which served as the primary endpoint of the study. The clustering approach identified four distinct inflammatory profiles: Cluster 1 represented a T2-high phenotype with a mixed allergic and eosinophilic pattern; Cluster 2 was characterized by a predominantly allergic T2-high profile; Cluster 3 reflected a predominantly eosinophilic T2-high pattern; and Cluster 4 corresponded to a T2-low inflammatory phenotype.
Statistical Analysis
Data were entered into Microsoft Excel and analyzed using Minitab version 17.1.0.0 (Minitab Inc., Pennsylvania, USA). The Shapiro–Wilk test was applied to assess the normality of continuous variables. Cluster analysis was performed using PCORD version 5 (MjM Software Design, Oregon, USA). The clustering pipeline was based on three key Type-2 inflammatory biomarkers: blood eosinophil count, total serum IgE, and fractional exhaled nitric oxide (FeNO). Continuous biomarker values were used for clustering after appropriate scaling to ensure comparability across variables with different units and ranges. A hierarchical agglomerative clustering approach was applied using the Sorensen (Bray–Curtis) similarity measure, with average linkage and the flexible beta method (β = −0.25). A two-way cluster dendrogram was generated to simultaneously visualize relationships between patients and biomarkers. The optimal number of clusters was determined through visual inspection of the dendrogram structure, considering cluster separation, internal homogeneity, and clinical interpretability. Clusters were subsequently characterized and labeled based on dominant biomarker expression patterns, resulting in four distinct groups representing different Type-2 inflammatory endotypes. Comparisons between categorical groups were conducted using the Chi-square test, while differences in medians were assessed using the Kruskal–Wallis test. Linear correlations between Type-2 inflammation biomarkers were evaluated using the Pearson correlation coefficient, with the sign of r indicating the direction of the relationship. Where appropriate, log-transformation was explored to confirm the robustness of observed associations. Multivariable general linear models were used to evaluate factors influencing biomarker levels. Key confounders, including age, sex and BMI were included as fixed covariates in all models and were not subject to elimination. Additional variables were entered using a backward elimination approach to identify significant predictors. All statistical tests were two-tailed, and a p-value ≤ 0.05 was considered statistically significant.
Results
Basic Character of Asthma Patients
Table 1 shows a cohort of asthma patients with a clearly defined profile characterized by chronic, often severe, Type-2–high inflammation and a substantial comorbidity burden. The population is predominantly adult (82.72% >18 years), with a subset of late adolescent participants (15–18 years), and a median age of 39 years, and shows a marked female predominance (69.14%, n=112), consistent with patterns of higher asthma prevalence and severity in adult women. Patients are generally overweight, with a median BMI of 29.15 kg/m2, and nearly half (46.3%) fall within the obese range (BMI ≥ 30 kg/m2), reflecting an obesity-related phenotype that complicates disease control. Chronic conditions such as hypertension (16.67%) and diabetes (14.81%) are common, and the median asthma duration is long at 21.5 years, with 81.48% having childhood-onset disease (median onset age 12), underscoring early-life or genetic drivers.
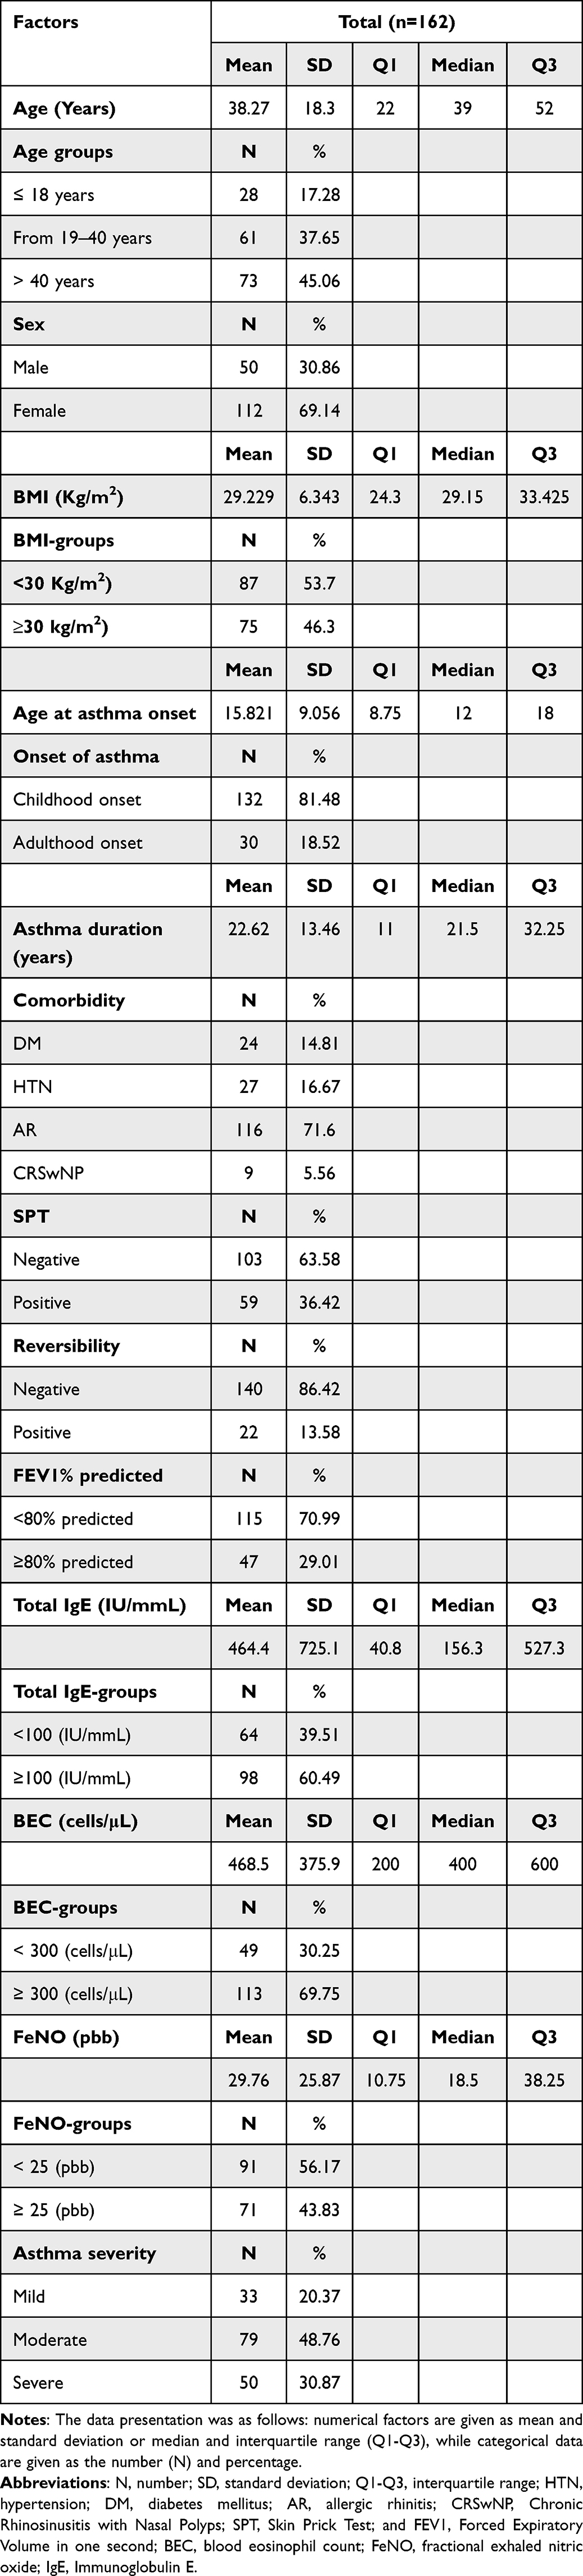 |
Table 1 Baseline Demographic and Clinical Characteristics of the Study Population |
Markers of Type-2 inflammation are strikingly elevated: total IgE shows a high median level (156.3 IU/mL) with a markedly skewed distribution, and more than 60% meet the ≥100 IU/mL threshold associated with T2-high disease and biologic eligibility. Blood eosinophils are similarly raised, with a median of 400 cells/μL and nearly 70% reaching ≥300 cells/μL, reinforcing a dominant eosinophilic phenotype, while FeNO levels (median 18.5 ppb) show elevated values in 43.83% of the cohort (≥25 ppb), further indicating active Type-2 airway inflammation. Allergic features are prominent, with allergic rhinitis present in 71.6% and positive skin-prick testing in 36.42%, though CRSwNP is relatively infrequent at 5.56%. Lung function is substantially impaired, as 70.99% demonstrate FEV1 < 80% predicted, and reversibility is absent in 86.42% of patients, suggesting largely fixed airflow obstruction consistent with long-standing, poorly controlled, or severe asthma. Additionally, the prospective asthma severity distribution in the study population demonstrated that moderate asthma was the most prevalent category, accounting for 48.8% of patients, followed by severe asthma in 30.9%, while mild asthma represented the smallest proportion at 20.4%. This distribution indicates a predominance of patients with clinically significant disease will requiring at least Step 3 therapy or higher, reflecting a cohort enriched with moderate-to-severe asthma.
Phenotypes Clusters of Asthma Patients
Hierarchical cluster analysis (Figure 1) identified five distinct patient groups, organized into three main clusters and two smaller subclusters based on similarities in clinical and biomarker profiles. The first major cluster corresponded to a T2-high allergic phenotype, characterized by consistently elevated total IgE, BEC, and FeNO levels, along with a higher frequency of positive SPT and AR. A second cluster represented a T2-high non-allergic eosinophilic phenotype, defined by elevated BEC and FeNO in the absence of marked IgE elevation or allergic sensitization. In contrast, a third cluster demonstrated features of a T2-low phenotype, with generally low levels of IgE, BEC, and FeNO. This group showed a higher proportion of female patients and increased BMI values. Among the smaller clusters, one group was characterized by persistent airflow limitation, with reduced FEV1% predicted and limited bronchodilator reversibility, while another represented a low-inflammatory, mild phenotype, with minimal expression of inflammatory biomarkers and generally preserved lung function.
 |
Figure 1 Asthma Phenotypes and Endotypes Identified by Unsupervised Clustering. Two-way hierarchical clustering of patients (columns) and clinical variables (rows) is shown. Color intensity reflects the relative magnitude or presence of each variable (red indicates higher values or presence; white indicates lower values or absence). Clusters were defined based on patterns of Type-2 inflammatory biomarkers (total IgE, blood eosinophil count, and FeNO), lung function parameters, and clinical characteristics. T2-high phenotypes were identified by elevated eosinophils and/or FeNO with or without increased IgE, whereas T2-low phenotypes showed low levels across these biomarkers. The color intensity within the heatmap indicates the magnitude or presence of the variable (e.g., darker shades denote higher values for biomarkers or the presence of a comorbidity). Abbreviations: 1, Male; 2, Female; DM, Diabetes Mellitus; HTN, Hypertension; AR, Allergic Rhinitis; CRSwNP, Chronic Rhinosinusitis with Nasal Polyps; Revir, Reversibility of Spirometry. |
Biomarker Defined Asthma Cluster (Endotypes)
The pie chart (Figure 2) reveals that T2-high inflammation is the predominant phenotype in this asthma cohort, accounting for 80.0% of the patient population, which strongly suggests that the majority of these individuals could be candidates for T2-targeted biologic therapies. The largest single group is Cluster 1 (35.5%), characterized by a mixed allergic and eosinophilic T2-high pattern, while Cluster 3 (24.5%) exhibits a purely eosinophilic T2-high pattern, and Cluster 2 (20.0%) shows a primarily allergic T2-high pattern, highlighting the clinical heterogeneity within T2 asthma. Conversely, Cluster 4 (20.0%) is defined by a T2-low status, representing a significant subgroup of asthma patients whose underlying inflammation is non-T2 mediated, making them less responsive to standard T2 treatments and necessitating alternative therapeutic strategies focused on non-Type 2 pathways.
 |
Figure 2 The frequency of T-2 inflammation cluster. Cluster 1 was T2-high with a mixed allergic and eosinophilic pattern; Cluster 2 was T2-high with a dominant allergic pattern; Cluster 3 was T2-high with a dominant eosinophilic pattern; and Cluster 4 represented T2-low inflammation. |
In Table 2, the demographic and clinical characteristics of these endotype clusters showed significant demographic and clinical associations driven by underlying inflammatory mechanisms. The most significant finding is the pronounced female predominance (P=0.01) in the T2-high groups, particularly the eosinophilic (Cluster 3: 88.89% female) and mixed (Cluster 1: 74.36% female) phenotypes, and also in the T2-low group (Cluster 4: 90.91% female), whereas the allergic T2-high group (Cluster 2) shows a more balanced sex distribution. The onset of asthma also differs significantly (P=0.04), with Cluster 2 (allergic T2-high) showing the earliest median onset age (11.5 years) and the highest rate of childhood onset (95.45%), suggesting a strong link between early-life atopy and this particular phenotype. Lung function impairment, indicated by an FEV1 <80% predicted, is most severe in the eosinophilic (Cluster 3: 81.48%) and mixed (Cluster 1: 76.92%) T2-high groups (P=0.05), while the allergic T2-high group (Cluster 2) maintains the highest rate of preserved lung function (≥80% predicted FEV1 at 50%), which highlights the negative impact of eosinophilic inflammation on lung mechanics. Furthermore, the presence of Allergic Rhinitis (AR) is significantly differentiated (P=0.01), being highly prevalent in the T2-high clusters (Cluster 3 at 85.19% and Cluster 1 at 76.92%) but markedly lower in the T2-low Cluster 4 (45.45%), which reinforces the T2-driven nature of common allergic comorbidities. Variables such as age, BMI, and asthma duration, conversely, do not significantly differentiate the clusters, as well as the asthma severity groups, indicating that the observed clinical heterogeneity is primarily rooted in the specific biomarker-defined inflammatory endotypes rather than broad demographic features.
 |
Table 2 Asthma Endotypes and Correlation with Basic Characters |
Factors Influencing the T2-Inflammation Biomarkers
Figure 3 presents two scatter plots showing how BEC relates to two major Type-2 inflammatory markers: total IgE and FeNO. Both relationships are statistically significant and point toward a shared T2-high inflammatory pattern in the asthma cohort. The upper plot shows a weak-to-moderate positive correlation between IgE and BEC (r=0.29, p<0.001), indicating that higher eosinophil levels tend to accompany higher IgE, though the modest strength of the association reflects the influence of additional allergic and non-allergic pathways. The lower plot shows a stronger correlation between FeNO and BEC (r=0.43, p<0.001), suggesting a tighter link between systemic eosinophilia and airway inflammation.
 |
Figure 3 Correlation between BEC and Total IgE and FeNO in asthma patients. The test of significance: Pearson correlation coefficient, the sign before r denote the direction of relationship, p< 0.05 considered significant. Abbreviations: BEC, blood eosinophil count; FeNO, fractional exhaled nitric oxide; IgE, Immunoglobulin E. |
Moreover, Table 3 described the relationship between Type-2 inflammatory biomarkers and asthma severity categories. BEC demonstrated a statistically significant increase across severity groups (p = 0.01), with the highest median values observed in patients with severe asthma, indicating a greater eosinophilic inflammatory burden in this subgroup. In contrast, total IgE and FeNO levels did not differ significantly across severity categories (p = 0.25 and p = 0.16, respectively), although a trend toward higher median values was observed in patients with severe diseases. These findings suggest that eosinophilic inflammation may be more closely associated with asthma severity than other Type-2 biomarkers within this cohort, which highlights the potential role of BEC as a more sensitive indicator of disease severity, whereas total IgE and FeNO may reflect broader Type-2 inflammatory activity without directly correlating with severity stratification.
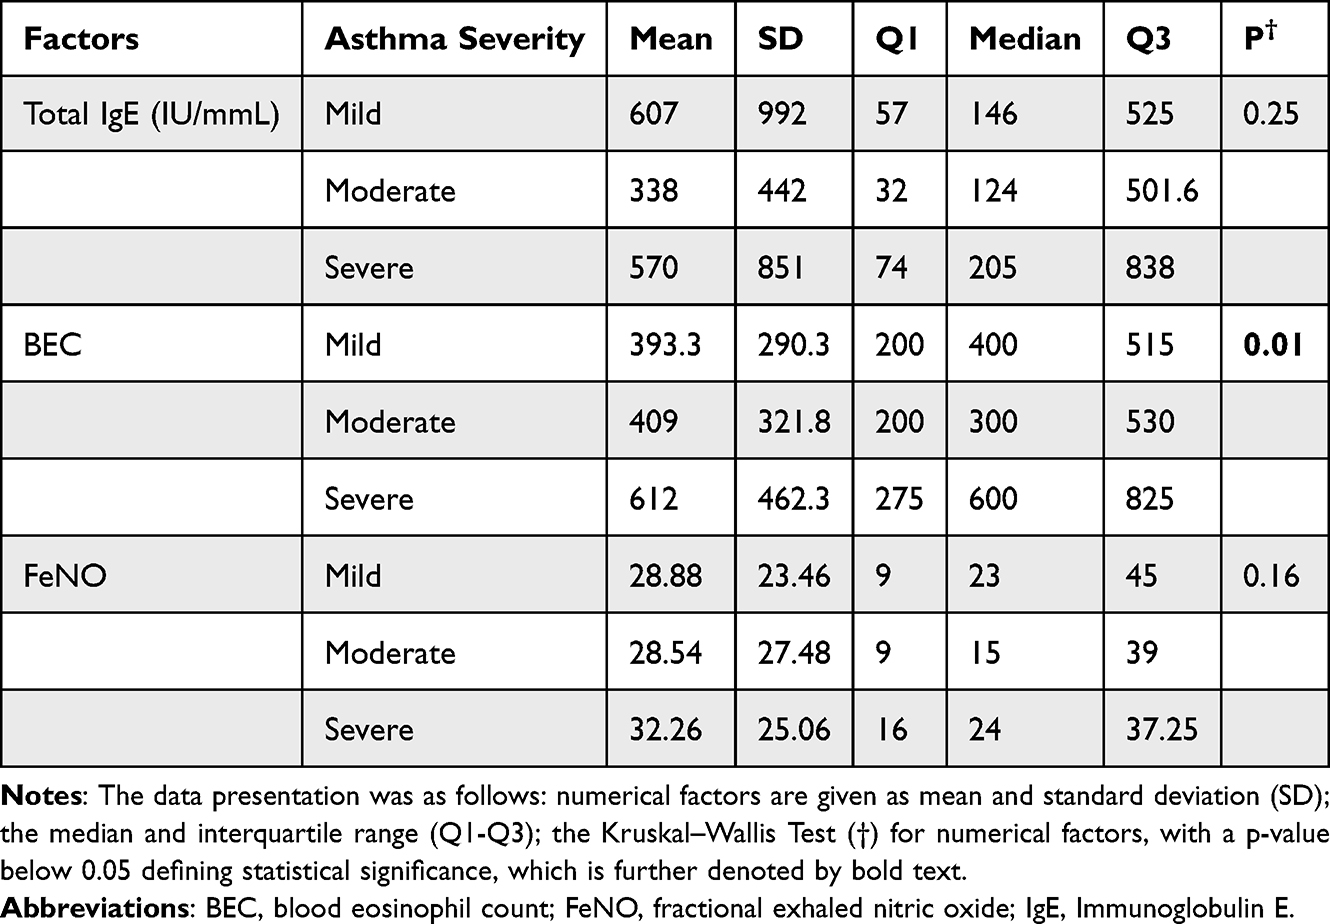 |
Table 3 Correlation Between Asthma Severity and Type 2 Inflammatory Marker in Asthmatic Patients |
Furthermore, as shown in Table 4, the GLM analysis identifies specific factors influencing the three main T2 biomarkers. For Total IgE, hypertension is the only significant predictor (CE = –184.80, p = 0.02), indicating that patients without HTN have markedly lower IgE than those with HTN, while male sex (CE = 324.20, p = 0.09) and FEV1 ≥ 80% (CE = 309.80, p = 0.09) show positive but non-significant trends. BEC is significantly shaped by asthma duration (CE = 5.41, p = 0.02), showing a steady rise in eosinophils with longer disease, and by diabetes status, where patients without DM show higher eosinophil counts (CE = 103.60, p = 0.04). A borderline association appears for non-reversibility (CE = –76.80, p = 0.07), suggesting that fixed obstruction may be linked to lower systemic eosinophilia. FeNO is most strongly influenced by allergic rhinitis, where absence of AR sharply reduces FeNO (CE = –8.68, p < 0.001). Male sex also predicts lower FeNO (CE = –4.54, p = 0.03), and non-reversibility further decreases it (CE = –6.02, p = 0.04). Overall, the model shows that IgE is unexpectedly higher in patients with HTN, BEC rises with disease chronicity and absence of DM, and FeNO is dominantly driven by AR, while fixed obstruction consistently aligns with lower T2 biomarkers, suggesting a more remodeled and less eosinophilic severe asthma phenotype.
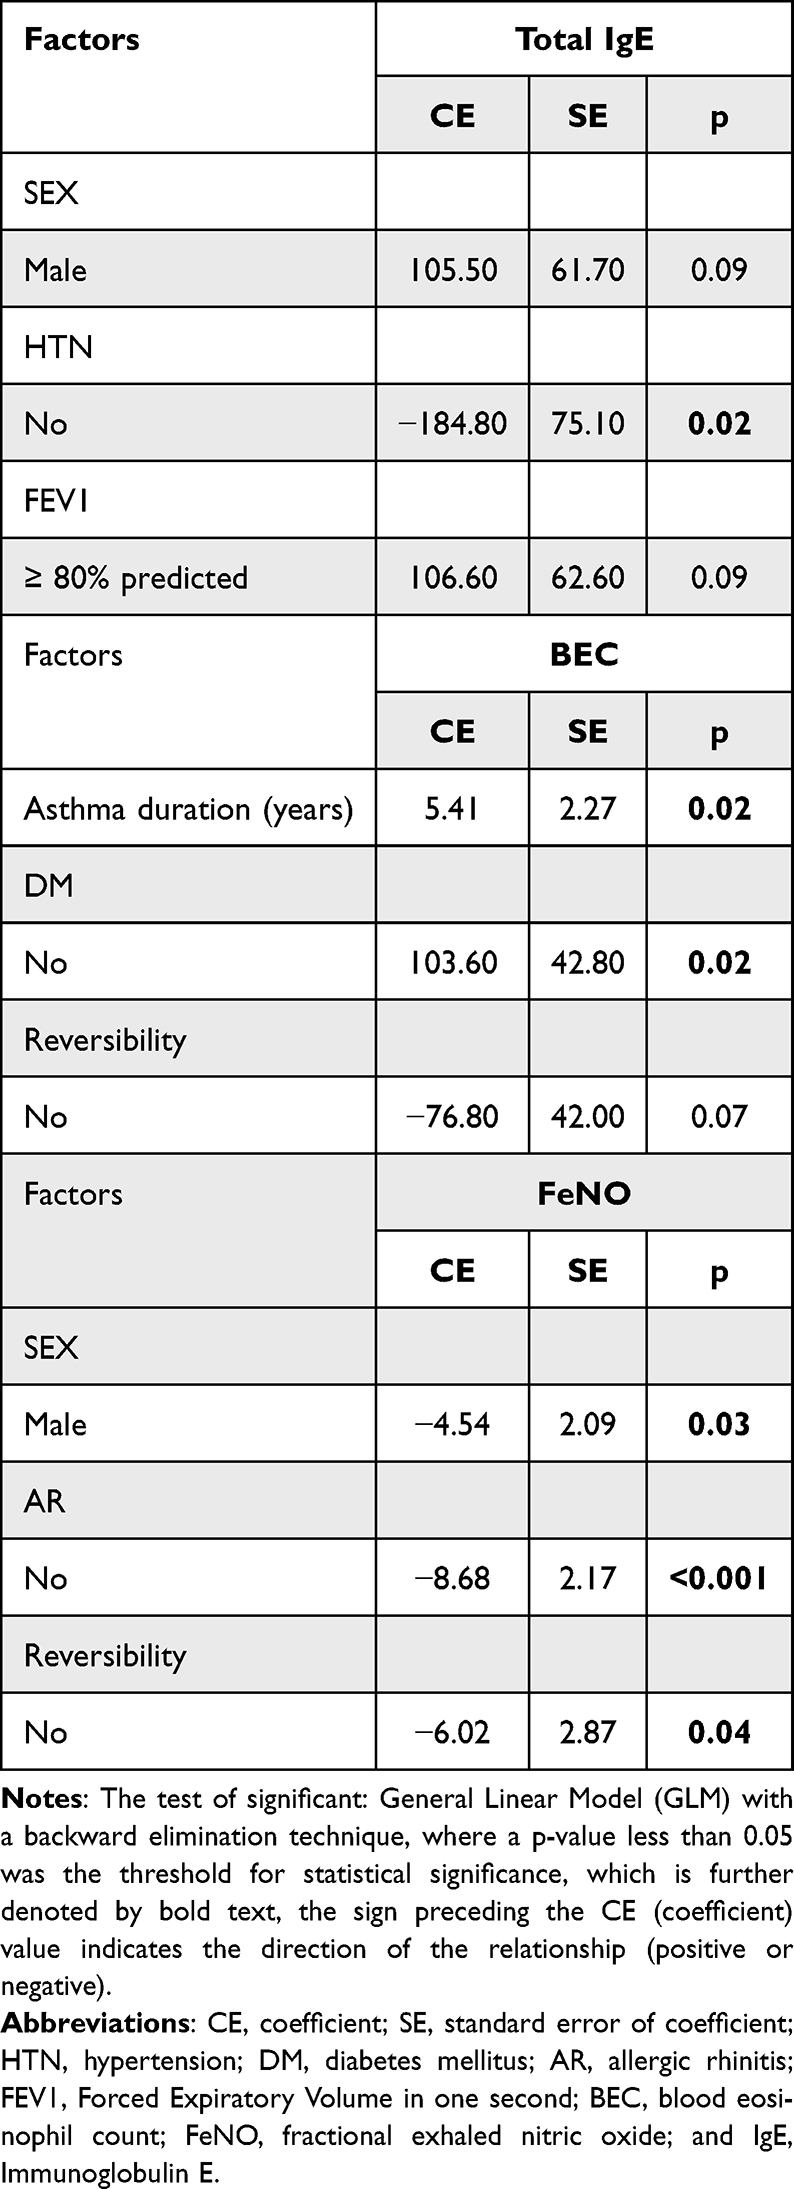 |
Table 4 Factors Influencing the Level of Asthma Biomarkers |
Discussion
Asthma is no longer viewed as a single disease but as a broad, heterogeneous syndrome defined by diverse clinical phenotypes and underlying biological endotypes. These range from early-onset allergic and late-onset eosinophilic asthma to obesity-related and AERD phenotypes.23 On a mechanistic level, asthma is broadly divided into T2-high disease that driven by IL-4/IL-5/IL-13 and typically eosinophilic, and T2-low disease, often neutrophilic and less responsive to standard therapies.24 Sputum patterns further classify inflammation into eosinophilic, neutrophilic, mixed, or paucigranulocytic forms.25 Recognizing these distinctions underpins the treatable-traits model, allowing therapy to target specific biological pathways and enabling biomarker-guided precision treatment, particularly in severe asthma managed with biologics.23,24 In this study our asthmatic patients represent a severe, highly inflamed asthma phenotype with significant comorbidities and persistent functional impairment. Patients were predominantly adult, female, overweight population with long-standing asthma and a heavy burden of Type-2–high inflammation. Most patients show elevated IgE, eosinophils, and FeNO, together indicating a strong eosinophilic allergic profile, while comorbid obesity, hypertension, and diabetes add further complexity. Childhood-onset disease is common, and lung function is widely impaired, with most patients demonstrating FEV1 <80% and little bronchodilator reversibility, pointing toward chronic, fixed airway obstruction. Asthma care in the Gulf region faces challenges due to limited local data and inconsistent use of objective biomarkers. However, a multicenter study on severe asthma patients across four Gulf countries suggests a predominantly eosinophilic phenotype, as elevated eosinophil counts were common.26 Despite this, the utilization of other key biomarkers like IgE and FeNO remains irregular.26 Furthermore, obesity is highly prevalent, significantly worsening asthma severity and outcomes.27 This obesity-related asthma phenotype contributes to disease complexity through increased airway inflammation, metabolic dysfunction, and common comorbidities such as hypertension and diabetes.27 In the current cluster analysis asthma cohort separated into five biologically distinct phenotypes. Most patients fall within a dominant T2-high eosinophilic/allergic group suited for biologic therapy, while an obese, female-predominant T2-low group represents a non-inflammatory, harder-to-treat phenotype. Additional smaller clusters reflect non-allergic eosinophilic disease, fixed-obstruction remodeling, and mild low-inflammation asthma. Although the cohort demonstrated marked functional impairment, cluster analysis provided additional insight by separating patients into biologically distinct groups with different clinical burdens. Notably, the T2-low cluster also showed substantial airflow limitation, with 68.18% of patients having FEV1 <80% predicted, indicating that absence of T2-high biomarkers does not necessarily imply mild disease. This supports the value of cluster analysis in identifying a clinically important non-T2 subgroup with preserved diagnostic relevance for treatment stratification and prognostic assessment. These findings reinforce asthma as a multi-phenotype syndrome that demands tailored, phenotype-specific management. Previous asthma clustering studies have established the existence of clinically meaningful phenotypes, including stable severe asthma phenotypes and broader phenotype-based subgrouping.15,16 However, the present study extends this literature by using an unsupervised, biomarker-centered approach based on routinely available Type-2 inflammatory markers to define endotypes in a real-world asthma cohort. Our analysis not only confirms the predominance of T2-high inflammation but also demonstrates that T2-high asthma comprises distinct allergic, eosinophilic, and mixed allergic-eosinophilic patterns with different clinical correlations. The observed associations with sex, age of onset, allergic rhinitis, airflow limitation, and biomarker correlations support the translational value of this endotype framework and suggest potential utility for biologic selection and precision asthma management. A supportive regional asthma reports from the Gulf emphasizing that severe adult asthma patients were consistency female with long disease duration, and frequent comorbidities such as obesity and hypertension.28 Overweight and obesity are highly prevalent among adults in the UAE, reflecting a substantial regional cardiometabolic burden that may contribute to asthma heterogeneity, symptom severity, and functional impairment. So, the elevated BMI observed in our cohort is clinically meaningful and likely represents an important modifier of asthma phenotype. This is supported by regional data reporting that approximately 67.5% of patients with asthma are overweight or obese,29 as well as large Middle Eastern analyses identifying obesity as a common comorbidity in severe asthma populations.28 Together, these findings underscore the clinical relevance of obesity in shaping asthma expression within this region. Furthermore, other studies specifically describe the persistence of childhood-onset allergic asthma into adulthood, characterized by key pathological features: airway eosinophilia and fixed airflow obstruction with reduced bronchodilator reversibility,30 reflecting the widespread challenge of long-standing disease and functional impairment in the region. In our cohort, T2-high inflammation dominated overwhelmingly (80%), distributed across mixed allergic/eosinophilic, purely eosinophilic, and primarily allergic patterns that indicating broad eligibility for T2-targeted biologics. This proportion far exceeds the global estimate for severe asthma, where T2-high disease typically accounts for 35–50%,31,32 though regional data from the Gulf and Middle East report somewhat higher rates of 50–70%.33 The exceptionally elevated prevalence in our population may reflect regional drivers such as high allergic sensitization in UAE communities, environmental exposures like dust and pollution, genetic susceptibility, obesity-related inflammation, and referral bias toward more severe, eosinophilic cases in secondary and tertiary centers. Additionally, the separation of allergic, eosinophilic, and mixed T2-high asthma shows that T2-high disease is not a single entity but a set of distinct inflammatory endotypes. The allergic group is marked by early onset, sensitization, high IgE, and atopy-related comorbidities, making it well suited for anti-IgE therapy. The eosinophilic group shows strong airway and blood eosinophilia, adult onset, greater severity, and fixed obstruction, aligning it with IL-5 and IL-4R–targeted biologics. The mixed endotype blends both pathways and often presents with more complex, severe disease.
In our cohort, a smaller but clinically important T2-low group (20%) underscores the need for non–T2-targeted therapies, consistent with regional studies reporting 15–25% T2-low asthma in the Gulf33 and global estimates of 20–50%, depending on biomarker definitions and populations.34 Variability arises from differences in defining T2-low (absence of eosinophils or FeNO), corticosteroid use, environmental exposures, and genetic factors.33,34 The female predominance, including within the T2-low subgroup, reflects well-established sex differences in asthma prevalence and severity.35 Adult women experience higher asthma rates and more severe disease due to hormonal influences, genetic and epigenetic factors, and sex-specific immune responses, including type 1 inflammation relevant to T2-low asthma.36 Hormonal fluctuations across menstrual cycles, pregnancy, and menopause further modulate airway inflammation and hyperresponsiveness.36,37 Women also frequently have comorbidities such as obesity and GERD that worsen asthma independently of T2 inflammation and may reduce responsiveness to standard T2-targeted therapies.35 T2-low asthma is typically non-eosinophilic, often neutrophilic or paucigranulocytic, and is associated with obesity, smoking, late-onset disease, and pollutant exposure, contributing to persistent symptoms and exacerbations.34 Management relies on non–T2-targeted strategies, including low-dose macrolides (eg., azithromycin), bronchial thermoplasty for refractory cases, emerging therapies targeting IL-17, IL-1, CXCR2, or epithelial cytokines, and careful optimization of comorbidities.34,38
In this study, systemic and airway T2 biomarkers are interrelated yet shaped by distinct clinical factors. Blood eosinophils correlate moderately with IgE and more strongly with FeNO, reflecting a dominant T2-high inflammatory endotype. The strong eosinophil–FeNO relationship indicates that both reliably track active airway eosinophilic inflammation and identify patients at higher risk of exacerbations, whereas the moderate IgE–eosinophil correlation suggests that IgE primarily reflects long-term allergic sensitization rather than current inflammatory activity.39–41 These findings support a comprehensive, biomarker-driven approach to T2-targeted therapy, emphasizing the use of multiple markers rather than any single one to guide treatment with inhaled corticosteroids and biologics.
For systemic correlation, we reported that IgE levels are higher in patients with hypertension, which likely reflect active immune-mediated vascular inflammation rather than a bystander effect. IgE, via FcεR1 on mast cells, promotes cytokine release, oxidative stress, endothelial dysfunction, and vascular remodeling, contributing to hypertension.42,43 Clinical and experimental studies support this link, showing correlations between high IgE and increased blood pressure, while IgE blockade improves vascular outcomes.43 These findings highlight the intersection of allergic and cardiovascular pathways and suggest that targeting IgE may benefit patients with coexisting asthma and hypertension.
On the other hand, our data showed that BEC increases with longer asthma duration and absence of diabetes thus reflecting progressive Type-2–driven airway inflammation, eosinophil recruitment, and airway remodeling, which contribute to fixed airflow obstruction and higher exacerbation risk.44,45 Conversely, lower BEC in patients with diabetes likely reflects metabolic and immune alterations that suppress eosinophilic pathways or shift inflammation toward non-T2 phenotypes.44–46 These findings suggest that disease chronicity elevates eosinophilic inflammation, while metabolic comorbidities like diabetes can modulate asthma inflammatory profiles and biomarker expression.
Our data also showed that FeNO is strongly influenced by allergic rhinitis, consistent with the unified airway concept, where eosinophilic inflammation in the nasal mucosa drives IL-4 and IL-13–mediated upregulation of nitric oxide synthase in airway epithelial cells, leading to higher FeNO levels.47 Conversely, FeNO was lower in males and in patients with fixed airflow obstruction. Reduced FeNO in males likely reflects sex-related differences in airway biology, hormonal influences, and NO synthase activity, as well as anatomical factors affecting NO diffusion.48 In patients with fixed obstruction, chronic airway remodeling and fibrosis diminish active eosinophilic inflammation and epithelial NO production, indicating a shift toward structural airway disease rather than ongoing T2 inflammation.40,49,50
Strength and Limitation
The primary strength of this study lies in its comprehensive cross-sectional assessment of multiple T2 biomarkers (blood eosinophils, IgE, FeNO) and clinical data, which enabled strong hierarchical clustering and effective delineation of T2-high and T2-low asthma endotypes. However, key limitations exist: the cross-sectional design prevents longitudinal tracking and causal inference; single-center recruitment and the exclusion of smokers or patients during acute exacerbations limit the generalizability to broader populations. Furthermore, the reliance on only three T2 biomarkers and potential referral bias towards severe cases may inflate the reported T2-high prevalence. In addition, although adolescents constituted a minority of the cohort, their inclusion may introduce age-related variability in biomarker expression, which cannot be entirely excluded. Crucially, the lack of treatment outcome data restricts the translational application of the identified clusters.
Conclusion
Asthma in this UAE cohort is biologically heterogeneous, with most patients exhibiting T2–high inflammation further stratified into mixed allergic–eosinophilic, eosinophilic, and allergic endotypes. Cluster analysis identified clinically meaningful differences in sex, age of onset, obesity, allergic comorbidity, and lung function across groups, supporting its value for endotype-based stratification and precision management. Routine assessment of accessible T-2 biomarkers, including blood eosinophil count, total IgE, and FeNO, may aid clinical classification and guide targeted therapy selection. The T2-low subgroup, although smaller, remains clinically relevant due to its distinct profile and functional impairment. Future studies should explore additional biomarkers, including cytokine profiles, periostin, and sputum inflammatory patterns, and assess the longitudinal implications of these endotypes for disease progression and treatment response.
Generative AI Declaration
During the preparation of this work, the authors used AI (GPT-5.2, OpenAI) for error checking only. After using this service, the authors reviewed and edited the content as needed and took full responsibility for the content of the publication.
Data Sharing Statement
The datasets used during the current study available from the corresponding author (Asmaa Ali) on reasonable request.
Ethics Approval and Consent to Participate
The study received approval from the UAE Department of Health Ethics Committee (approval no: AKH/2024003) and was conducted in accordance with local regulations and the Declaration of Helsinki. Written informed consent was obtained from all adult participants prior to enrollment. For participants younger than 18 years, written informed consent was obtained from their parents or legal guardians, with assent obtained from the participants themselves when applicable. Participation was voluntary, and all participants or their guardians were fully informed about the study objectives and procedures.
Acknowledgments
We sincerely thank the data entry team at Al-Ain Hospital for their invaluable support and dedication in facilitating this study. The abstract of this paper was presented at the 5th Allergy and clinical immunology conference Abu Dhabi February 2026 as a Poster abstract.
Author Contributions
All authors made a significant contribution to the work reported, whether that is in the conception, study design, execution, acquisition of data, analysis and interpretation, took part in drafting, revising the article; gave final approval of the version to be published; have agreed on the journal to which the article has been submitted; and agree to be accountable for all aspects of the work.
Funding
This research did not receive any specific grant from funding agencies in the public, commercial, or not-for-profit sectors.
Disclosure
All authors declare no conflicts of interest in this work.
References
1. Carr TF, Bleecker E. Asthma heterogeneity and severity. World Allergy Organ J. 2016;9(1):41. PMID: 27980705; PMCID: PMC5129643. doi:10.1186/s40413-016-0131-2
2. McCracken JL, Veeranki SP, Ameredes BT, Calhoun WJ. Diagnosis and management of asthma in adults: a review. JAMA. 2017;318(3):279–17. Erratum in: JAMA. 2017 Oct 24;318(16):1615. Dosage error in article text. PMID: 28719697. doi:10.1001/jama.2017.8372
3. Bell MC, Busse WW. Severe asthma: an expanding and mounting clinical challenge. J Allergy Clin Immunol Pract. 2013. 1(2):110–121. quiz 122. Epub 2013 Feb 26. PMID: 24565450; PMCID: PMC4880055. 10.1016/j.jaip.2013.01.005
4. Colas L, Hassoun D, Magnan A. Needs for systems approaches to better treat individuals with severe asthma: predicting phenotypes and responses to treatments. Front Med. 2020;7:98. PMID: 32296705; PMCID: PMC7137032. doi:10.3389/fmed.2020.00098
5. Kuruvilla ME, Lee FE, Lee GB. Understanding asthma phenotypes, endotypes, and mechanisms of disease. Clin Rev Allergy Immunol. 2019;56(2):219–233. PMID: 30206782; PMCID: PMC6411459. doi:10.1007/s12016-018-8712-1
6. Reddel HK, Vestbo J, Agustí A, et al. NOVELTY study investigators. Heterogeneity within and between physician-diagnosed asthma and/or COPD: NOVELTY cohort. Eur Respir J. 2021;58(3):2003927. PMID: 33632799; PMCID: PMC8459130. doi:10.1183/13993003.03927-2020
7. Deliu M, Yavuz TS, Sperrin M, et al. Features of asthma which provide meaningful insights for understanding the disease heterogeneity. Clin Exp Allergy. 2018;48(1):39–47. Epub 2017 Sep 15. PMID: 28833810; PMCID: PMC5763358. doi:10.1111/cea.13014
8. Lee Y, Quoc QL, Park HS. Biomarkers for severe asthma: lessons from longitudinal cohort studies. Allergy Asthma Immunol Res. 2021;13(3):375–389. PMID: 33733634; PMCID: PMC7984946. doi:10.4168/aair.2021.13.3.375
9. Chung KF, Dixey P, Abubakar-Waziri H, et al. Characteristics, phenotypes, mechanisms and management of severe asthma. Chin Med J. 2022;135(10):1141–1155. PMID: 35633594; PMCID: PMC9337252. doi:10.1097/CM9.0000000000001990
10. Xie C, Yang J, Gul A, et al. Immunologic aspects of asthma: from molecular mechanisms to disease pathophysiology and clinical translation. Front Immunol. 2024;15:1478624. PMID: 39439788; PMCID: PMC11494396. doi:10.3389/fimmu.2024.1478624
11. Fahy JV. Type 2 inflammation in asthma--present in most, absent in many. Nat Rev Immunol. 2015;15(1):57–65. PMID: 25534623; PMCID: PMC4390063. doi:10.1038/nri3786
12. Howell I, Howell A, Pavord ID. Type 2 inflammation and biological therapies in asthma: targeted medicine taking flight. J Exp Med. 2023;220(7):e20221212. Epub 2023 Jun 2. PMID: 37265457; PMCID: PMC10239209. doi:10.1084/jem.20221212
13. Haldar P, Pavord ID, Shaw DE, et al. Cluster analysis and clinical asthma phenotypes. Am J Respir Crit Care Med. 2008;178(3):218–224. Epub 2008 May 14. PMID: 18480428; PMCID: PMC3992366. doi:10.1164/rccm.200711-1754OC
14. Ross MK, Eckel SP, Bui AAT, Gilliland FD. Asthma clustering methods: a literature-informed application to the children’s health study data. J Asthma. 2022;59(7):1305–1318. Epub 2021 May 18. PMID: 33926348; PMCID: PMC8664642. doi:10.1080/02770903.2021.1923738
15. Loza MJ, Djukanovic R, Chung KF, et al. ADEPT (Airways disease endotyping for personalized therapeutics) and U-BIOPRED (Unbiased biomarkers for the prediction of respiratory disease outcome consortium) investigators. Validated and longitudinally stable asthma phenotypes based on cluster analysis of the ADEPT study. Respir Res. 2016;17(1):165. PMID: 27978840; PMCID: PMC5159977. doi:10.1186/s12931-016-0482-9
16. Fitzpatrick AM, Moore WC. Severe asthma phenotypes - how should they guide evaluation and treatment? J Allergy Clin Immunol Pract. 2017;5(4):901–908. PMID: 28689840; PMCID: PMC5541906. doi:10.1016/j.jaip.2017.05.015
17. Global Initiative for Asthma. Global strategy for asthma management and prevention, 2024 update. 2024 [Cited November 20, 2025]. Available from: https://ginasthma.org/2024-report/.
18. Ibrahim NM, Almarzouqi FI, Al Melaih FA, Farouk H, Alsayed M, AlJassim FM. Prevalence of asthma and allergies among children in the United Arab Emirates: a cross-sectional study. World Allergy Organ J. 2021;14(10):100588. PMID: 34703522; PMCID: PMC8503660. doi:10.1016/j.waojou.2021.100588
19. Kulalert P, Poachanukoon O, Nanthapisal S, et al. Minimum number and types of allergens for a skin prick test panel in Thai children with allergic respiratory diseases. Allergy Asthma Clin Immunol. 2022;18(1):77. PMID: 36002873; PMCID: PMC9404556. doi:10.1186/s13223-022-00718-7
20. Kostikas K, Brindicci C, Patalano F. Blood eosinophils as biomarkers to drive treatment choices in asthma and COPD. Curr Drug Targets. 2018;19(16):1882–1896. PMID: 29437007; PMCID: PMC6225326. doi:10.2174/1389450119666180212120012
21. Guida G, Bertolini F, Carriero V, et al. Reliability of total serum IgE levels to define type 2 high and low asthma phenotypes. J Clin Med. 2023;12(17):5447. PMID: 37685515; PMCID: PMC10488214. doi:10.3390/jcm12175447
22. Khatri SB, Iaccarino JM, Barochia A, et al. American thoracic society assembly on allergy, immunology, and inflammation. use of fractional exhaled nitric oxide to guide the treatment of asthma: an official American thoracic society clinical practice guideline. Am J Respir Crit Care Med. 2021;204(10):e97–e109. PMID: 34779751; PMCID: PMC8759314. doi:10.1164/rccm.202109-2093ST
23. Taunk ST, Cardet JC, Ledford DK. Clinical implications of asthma endotypes and phenotypes. Allergy Asthma Proc. 2022;43(5):375–382. PMID: 36065106; PMCID: PMC10326743. doi:10.2500/aap.2022.43.220047
24. Gonzalez-Uribe V, Romero-Tapia SJ, Castro-Rodriguez JA. Asthma phenotypes in the era of personalized medicine. J Clin Med. 2023;12(19):6207. PMID: 37834850; PMCID: PMC10573947. doi:10.3390/jcm12196207
25. Hur GY, Ye YM, Yang E, Park HS. Serum potential biomarkers according to sputum inflammatory cell profiles in adult asthmatics. Korean J Intern Med. 2020;35(4):988–997. Epub 2019 Nov 15. PMID: 31722514; PMCID: PMC7373983. doi:10.3904/kjim.2019.083
26. Al-Ahmad M, Mobayed H, Al Busaidi N, et al. Severe asthma treatment patterns: a multicenter observational study in the Gulf region. World Allergy Organ J. 2022;15(5):100647. PMID: 35663273; PMCID: PMC9127696. doi:10.1016/j.waojou.2022.100647
27. Al-Ahmad M, Ali A. Obesity in severe asthma: unveiling challenges and exploring new therapeutic options. World Allergy Organ J. 2025;18(4):101042. PMID: 40151673; PMCID: PMC11938057. doi:10.1016/j.waojou.2025.101042
28. Abuzakouk M, Ghorab OKHA, Mahboub B, et al. Demographic and clinical patterns of severe asthma in the Middle East. Ann Thorac Med. 2021;16(2):172–177. Epub 2021 Apr 17. PMID: 34012484; PMCID: PMC8109688. doi:10.4103/atm.ATM_131_20
29. Tarraf H, Aydin O, Mungan D, et al. Prevalence of asthma among the adult general population of five Middle Eastern countries: results of the SNAPSHOT program. BMC Pulm Med. 2018;18(1):68. PMID: 29751756; PMCID: PMC5948696. doi:10.1186/s12890-018-0621-9
30. Mendy A, Mersha TB. Comorbidities in childhood-onset and adult-onset asthma. Ann Allergy Asthma Immunol. 2022;129(3):327–334. Epub 2022 May 18. PMID: 35595004; PMCID: PMC10265950. doi:10.1016/j.anai.2022.05.005
31. Frøssing L, Klein DK, Hvidtfeldt M, et al. Distribution of type 2 biomarkers and association with severity, clinical characteristics and comorbidities in the BREATHE real-life asthma population. ERJ Open Res. 2023;9(2):00483–2022. PMID: 36949964; PMCID: PMC10026007. doi:10.1183/23120541.00483-2022
32. Deng Z, Jin M, Ou C, et al; C-BIOPRED Consortium. Eligibility of C-BIOPRED severe asthma cohort for type-2 biologic therapies. Chin Med J. 2023;136(2):230–232. PMID: 36752798; PMCID: PMC10106261. doi:10.1097/CM9.0000000000002556
33. Al Busaidi N, Alweqayyan A, Al Zaabi A, et al. Gulf asthma diagnosis and management in adults: expert review and recommendations. Open Respir Med J. 2022;16:e187430642205230. PMID: 37273945; PMCID: PMC10156056. doi:10.2174/18743064-v16-e2205230
34. Thomas D, Hamada Y, Gibson P, Brightling CE, Castro M, Heaney LG. Diagnosis and treatment options for T2-low asthma. J Allergy Clin Immunol Pract. 2025;13(7):1527–1539. Epub 2025 May 13. PMID: 40373870. doi:10.1016/j.jaip.2025.04.055
35. Chowdhury NU, Guntur VP, Newcomb DC, Wechsler ME. Sex and gender in asthma. Eur Respir Rev. 2021;30(162):210067. PMID: 34789462; PMCID: PMC8783601. doi:10.1183/16000617.0067-2021
36. Koper I, Hufnagl K, Ehmann R. Gender aspects and influence of hormones on bronchial asthma - Secondary publication and update. World Allergy Organ J. 2017;10(1):46. PMID: 29308113; PMCID: PMC5745695. doi:10.1186/s40413-017-0177-9
37. Baldaçara RP, Silva I. Association between asthma and female sex hormones. Sao Paulo Med J. 2017;135(1):4–14. Epub 2017 Jan 5. PMID: 28076614; PMCID: PMC9969728. doi:10.1590/1516-3180.2016.011827016
38. Peri F, Amaddeo A, Badina L, Maschio M, Barbi E, Ghirardo S. T2-Low asthma: a discussed but still orphan disease. Biomedicines. 2023;11(4):1226. PMID: 37189844; PMCID: PMC10136127. doi:10.3390/biomedicines11041226
39. Al Ghobain MO, Alsubaie AS, Aljumah WA, et al. The Correlation Between Fractional Exhaled Nitric Oxide (FeNO), blood eosinophil count, immunoglobulin e levels, and spirometric values in patients with asthma. Cureus. 2023;15(2):e35289. PMID: 36968856; PMCID: PMC10037222. doi:10.7759/cureus.35289
40. Pignatti P, Visca D, Loukides S, et al. A snapshot of exhaled nitric oxide and asthma characteristics: experience from high to low income countries. Pulmonology. 2022;28(1):44–58. Epub 2020 Dec 21. PMID: 33358001. doi:10.1016/j.pulmoe.2020.10.016
41. Badar A, Salem AM, Bamosa AO, Qutub HO, Gupta RK, FeNO SIAAB. Total blood IgE, peripheral blood eosinophil and inflammatory cytokines in partly controlled asthma. J Asthma Allergy. 2020;13:533–543. PMID: 33149625; PMCID: PMC7605921. doi:10.2147/JAA.S274022
42. Ge W, Guo X, Song X, et al. The role of immunoglobulin E and mast cells in hypertension. Cardiovasc Res. 2022;118(14):2985–2999. PMID: 35048969. doi:10.1093/cvr/cvac010
43. Ertuglu LA, Kirabo A. Hypersensitive or hypertensive? IgE-FcɛR1 signalling in mast cells adds a new piece to the immunity and hypertension puzzle. Cardiovasc Res. 2022;118(14):2877–2879. PMID: 35417016; PMCID: PMC9648816. doi:10.1093/cvr/cvac028
44. Nakagome K, Nagata M. Involvement and possible role of eosinophils in asthma exacerbation. Front Immunol. 2018;9:2220. PMID: 30323811; PMCID: PMC6172316. doi:10.3389/fimmu.2018.02220
45. Hirano T, Matsunaga K. Measurement of blood eosinophils in asthma and chronic obstructive pulmonary disease. Intern Med. 2023;62(1):21–25. Epub 2022 Apr 16. PMID: 35431305; PMCID: PMC9876705. doi:10.2169/internalmedicine.9339-22
46. Toledo-Pons N, van Boven JFM, Muncunill J, et al. Impact of blood eosinophil variability in asthma: a real-life population study. Ann Am Thorac Soc. 2022;19(3):407–414. PMID: 34534050. doi:10.1513/AnnalsATS.202103-409OC
47. Kalpaklioglu AF, Kalkan IK. Comparison of orally exhaled nitric oxide in allergic versus nonallergic rhinitis. Am J Rhinol Allergy. 2012;26(2):e50–4. PMID: 22487277; PMCID: PMC3906508. doi:10.2500/ajra.2012.26.3717
48. Ishizuka T, Matsuzaki S, Aoki H, et al. Prevalence of asthma symptoms based on the European Community Respiratory Health Survey questionnaire and FENO in university students: gender differences in symptoms and FENO. Allergy Asthma Clin Immunol. 2011;7(1):15. PMID: 21923950; PMCID: PMC3193803. doi:10.1186/1710-1492-7-15
49. Mahut B, Peyrard S, Delclaux C. Exhaled nitric oxide and clinical phenotypes of childhood asthma. Respir Res. 2011;12(1):65. PMID: 21599913; PMCID: PMC3126727. doi:10.1186/1465-9921-12-65
50. Ricciardolo FL, Sorbello V, Ciprandi G. A pathophysiological approach for FeNO: a biomarker for asthma. Allergol Immunopathol. 2015;43(6):609–616. Epub 2015 Mar 19. PMID: 25796309. doi:10.1016/j.aller.2014.11.004
 © 2026 The Author(s). This work is published and licensed by Dove Medical Press Limited. The
full terms of this license are available at https://www.dovepress.com/terms
and incorporate the Creative Commons Attribution
- Non Commercial (unported, 4.0) License.
By accessing the work you hereby accept the Terms. Non-commercial uses of the work are permitted
without any further permission from Dove Medical Press Limited, provided the work is properly
attributed. For permission for commercial use of this work, please see paragraphs 4.2 and 5 of our Terms.
© 2026 The Author(s). This work is published and licensed by Dove Medical Press Limited. The
full terms of this license are available at https://www.dovepress.com/terms
and incorporate the Creative Commons Attribution
- Non Commercial (unported, 4.0) License.
By accessing the work you hereby accept the Terms. Non-commercial uses of the work are permitted
without any further permission from Dove Medical Press Limited, provided the work is properly
attributed. For permission for commercial use of this work, please see paragraphs 4.2 and 5 of our Terms.
Recommended articles

Clinical Characteristics and Management Strategies for Adult Obese Asthma Patients
Farzan S, Coyle T, Coscia G, Rebaza A, Santiago M
Journal of Asthma and Allergy 2022, 15:673-689
Published Date: 18 May 2022

Can Treatable Traits Be the Approach to Addressing the Complexity and Heterogeneity of COPD?
Cazzola M, Rogliani P, Blasi F
International Journal of Chronic Obstructive Pulmonary Disease 2023, 18:1959-1964
Published Date: 8 September 2023