Back to Journals » OncoTargets and Therapy » Volume 12
Bioinformatics analysis of molecular genetic targets and key pathways for hepatocellular carcinoma
Authors Tu J, Chen J, He M, Tong H, Liu H, Zhou B, Liao Y ![]() , Wang Z
, Wang Z ![]()
Received 19 December 2018
Accepted for publication 27 May 2019
Published 2 July 2019 Volume 2019:12 Pages 5153—5162
DOI https://doi.org/10.2147/OTT.S198802
Checked for plagiarism Yes
Review by Single anonymous peer review
Peer reviewer comments 2
Editor who approved publication: Prof. Dr. Gaetano Romano
Junxue Tu,1 Jingjing Chen,2 Meimei He,1 Hongfei Tong,3 Haibin Liu,3 Bin Zhou,3 Yi Liao,3 Zhaohong Wang3
1Department of Pharmacy, The Second Affiliated Hospital and Yuying Children’s Hospital of Wenzhou Medical University, Wenzhou, Zhejiang 325000, People’s Republic of China; 2Department of Breast Surgery, The Second Affiliated Hospital and Yuying Children’s Hospital of Wenzhou Medical University, Wenzhou, Zhejiang 325000, People’s Republic of China; 3Department of Hepatobiliary Surgery, The Second Affiliated Hospital and Yuying Children’s Hospital of Wenzhou Medical University, Wenzhou, Zhejiang 325000, People’s Republic of China
Background: Hepatocellular carcinoma (HCC) is the second leading cause of death among cancers worldwide. In this study, we aimed to identify the molecular target genes and detect the key mechanisms of HCC. Three gene expression profiles (GSE84006, GSE14323, GSE14811) and two miRNA expression profiles (GSE40744, GSE36915) were analyzed to determine the molecular target genes, microRNAs (miRNAs) and the potential molecular mechanisms in HCC.
Methods: All profiles were extracted from the Gene Expression Omnibus database. The identification of the differentially expressed genes (DEGs) was analyzed by the GEO2R method. Kyoto Encyclopedia of Genes and Genomes (KEGG) pathway and gene ontology (GO) enrichment analysis performed database for Integrated Discovery, Visualization and Annotation. The miRNA-gene network and protein–protein interaction (PPI) network were correlated by the Cytoscape software. The key target genes were identified by the CytoHubba plugin, Molecular Complex Detection (MCODE) plugin and miRNA-gene network. The identified hub genes were testified for survival curve using the Kaplan–Meier plotter database.
Results: Expression profiles had 592 overlapped DEGs. The majority of the DEGs were enriched in membrane-bounded organelles and intracellular membrane-bounded organelles. These DEGs were significantly enriched in metabolic, protein processing in the endoplasmic reticulum and thyroid cancer pathways. PPI network analysis showed these genes were mostly involved in the pathogenic Escherichia coli infection and the regulation of actin cytoskeleton pathways. Combining these results, we identified 10 key genes involving in the progression of HCC. Finally, PLK1, PRCC, PRPF4 and PSMA7 exhibited higher expression levels in HCC patients with poor prognosis than those for lower expression via Kaplan–Meier plotter database.
Conclusion: PLK1, PRCC, PRPF4 and PSMA7 could be potential biomarkers or therapeutic targets for HCC. Meanwhile, the metabolic pathway, protein processing in the endoplasmic reticulum and the thyroid cancer pathway may play vital roles in the progression of HCC.
Keywords: hepatocellular carcinoma, DEGs, bioinformatic analysis, KEGG pathway, PPI network, miRNA-gene network
Introduction
Hepatocellular carcinoma (HCC), the second most common cancer in the world, is a major contributor to cancer mortality and incidence.1 More than 580,000 new cases are increased every year in Asia, with China accounting for more than 50%.2 Several methods have been used for decreasing the incidence rate, containing early detection and diagnosis. These methods are well efficacious and could reduce the mortality and incidence. However, the 10-year survival rate remains unsatisfactory in patients.3 As is well known, HCC is a heterogeneous disease. The occurrence and development of HCC are associated with the cellular context, environmental influences, and gene aberrations.1 Recently, several studies suggested that cellular pathways and multiple genes may participate in the progression of HCC.4–6 However, the underlying molecular mechanisms remain unknown. Thus, it is urgent and important to dig the hub molecules and to uncover the key molecular mechanisms.
The miRNAs are a series of small, non-coding regulatory RNAs, which regulate gene expression and perform a crucial role in the regulation of proliferation, cellular differentiation and cell death. A part of miRNAs was regarded as tumor suppressor genes, or oncogenes that contribute to several cancer progressions. Notably, some key miRNAs provide a novel approach for HCC therapy. For instance, microRNA-21, microRNA-26a and microRNA-29a-3p have been reported association with HCC and could serve as biomarkers;7,8 Shigoka et al also showed that plasma miR-92a could effectively discriminate HCC from the control subjects.9
In recent years, a large amount of data about transcriptome of cells have been established using numerous of high‑throughput technologies. In particular, the microarray is a novel high-throughput platform for the analysis of gene expression. During tumorigenesis, the microarray technique, as a useful tool for the analysis of general genetic alteration, has been extensively used. Through accurate microarray analyses, the key factors processed by biochip data extraction, biological data clustering and sequence alignment can be identified. These analytical techniques provide a new and quick method to explore the molecular pathogenesis mechanism of various types of cancers.
In this study, 3 gene expression profiles and 2 miRNA expression profiles were downloaded from the Gene Expression Omnibus (GEO) database to obtain differentially expressed genes (DEGs) and differentially expressed (DE) miRNAs between the HCC tissues and normal liver tissues samples. Furthermore, functional enrichment and the PPI network analyses were used to identify the DEGs. Meanwhile, with the mRNA–microRNA interaction analysis, the ten hub genes in DEGs were tested and four key genes and miRNAs as well as their potential molecular mechanisms were studied.
Materials and methods
Microarray data
Three gene expression profiles (GSE84006, GSE14323, GSE14811) and two miRNA expression profiles (GSE40744, GSE36915) were retrieved from the GEO database.10
Identification of DEGs and DE miRNAs
Limma is a Bioconductor package of R that offers a comprehensive solution for the analysis of gene expression data. limma has been widely used for gene detection.11 This package contains sophisticated facilities for reading, normalizing and exploring for large datasets. Moreover, it also applies an adjusted P-value (adj. P) to help correct false-positives. Herein, the adj. P for selection of DEGs and DE miRNAs was set as <0.05. Funrich webserver (http://funrich.org/index.html) was utilized to analyze the overlap of DEGs in the three datasets and the overlapping DEMs in the two miRNA expression profiles.12
Functional and pathway enrichment analysis
Gene ontology (GO) is widely used in annotating genes, gene products and sequences. The Kyoto Encyclopedia of Genes and Genomes (KEGG) is a comprehensive database for biological interpretation of genome sequences and other high-throughput data. Both analyses were available in the Database for annotation, visualization and integrated discovery database (DAVID database), which is a bioinformatics data resource composed of an integrated biology knowledge base and analysis tools to extract meaningful biological information from large quantities of genes and protein collections.13 Herein, GO and KEGG analyses were applied by using the DAVID database to identification of DEGs. The cut-off criterion was set (P-value <0.05).
Construction of PPI network and analysis of modules
The online database of STRING (https://string-db.org/) was applied to assess the PPI containing direct (physical) and indirect (functional) associations.14 Then, the Cytoscape program, an open-source tool, was used for the visual exploration of the interaction networks among different biomolecules, which contained protein, gene and other types of interactions.15 Herein, the DEGs were mapped to STRING database to assess the PPI and visualized by Cytoscape program. The cut-off criterion of combined score and node degree was set to >0.15 and ≥10, respectively. Recent study suggested that the newly proposed method MCC performs better than other 10 previous reported methods.16 Therefore, the plug-in of Molecular Complex Detection (MCODE) was utilized to screen hub gene modules with the degree cut-off, haircut on, k-core, node score cut-off, max depth set as 10, 0.2, 2, 0.2 and 100. In addition, the functional and pathway enrichment analyses of DEGs were carried out by DAVID database in each module and the cut-off criterion of P-value was set as <0.05.
Prediction of miRNA targets and prognosis analysis
The target genes of the DEMs from GSE40744 and GSE36915 were predicted by miRNet webserver (https://www.mirnet.ca/), which is commonly used for predicting microRNA targets.17 The target genes were superposed with the DEGs to gain an intersection for further analysis. To identification of the hub genes, the results from MCODE, CytoHubba and miRNA-gene networks were combined. The Kaplan–Meier plotter webserver was applied to analyze the prognostic significance of the identified hub genes.17
Results
Identification of DEGs in expression profiles
GSE84006 datasets contained 38 tumor tissues and 38 paired adjacent non-tumor tissues. GSE14811 datasets contained 56 HCC samples and 56 liver samples. GSE14323 included 19 normal samples, 17 cirrhosis HCC samples, 41 cirrhosis samples and 38 HCC samples. The miRNA expression profile of GSE40744 included 9 normal samples and 67 HCV-associated HCC tumor samples. GSE36915 included 21 non-tumor samples and 68 tumor samples. A total of 8,655, 11,544, and 1,375 DEGs were identified after the analyses of the GSE84006, GSE14323, and GSE14811 datasets, respectively. Among them, 592 genes were found in all these datasets (Figure 1A).
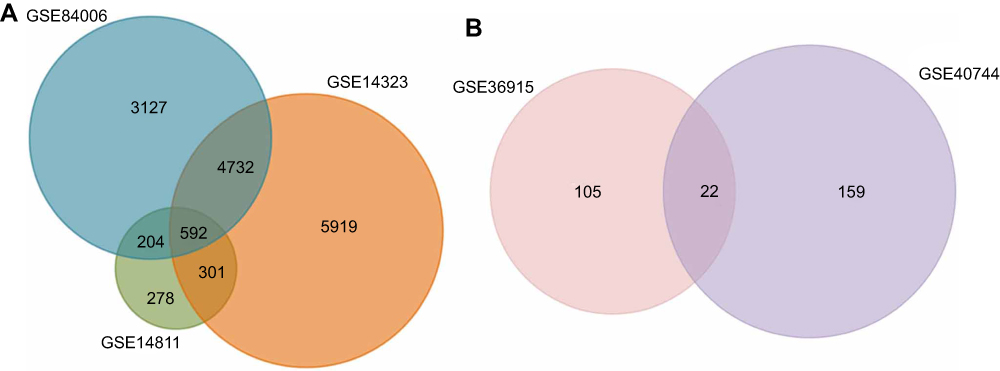 |
Figure 1 Identification of overlapping DEGs and DE miRNAs. (A) Identification of overlapping upregulated and downregulated DEGs in GSE84006, GSE14323 and GSE14811. (B) Identification of overlapping upregulated and downregulated DE miRNAs in GSE36915 and GSE40744. |
Functional and pathway enrichment analyses of DEGs
The GO analysis indicated 366 overlapping genes that are involved in numerous biological processes (BP), such as substance metabolic, single organisms and macromolecules (Figure 2A). In terms of cellular components (CC), DEGS were mainly enriched in the membrane-bounded organelles and intracellular membrane-bounded organelles (Figure 2B). The overlapping DEGs were primarily associated to the structural organization of the extracellular matrix, organic cyclic compounds binding, protein binding and heterocyclic compound binding in terms of molecular functions (Figure 2C). Additionally, the DEGs were enriched in three Kyoto Encyclopedia of Genes and Genomes (KEGG) pathways, which included the metabolic pathways, protein processing in the endoplasmic reticulum and the thyroid cancer pathway (Figure 2D).
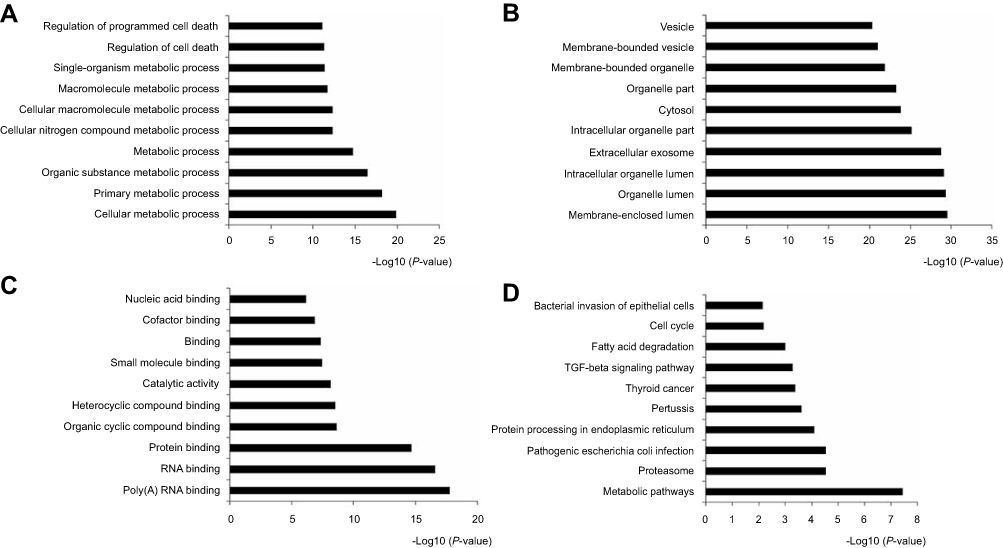 |
Figure 2 GO method analyzed the overlapping DEGs. The number of DEGs were showed of black bars. (A) Biological processes (BP) of top 10; (B) Cellular components (CC) of top 10; (C) Molecular function (MF) of top 10; (D) KEGG pathway of top 10. |
Construction of PPI network and analysis of modules
A total of 532 nodes and 3,370 edges were mapped in the PPI network of the identified DEGs. As shown in Figure 3, these DEGs-overlapped showed significant interactions and networks. The combined scores higher than 0.4 in PPIs were used for constructing the PPI networks. The MCODE plugin was used to analyze the entire PPI network and four modules were selected. As shown in Figure 4, enrichment analysis of the module genes of the KEGG pathway reveals enrichment in pathogenic Escherichia coli infection and the regulation of actin cytoskeleton. The first 50 genes provided by MCC method were selected and sequentially ordered as follows: SNRPD2, SF3B4, HNRNPA1, SNRPC, HNRNPU, RNPS1, POLR2H, SF3A2, PRPF3, POLR2I and so on (Table 1 ranked by MCC method).
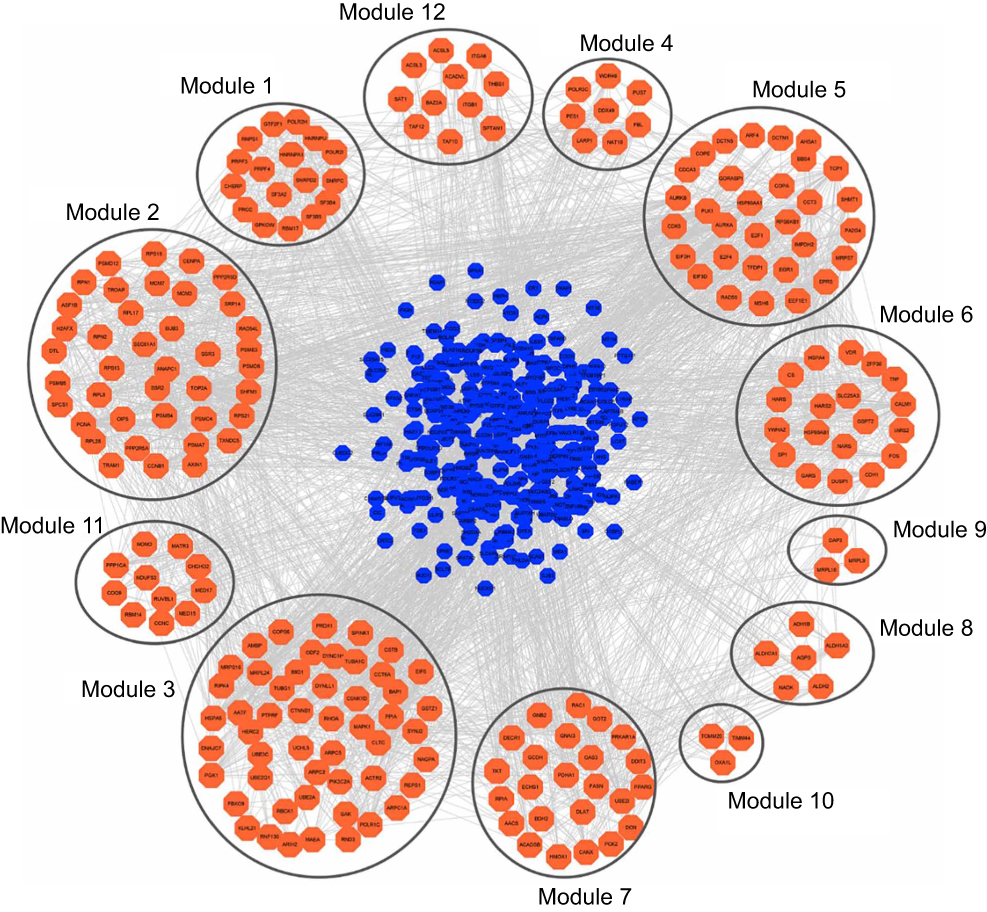 |
Figure 3 PPI network construction and module analysis. DEGs used blue nodes to represent. Orange colors of nodes represented the correlation to modules with other DEGs; meanwhile, the lines represented the relationship of two nodes. |
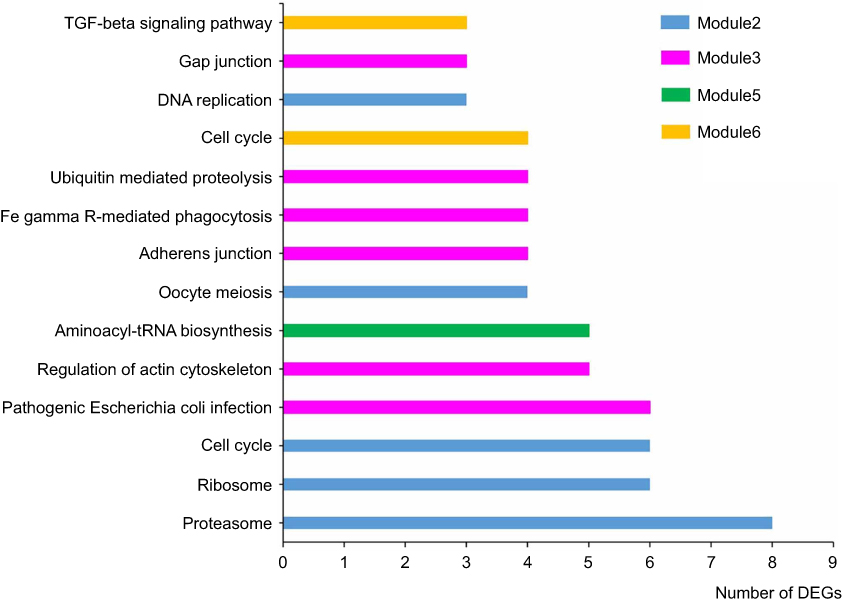 |
Figure 4 KEGG pathway analysis. The most important four modules analyzed by KEGG pathway. Bars signified the number of DEGs. Different colors represented different modules. |
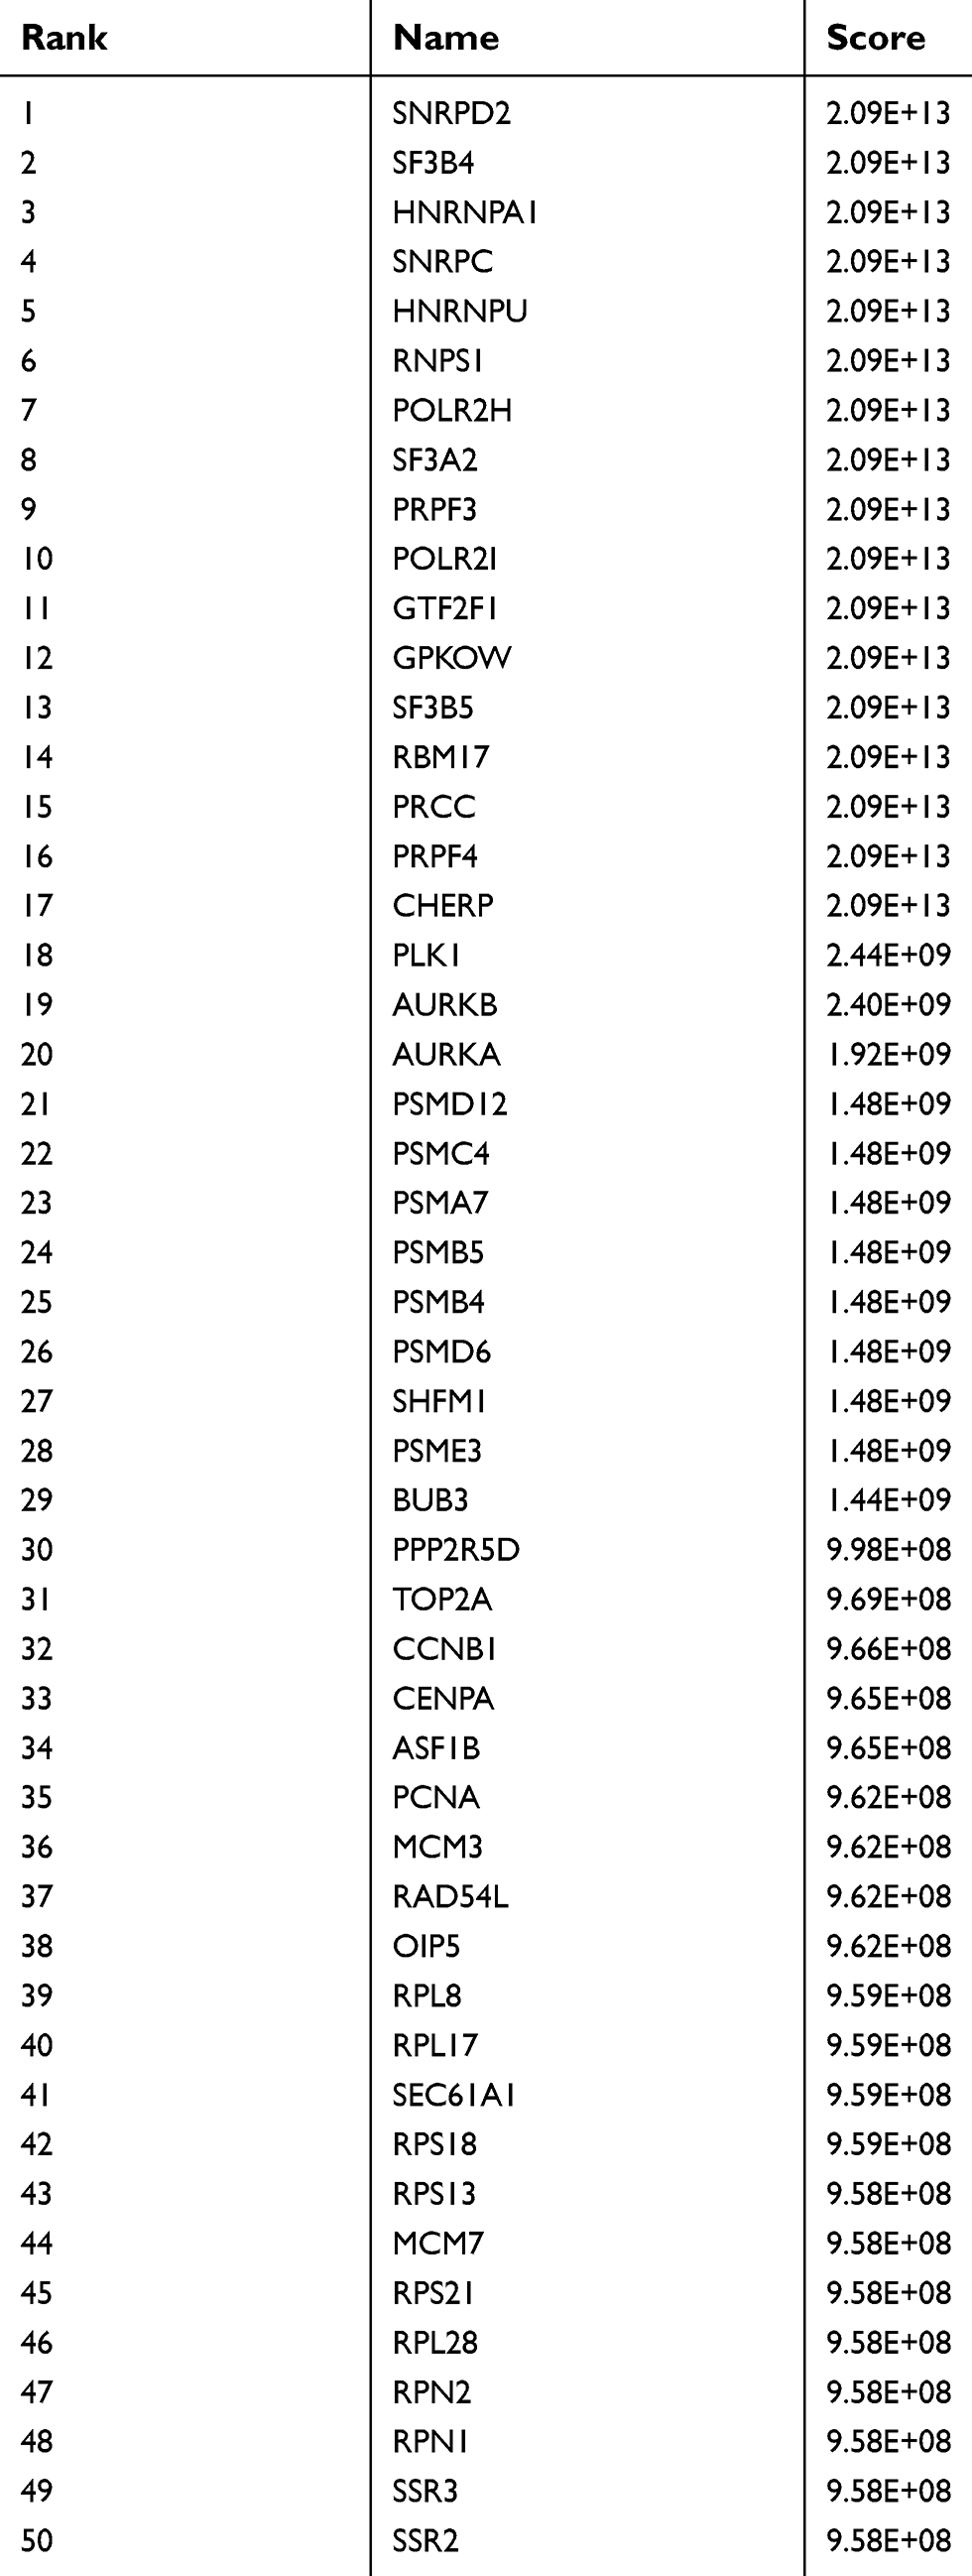 |
Table 1 Top 50 in PPI network ranked by MCC method |
miRNA-DEG pairs
As shown in Figure 1B, a total of 22 DE miRNAs were identified by evaluating the dataset of miRNA expression dataset (GSE36915 and GSE40744). Then, 180 nodes and 224 edges were mapped in the miRNA-gene network of the identified DEGs and miRNAs (Figure 5). Moreover, the genes predicted by the miRNet webserver were considered as DE miRNAs target genes. For further identification of reliable hub genes, the identified target genes were compared to the DEGs. In this process, only the overlapping genes were considered as the hub genes. After combination of the results provided by MCODE, CytoHubba and the miRNA-gene network, ten hub genes were selected, including PLK1, PRCC, PRPF4, PSMA7, CHERP, GPKOW, HNRNPA1, PSMB5, PSMC4 and RNPS1.
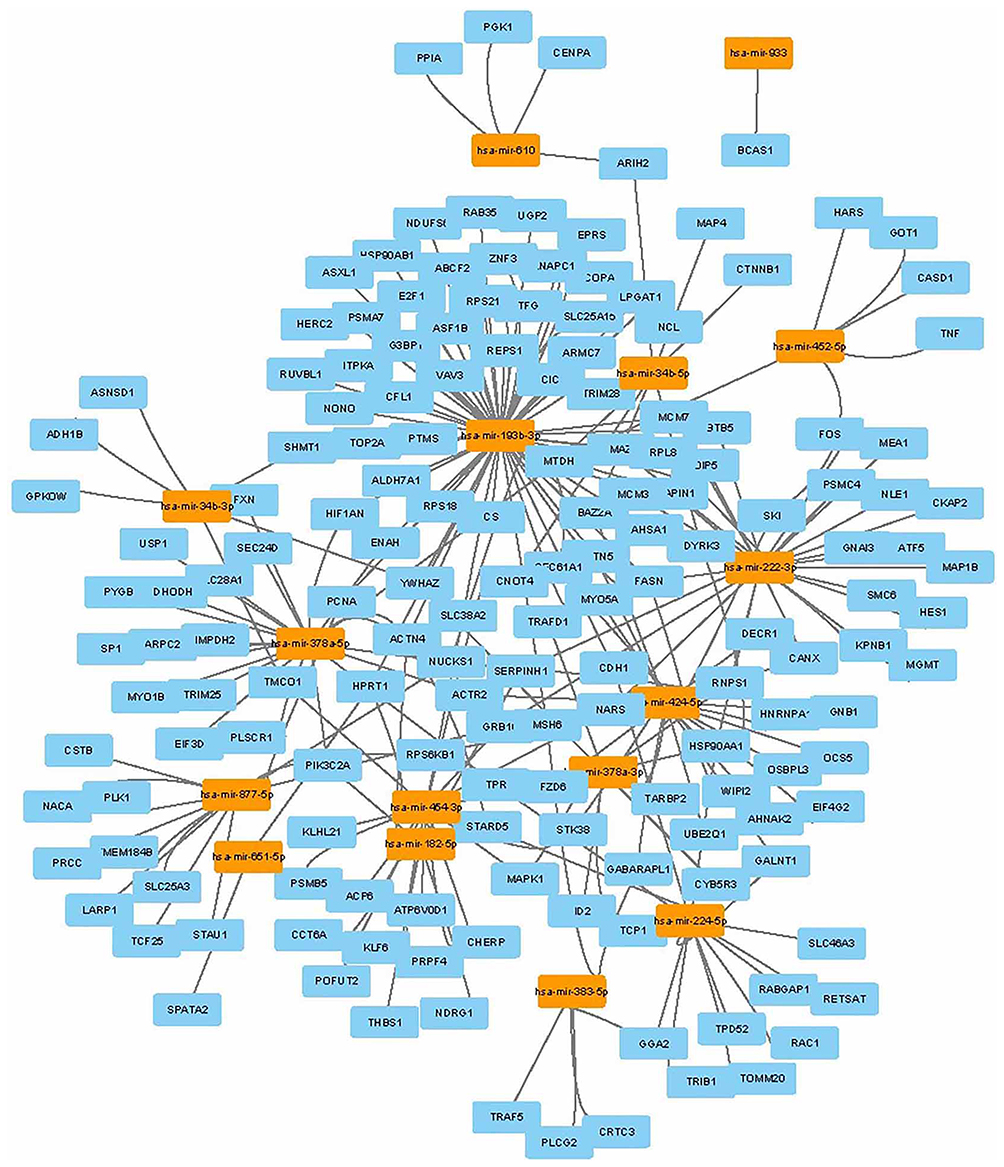 |
Figure 5 miRNA-gene network. Regulation of DEGs in miRNA-gene network. Light blue nodes stand for DEGs, light orange nodes represent DE miRNAs. The lines represent the regulation of relationship between two nodes. |
Kaplan–Meier survival analysis
To verify the results from bioinformatics analysis, the Kaplan–Meier plotter database was performed to predict the prognostic value of these hub genes. As shown in Figure 6, the OS for 364 patients with HCC was analyzed using the Kaplan–Meier survival plot. As a result, PLK1, PRCC, PRPF4 and PSMA7 were significantly correlated with worse OS for HCC patients.
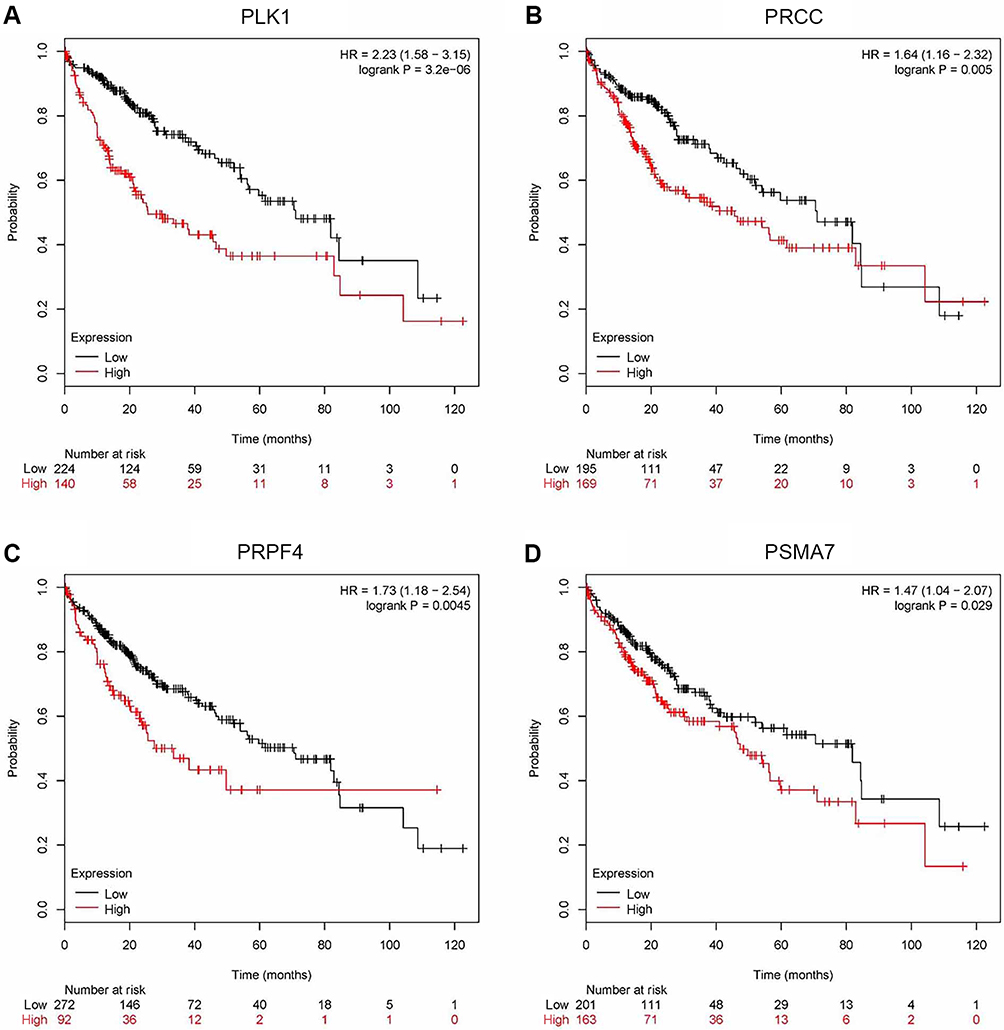 |
Figure 6 Survival rates of four target genes. Using the Kaplan–Meier plotter database to analyze prognostic significance of the target genes in individuals of HCC. (A) PLK1. (B) PRCC. (C) PRPF4. (D) PSMA7. The red lines signified individuals with high expression of target gene and black lines with low expression. |
Discussion
Although HCC has been extensively studied, HCC is still a seriously difficult problem in the early diagnosis. The reason for that is the lack of depth understanding of the molecular mechanisms in the occurrence, progression and development. Therefore, a depth research, relating to the key genes and mechanisms of HCC development and progression, is important for HCC diagnosis and pre-treatment. It is convenient and easy to discover the general genetic alterations in the development and progression of diseases by the novel microarray technology, which could investigate the underlying hub genes and mechanisms for the diagnosis and therapies.18–20
In this study, we analyzed 592 overlapping DEGs, both up-regulated and down-regulated genes, in the GSE84006, GSE14323 and GSE14811 expression profile datasets (Figure 1). The GO analysis indicated that the 592 overlapping DEGs were correlated to substance metabolic, single organisms and macromolecules at the level of BPs. Besides, we tested DEGs in the KEGG pathway enrichment analysis. The results showed that the overlapping DEGs were mostly enriched in the metabolic pathway, protein processing in the endoplasmic reticulum and the thyroid cancer pathway. The metabolic pathway was identified as one of the essential pathways of the major modules of the overlapping DEGs (Figure 2). These enriched pathways may provide potential strategies for the development of new therapeutic agents.
Carcinogenesis is a complicated and complex process influencing with some specific genes and involving multiple signaling cascades. Recently, bioinformatics analyses have been used for identifying novel diagnosis markers and therapeutic targets for many cancers.21–23 Zou et al24 identified NRAGE as a novel biomarker for HCC by integrated bioinformatics analysis. Furthermore, in early HCC, the G2/M checkpoint participated in the progression.25 Several similar researches have been shown for HCC now. Using bioinformatics analysis, Wang et al26 have found the miR-192-3p-XIAP axis involved in HCC. However, compared with this study, previous studies only chose a signal data or file alone, as well as analyzed the one module method, with a high degree of connectivity, to select those hub genes. Notably, the genes provided by our study that not only combining the results from CytoHubba, MCODE method and network tools for the identification of the key genes, but also using the Kaplan–Meier database. This is forceful increasing the reliability of these results (Figures 3–5).
We predicted 10 hub genes containing PLK1, PRCC, PRPF4, PSMA7, CHERP, GPKOW, HNRNPA1, PSMB5, PSMC4 and RNPS1. A few studies have reported these genes in other cancers. To ensure the results obtained from the bioinformatics analysis, the Kaplan–Meier plotter database was been chosen to predict the prognostic value of these key genes. Only PLK1, PRCC, PRPF4 and PSMA7 significantly correlated with worse OS for the HCC patients (Figure 6).
PLK1, a serine/threonine-protein kinase that belongs to the polo-like kinase family, participates in various biological processes about embryonic development, cell cycle and RNA processing.27 Xu et al28 tested high expression of PLK1 in the HCC tissues showed significantly worse effect in the histological type. PLK1 and HOTAIR accelerate proteasome degradation of SUZ12 and ZNF198 during hepatitis B virus-induced liver carcinogenesis.29 PLK1 phosphorylation of PTEN causes a tumor-promoting metabolic state.30
PRCC, the most common TFE3 fusion partner in papillary renal carcinoma, is associated with pre-mRNA splicing factors.31 In a subset of papillary renal cell carcinomas, PRCC has been repeatedly reported and presumably causes cancer.32,33 By RNA sequencing and FISH experiment, the clinicopathological analysis and detection of the gene fusion verified that the PRCC-MITF gene fusion defines a novel member of the MiT family translocation renal cell carcinoma.33
PRPF4, a key component of the spliceosomes, plays a critical role in pre-mRNA splicing and its mutations result in retinitis pigmentosa due to photoreceptor defects.34,35 PRPF4 is necessary part for cell survival, and in zebrafish, PRPF4 participate in posterior lateral line primordium migration.36 However, PRCC and PRPF4 are not reported with HCC, and studying these important genes can therefore increase the understanding of not HCC but other cancers. Notably, it is not coincident in the PRPF4 mRNA level and its corresponding miRNA level. That result potential showed that miRNA may be not directly control PRPF4.
The gene PSMA7 encodes a member of the peptidase T1A family, which is a 20S core alpha subunit.37 PSMA7 is often over-expressed in several human common cancers. In addition, overexpression of PSMA7 correlates with reduced survival rate in several types of cancers. Holmila et al38 tested a diagnostic use of PSMA7 to screen for early HCC. Tan et al39 investigated that PSMA7 inhibited the tumorigenicity of A549 human lung adenocarcinoma cells. The effects of sh-PSMA7 on cell proliferation and vascular endothelial growth factor expression via the ubiquitin-proteasome pathway in cervical cancer.40 Salivary exosomal PSMA7 is a promising biomarker of inflammatory bowel disease.41
Conclusion
In conclusion, a total of four genes including PLK1, PRCC, PRPF4 and PSMA7 were identified as HCC biomarkers, and metabolic pathway, protein processing in the endoplasmic reticulum and thyroid cancer pathway were confirmed to be the essential and most mechanisms in the development of HCC. Our study, however, had some obvious limitations such as no analysis of clinic liver tissue samples, or only using the Kaplan–Meier plotter database to analyze the prognostic value of these molecular target genes. Further studies should explore these markers in the HCC patients to ensure the prognostic effect and need to dig the underlying mechanisms or related pathways. In the next step, we would try to use computer to predict which compound could target these hub genes to inhibit HCC development; meanwhile, using some biological method we could investigate these potential functions in vivo and in vitro. Overall, our results showed that the interactive network of miRNAs and mRNA is highly complex. However, we need more experiments to investigate these novel, key and hub genes.
Data Availability
The raw data are provided in the Supplemental Information.
Acknowledgments
This study was supported by Natural Science Foundation of Zhejiang Project, China (LQ18H290003).
Disclosure
The authors declare that they have no competing interests in this work.
References
1. Chen H-J, Hu M-H, Xu F-G, Xu H-J, She -J-J, Xia H-P. Understanding the inflammation-cancer transformation in the development of primary liver cancer. Hepatoma Res. 2018;4(7):29. doi:10.20517/2394-5079.2018.18
2. Zhang K, Song P, Gao J, Li G, Zhao X, Zhang S. Perspectives on a combined test of multi serum biomarkers in China: towards screening for and diagnosing hepatocellular carcinoma at an earlier stage. Drug Discov Ther. 2014;8(3):102–109. doi:10.5582/ddt.2014.01026
3. Sharma SA, Kowgier M, Hansen BE, et al. Toronto HCC risk index: a validated scoring system to predict 10-year risk of HCC in patients with cirrhosis. J Hepatol. 2017.doi:10.1016/j.jhep.2017.07.033
4. Fujiwara N, Nakagawa H, Enooku K, et al. CPT2 downregulation adapts HCC to lipid-rich environment and promotes carcinogenesis via acylcarnitine accumulation in obesity. Gut. 2018;67(8):1493–1504. doi:10.1136/gutjnl-2017-315193
5. Notarpaolo A, Layese R, Magistri P, et al. Validation of the AFP model as a predictor of HCC recurrence in patients with viral hepatitis-related cirrhosis who had received a liver transplant for HCC. J Hepatol. 2017;66(3):552–559. doi:10.1016/j.jhep.2016.10.038
6. Wu FQ, Fang T, Yu LX, et al. ADRB2 signaling promotes HCC progression and sorafenib resistance by inhibiting autophagic degradation of HIF1alpha. J Hepatol. 2016;65(2):314–324. doi:10.1016/j.jhep.2016.04.019
7. Kim SS, Cho HJ, Nam JS, et al. Plasma microRNA-21, 26a, and 29a-3p as predictive markers for treatment response following transarterial chemoembolization in patients with hepatocellular carcinoma. J Korean Med Sci. 2018;33(1):e6. doi:10.3346/jkms.2018.33.e101
8. Huang CS, Yu W, Cui H, et al. Increased expression of miR-21 predicts poor prognosis in patients with hepatocellular carcinoma. Int J Clin Exp Pathol. 2015;8(6):7234–7238.
9. Shigoka M, Tsuchida A, Matsudo T, et al. Deregulation of miR-92a expression is implicated in hepatocellular carcinoma development. Pathol Int. 2010;60(5):351–357. doi:10.1111/j.1440-1827.2010.02526.x
10. Clough E, Barrett T. The gene expression omnibus database. Methods Mol Biol. 2016;1418:93–110. doi:10.1007/978-1-4939-3578-9_5
11. Ritchie ME, Phipson B, Wu D, et al. Limma powers differential expression analyses for RNA-sequencing and microarray studies. Nucleic Acids Res. 2015;43(7):e47. doi:10.1093/nar/gkv007
12. Atkin-Smith GK, Tixeira R, Paone S, et al. A novel mechanism of generating extracellular vesicles during apoptosis via a beads-on-a-string membrane structure. Nat Commun. 2015;6:7439. doi:10.1038/ncomms8439
13. Huang Da W, Sherman BT, Lempicki RA. Systematic and integrative analysis of large gene lists using DAVID bioinformatics resources. Nat Protoc. 2009;4(1):44–57. doi:10.1038/nprot.2008.211
14. Szklarczyk D, Morris JH, Cook H, et al. The STRING database in 2017: quality-controlled protein-protein association networks, made broadly accessible. Nucleic Acids Res. 2017;45(D1):D362–D368. doi:10.1093/nar/gkw937
15. Su G, Morris JH, Demchak B, Bader GD. Biological network exploration with Cytoscape 3. Curr Protoc Bioinformatics. 2014;47:813 11–24. doi:10.1002/0471250953.bi0813s47
16. Chin CH, Chen SH, Wu HH, Ho CW, Ko MT, Lin CY. cytoHubba: identifying hub objects and sub-networks from complex interactome. BMC Syst Biol. 2014;8(Suppl 4):S11. doi:10.1186/1752-0509-8-49
17. Lanczky A, Nagy A, Bottai G, et al. miRpower: a web-tool to validate survival-associated miRNAs utilizing expression data from 2178 breast cancer patients. Breast Cancer Res Treat. 2016;160(3):439–446. doi:10.1007/s10549-016-4013-7
18. Cao L, Chen Y, Zhang M, et al. Identification of hub genes and potential molecular mechanisms in gastric cancer by integrated bioinformatics analysis. PeerJ. 2018;6:e5180. doi:10.7717/peerj.5180
19. Mou T, Zhu D, Wei X, et al. Identification and interaction analysis of key genes and microRNAs in hepatocellular carcinoma by bioinformatics analysis. World J Surg Oncol. 2017;15(1):63. doi:10.1186/s12957-017-1127-2
20. Wu S, Wu F, Jiang Z. Identification of hub genes, key miRNAs and potential molecular mechanisms of colorectal cancer. Oncol Rep. 2017;38(4):2043–2050. doi:10.3892/or.2017.5930
21. You S, Gao L. Identification of NMU as a potential gene conferring alectinib resistance in non-small cell lung cancer based on bioinformatics analyses. Gene. 2018;678:137–142. doi:10.1016/j.gene.2018.08.032
22. Wang Y, Zhang J. Identification of differential expression lncRNAs in gastric cancer using transcriptome sequencing and bioinformatics analyses. Mol Med Rep. 2018;17(6):8189–8195. doi:10.3892/mmr.2018.8889
23. Itzel T, Scholz P, Maass T, et al. Translating bioinformatics in oncology: guilt-by-profiling analysis and identification of KIF18B and CDCA3 as novel driver genes in carcinogenesis. Bioinformatics. 2015;31(2):216–224.
24. Zou W, Cui J, Ren Z, Leng Y. NRAGE is a potential diagnostic biomarker of hepatocellular carcinoma. Medicine. 2018;97(48):e13411. doi:10.1097/MD.0000000000013411
25. Sun WJ, Huang H, He B, et al. Romidepsin induces G2/M phase arrest via Erk/cdc25C/cdc2/cyclinB pathway and apoptosis induction through JNK/c-Jun/caspase3 pathway in hepatocellular carcinoma cells. Biochem Pharmacol. 2017;127:90–100. doi:10.1016/j.bcp.2016.12.008
26. Wang J, Chen J, Liu Y, et al. Hepatitis B virus induces autophagy to promote its replication by the axis of miR-192-3p-XIAP via NF-kappaB signaling. Hepatology. 2018;69:974–992.
27. Liu Z, Sun Q, Wang X. PLK1, A potential target for cancer therapy. Transl Oncol. 2017;10(1):22–32. doi:10.1016/j.tranon.2016.10.003
28. Xu L, Zhu Y, Shao J, et al. Dasatinib synergises with irinotecan to suppress hepatocellular carcinoma via inhibiting the protein synthesis of PLK1. Br J Cancer. 2017;116(8):1027–1036. doi:10.1038/bjc.2017.55
29. Zhang H, Diab A, Fan H, et al. PLK1 and HOTAIR accelerate proteasomal degradation of SUZ12 and ZNF198 during hepatitis B virus-induced liver carcinogenesis. Cancer Res. 2015;75(11):2363–2374. doi:10.1158/0008-5472.CAN-14-2928
30. Li Z, Li J, Bi P, et al. Plk1 phosphorylation of PTEN causes a tumor-promoting metabolic state. Mol Cell Biol. 2014;34(19):3642–3661. doi:10.1128/MCB.00814-14
31. Akhtar M, Al-Bozom IA, Al Hussain T. Papillary Renal Cell Carcinoma (PRCC): an update. Adv Anat Pathol. 2018;26:124–132.
32. Xiong L, Chen X, Liu N, et al. PRCC-TFE3 dual-fusion FISH assay: a new method for identifying PRCC-TFE3 renal cell carcinoma in paraffin-embedded tissue. PLoS One. 2017;12(9):e0185337. doi:10.1371/journal.pone.0185337
33. Xia QY, Wang XT, Ye SB, et al. Novel gene fusion of PRCC-MITF defines a new member of MiT family translocation renal cell carcinoma: clinicopathological analysis and detection of the gene fusion by RNA sequencing and FISH. Histopathology. 2018;72(5):786–794. doi:10.1111/his.13439
34. Chen X, Liu Y, Sheng X, et al. PRPF4 mutations cause autosomal dominant retinitis pigmentosa. Hum Mol Genet. 2014;23(11):2926–2939. doi:10.1093/hmg/ddu005
35. Gao Q, Mechin I, Kothari N, et al. Evaluation of cancer dependence and druggability of PRP4 kinase using cellular, biochemical, and structural approaches. J Biol Chem. 2013;288(42):30125–30138. doi:10.1074/jbc.M113.473348
36. Wang Y, Han Y, Xu P, et al. prpf4 is essential for cell survival and posterior lateral line primordium migration in zebrafish. J Genet Genomics. 2018;45(8):443–453. doi:10.1016/j.jgg.2018.05.008
37. Du H, Huang X, Wang S, Wu Y, Xu W, Li M. PSMA7, a potential biomarker of diseases. Protein Pept Lett. 2009;16(5):486–489.
38. Holmila R, Sklias A, Muller DC, et al. Targeted deep sequencing of plasma circulating cell-free DNA reveals Vimentin and Fibulin 1 as potential epigenetic biomarkers for hepatocellular carcinoma. PLoS One. 2017;12(3):e0174265. doi:10.1371/journal.pone.0174265
39. Tan JY, Huang X, Luo YL. PSMA7 inhibits the tumorigenicity of A549 human lung adenocarcinoma cells. Mol Cell Biochem. 2012;366(1–2):131–137. doi:10.1007/s11010-012-1290-2
40. Ren CC, Yang L, Liu L, et al. Effects of shRNA-mediated silencing of PSMA7 on cell proliferation and vascular endothelial growth factor expression via the ubiquitin-proteasome pathway in cervical cancer. J Cell Physiol. 2017;234:5851–5862.
41. Zheng X, Chen F, Zhang Q, et al. Salivary exosomal PSMA7: a promising biomarker of inflammatory bowel disease. Protein Cell. 2017;8(9):686–695. doi:10.1007/s13238-017-0413-7
 © 2019 The Author(s). This work is published and licensed by Dove Medical Press Limited. The
full terms of this license are available at https://www.dovepress.com/terms
and incorporate the Creative Commons Attribution
- Non Commercial (unported, 3.0) License.
By accessing the work you hereby accept the Terms. Non-commercial uses of the work are permitted
without any further permission from Dove Medical Press Limited, provided the work is properly
attributed. For permission for commercial use of this work, please see paragraphs 4.2 and 5 of our Terms.
© 2019 The Author(s). This work is published and licensed by Dove Medical Press Limited. The
full terms of this license are available at https://www.dovepress.com/terms
and incorporate the Creative Commons Attribution
- Non Commercial (unported, 3.0) License.
By accessing the work you hereby accept the Terms. Non-commercial uses of the work are permitted
without any further permission from Dove Medical Press Limited, provided the work is properly
attributed. For permission for commercial use of this work, please see paragraphs 4.2 and 5 of our Terms.