Back to Journals » Cancer Management and Research » Volume 13
Bioinformatics Analysis of Hub Genes and Potential Therapeutic Agents Associated with Gastric Cancer
Authors Zhang S ![]() , Xiang X, Liu L, Yang H, Cen D, Tang G
, Xiang X, Liu L, Yang H, Cen D, Tang G ![]()
Received 27 September 2021
Accepted for publication 16 November 2021
Published 30 November 2021 Volume 2021:13 Pages 8929—8951
DOI https://doi.org/10.2147/CMAR.S341485
Checked for plagiarism Yes
Review by Single anonymous peer review
Peer reviewer comments 2
Editor who approved publication: Professor Bilikere Dwarakanath
Shiyu Zhang, Xuelian Xiang, Li Liu, Huiying Yang, Dongliang Cen, Guodu Tang
Department of Gastroenterology, The First Affiliated Hospital of Guangxi Medical University, Nanning City, Guangxi Province, People’s Republic of China
Correspondence: Guodu Tang
Department of Gastroenterology, The First Affiliated Hospital of Guangxi Medical University, 22 Shuangyong Road, Nanning City, Guangxi Province, People’s Republic of China
Tel +86 13739139408
Email [email protected]
Purpose: The current treatment methods available for advanced gastric cancer are not very promising. Hence, it is important to explore novel biomarkers and potential therapeutic agents to treat gastric cancer (GC). This study aimed to identify hub genes associated with GC prognosis and explore potential drugs for its treatment.
Materials and Methods: Three gene expression data of GC and normal tissues were downloaded from the Gene Expression Omnibus (GEO) and processed to identify the differentially expressed genes (DEGs). We conducted a comprehensive analysis of DEGs, including functional enrichment analysis, construction of protein–protein interaction (PPI) network, identification of hub genes, survival analysis and expression verification of hub genes. Finally, we constructed the network of miRNA–mRNA, and predicted the drugs that might be effective for GC treatment.
Results: A total of 340 DEGs, including 94 up-regulated and 246 down-regulated genes, were identified. Among the up-regulated DEGs, the enrichment terms were primarily related to tumorigenesis and tumor progression, extracellular matrix organization, and collagen catabolic process. Additionally, 10 hub genes (FN1, COL3A1, COL1A2, BGN, THBS2, COL5A2, THBS1, COL5A1, SPARC, and COL4A1) were identified, out of which 7 genes were significantly associated with poor overall survival (OS) in GC. The expression levels of these 7 hub genes were verified using real-time PCR, immunohistochemistry, and the GEPIA2 (Gene Expression Profiling Interactive Analysis) server. A regulatory network of miRNA–mRNA was also constructed, and the top 4 interactive miRNAs (hsa-miR-29b-3p, hsa-miR-140-3p, hsa-miR-29a-3p, and hsa-miR-29c-3p) that targeted the most hub genes were identified. Finally, fourteen small molecules were predicted to be effective in treating GC.
Conclusion: The identification of the hub genes, miRNA–mRNA network, and potential candidate drugs associated with GC provides new insights into the molecular mechanisms and treatment of GC.
Keywords: gastric cancer, prognosis, bioinformatics, biomarkers
Introduction
Gastric cancer (GC) is one of the leading causes of death worldwide,1–3 with the highest incidence in East Asia, followed by eastern Europe.4 Early gastric cancer lacks specific symptoms, which leads to the fact that many gastric cancer patients are already in advanced stage when diagnosed.5 Heterogeneity of GC is also one of the factors leading to the low survival rate of patients with GC.6 Molecular diagnosis and targeted therapy are effective means to improve the early diagnosis rate of gastric cancer,7 and molecular diagnosis must be based on the search for specific tumor biomarkers.8
With the completion of the Human Genome Project, cancer has increasingly been studied at the genetic level. DNA microarrays play an important role in identifying of genes leading to cancer and have the characteristics of high throughput, accuracy, sensitivity, and low cost. The technology is already being widely used in disease diagnosis and drug screening.9,10
In this study, three gene expression profiles of GC and normal tissues were downloaded from the Gene Expression Omnibus (GEO) and processed to identify the differentially expressed genes (DEGs). Then we conducted a comprehensive analysis of DEGs, including functional enrichment analysis, construction of protein–protein interaction (PPI) network, identification of hub genes, survival analysis and expression verification of hub genes. Finally, we constructed the network of miRNA-hub genes, and predicted the drugs that might be effective for GC treatment through the online database.
Materials and Methods
Acquisition of Data
Three microarray datasets (GSE54129, GSE79973, and GSE13911) containing GC and normal tissues were downloaded from GEO online database (https://www.ncbi.nlm.nih.gov/gds/, accessed time: April 24, 2021) using GEOquery and preprocessed using affy R packages. All microarray datasets based on GPL570 platform (Affymetrix Human Genome U133 Plus 2.0 Array) contained more than 10 samples.
Screening of DEGs
The probe set IDs were converted into gene symbols using the annotation package hgu133plus2.db (3.2.3). If multiple probe sets corresponded to the same gene, the mean value of those probe sets expression was used. R software (version 4.0.3) was used to process all data using the Limma (3.46.0) package and Biobase (2.50.0).11,12 Fold change was considered significant for P<0.05 and threshold values >1.0 or <−1.0.
GO and KEGG Enrichment Analysis of DEGs
The Database for Annotation, Visualization and Integrated Discovery (DAVID) (https://david.ncifcrf.gov/, version 6.8, accessed time: April 28, 2021) provides a comprehensive set of functional annotation tools for investigators to understand the biological significance of a list of genes. The results of functional enrichment analysis were visualized by by R software package ggplot2.13
PPI Network Construction and Module Analysis
PPI network analysis was performed using the online tool Search Tool for the Retrieval of Interacting Genes/Proteins (STRING, https://string-db.org/, accessed time: May 11, 2021), and visualized using Cytoscape software (version 3.8.2). Then several major modules of the network were analyzed using MCODE plug-in of Cytoscape software, and hub genes were identified using Cytoscape plugin cytoHubba.
Survival Analysis and Online Validation of Hub Gene Expression
The Kaplan–Meier plots of the top 10 hub genes were drawn using the Kaplan-Meier plotter (http://kmplot.com/analysis/, accessed time: May 14, 2021), and the survival prognosis forest map was visualized using the randomForest package.
The expression levels of hub genes between GC and normal tissues were compared using Gene Expression Profiling Interactive Analysis (GEPIA2; http://gepia2.cancer-pku.cn/, accessed time: May 15, 2021). Furthermore, the genetic mutation information for hub genes was explored using the online tool of cBio Cancer Genomics Portal (https://www.cbioportal.org/, accessed time: May 16, 2021).
Real-Time PCR
We collected GC and para-cancer tissues from thirteen patients who had been first diagnosed with GC at the Endoscopy Center of the First Affiliated Hospital of Guangxi Medical University from July to November 2021. None of these patients had received any tumor-related treatment or had any other malignancy. Total RNA was isolated using TRIzol (R0016, Beyotime). Complementary DNA (cDNA) was synthesized using PrimeScript™ RT reagent Kit (RR047A, Takara). The qPCR reaction was set up using SYBR green PCR master mix containing 0.5 µL of cDNA. The quantitative real-time PCR analysis was performed using the real-time PCR system ABI 7500 Fast (Applied Biosystems). Data were normalized to GAPDH, and fold change in mRNA expression relative to controls was calculated using the 2−ΔΔCt method.
Immunohistochemistry (IHC)
We retrospectively studied the postoperative tumor tissues and normal tissues from 60 patients diagnosed with GC in The First People’s Hospital of Suqian from 2019 to 2020. The patients did not have any other known tumors, and no radiotherapy or chemotherapy had been performed before surgery. After removing paraffin, hydration, and sealing, the specimens were mixed with the antibodies anti-FN1 (#26836, Cell Signaling Technology), anti-COL1A2 (ab270994, Abcam), anti-BGN (ab209234, Abcam), anti-THBS2 (ab112543, Abcam), anti-COL5A1 (D264482, Sangong Biotech), anti-SPARC (ab225716, Abcam), and anti-COL4A1 (D260202, Sangong Biotech), and incubated overnight at 4 °C (with dilution ratios of 1:500, 1:2000, 1:2000, 1:1000, 1:200, 1:100, and 1:100, respectively). DAB (3, 3ʹ-diaminobenzidine) was used for signal detection. Additionally, we performed statistical analysis of images from immunohistology studies using Image-Pro Plus 6.0 software. Finally, we use GraphPad Prism 8 to visualize the statistical results.
Diagnostic Value of Hub Genes Based on TCGA Data
We downloaded the RNA sequencing dataset of stomach adenocarcinoma (STAD) from The Cancer Genome Atlas (TCGA, https://cancergenome.nih.gov, accessed time: May 17, 2021). We compared the expression of hub genes in tumor tissues and non-tumor tissues of GC patients to evaluate their diagnostic value in GC, and the ROC curve was visualized using the online tool Helix (https://www.helixlife.cn/, accessed time: May 18, 2021).
Construction of miRNAs-mRNA Network
The Encyclopedia of RNA Interactomes (ENCORI, http://starbase.sysu.edu.cn/; version 3.0, accessed time: May 21, 2021) is a public platform that identifies more than 2.5 million miRNA–mRNA interactions from multi-dimensional sequencing data. The target miRNAs of hub genes were screened based on the following criteria: SLIP-DATA ≥ 5, Degradome-Data ≥ 0, pan-Cancer ≥ 6, and programNum ≥ 3. Additionally, the miRNAs-hub genes network was visualized using Cytoscape software (version 3.8.2).
Drug-Hub Gene Interaction
The DGIdb (http://www.dgidb.org/search_interactions, accessed time: May 25, 2021) contains over 40,000 genes and 10,000 drugs involved in over 100,000 drug-gene interactions and belonging to one of the 42 potentially druggable gene categories. The drugs with potential therapeutic effect on the hub genes of GC were screened by DGIdb. Additionally, we used the online tool STITCH (http://stitch.embl.de/cgi/, accessed time: May 25, 2021) to construct an interaction network between hub genes and potential drugs.
Statistical Analyses
We conducted the paired samples t-test to analyze mRNA expression and immunohistological positive rate of hub genes in tumor tissues and paracancerous non-tumor gastric tissues with IBM SPSS Statistics v.24 software (IBM, Chicago, IL, USA). A value of P <0.05 was regarded as statistically significant.
Results
Screening of DEGs
The details of the three datasets downloaded from GEO are presented in Table 1. As shown in Figure 1, a total of 340 DEGs were identified in the three microarray datasets, of which 246 were down-regulated (Figure 1A) and 94 up-regulated (Figure 1B). The gene names of these 340 DEGs are shown in Table 2.
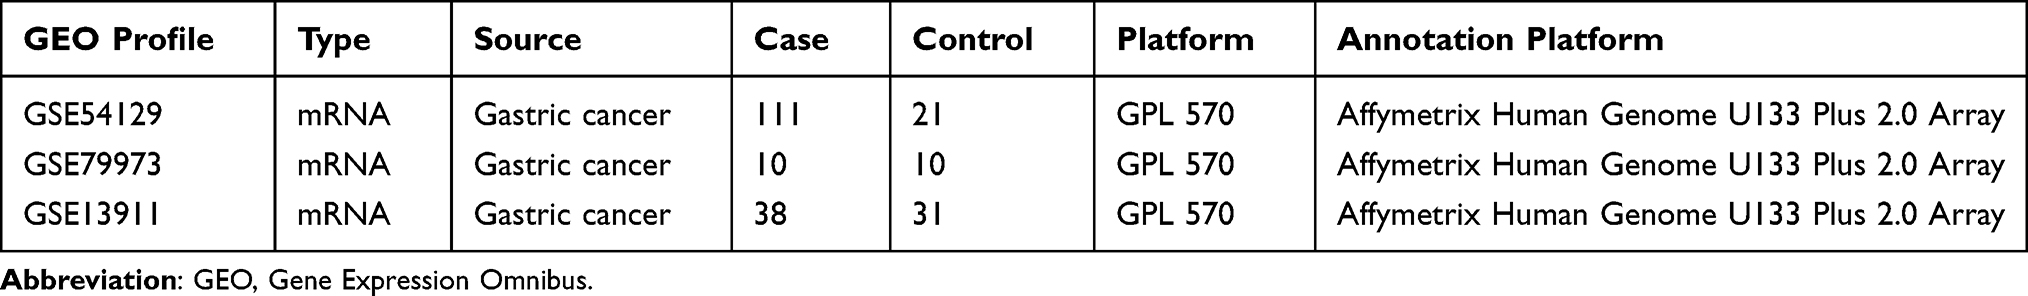 |
Table 1 Detailed Information on the GEO Microarray Profiles of GC Patients |
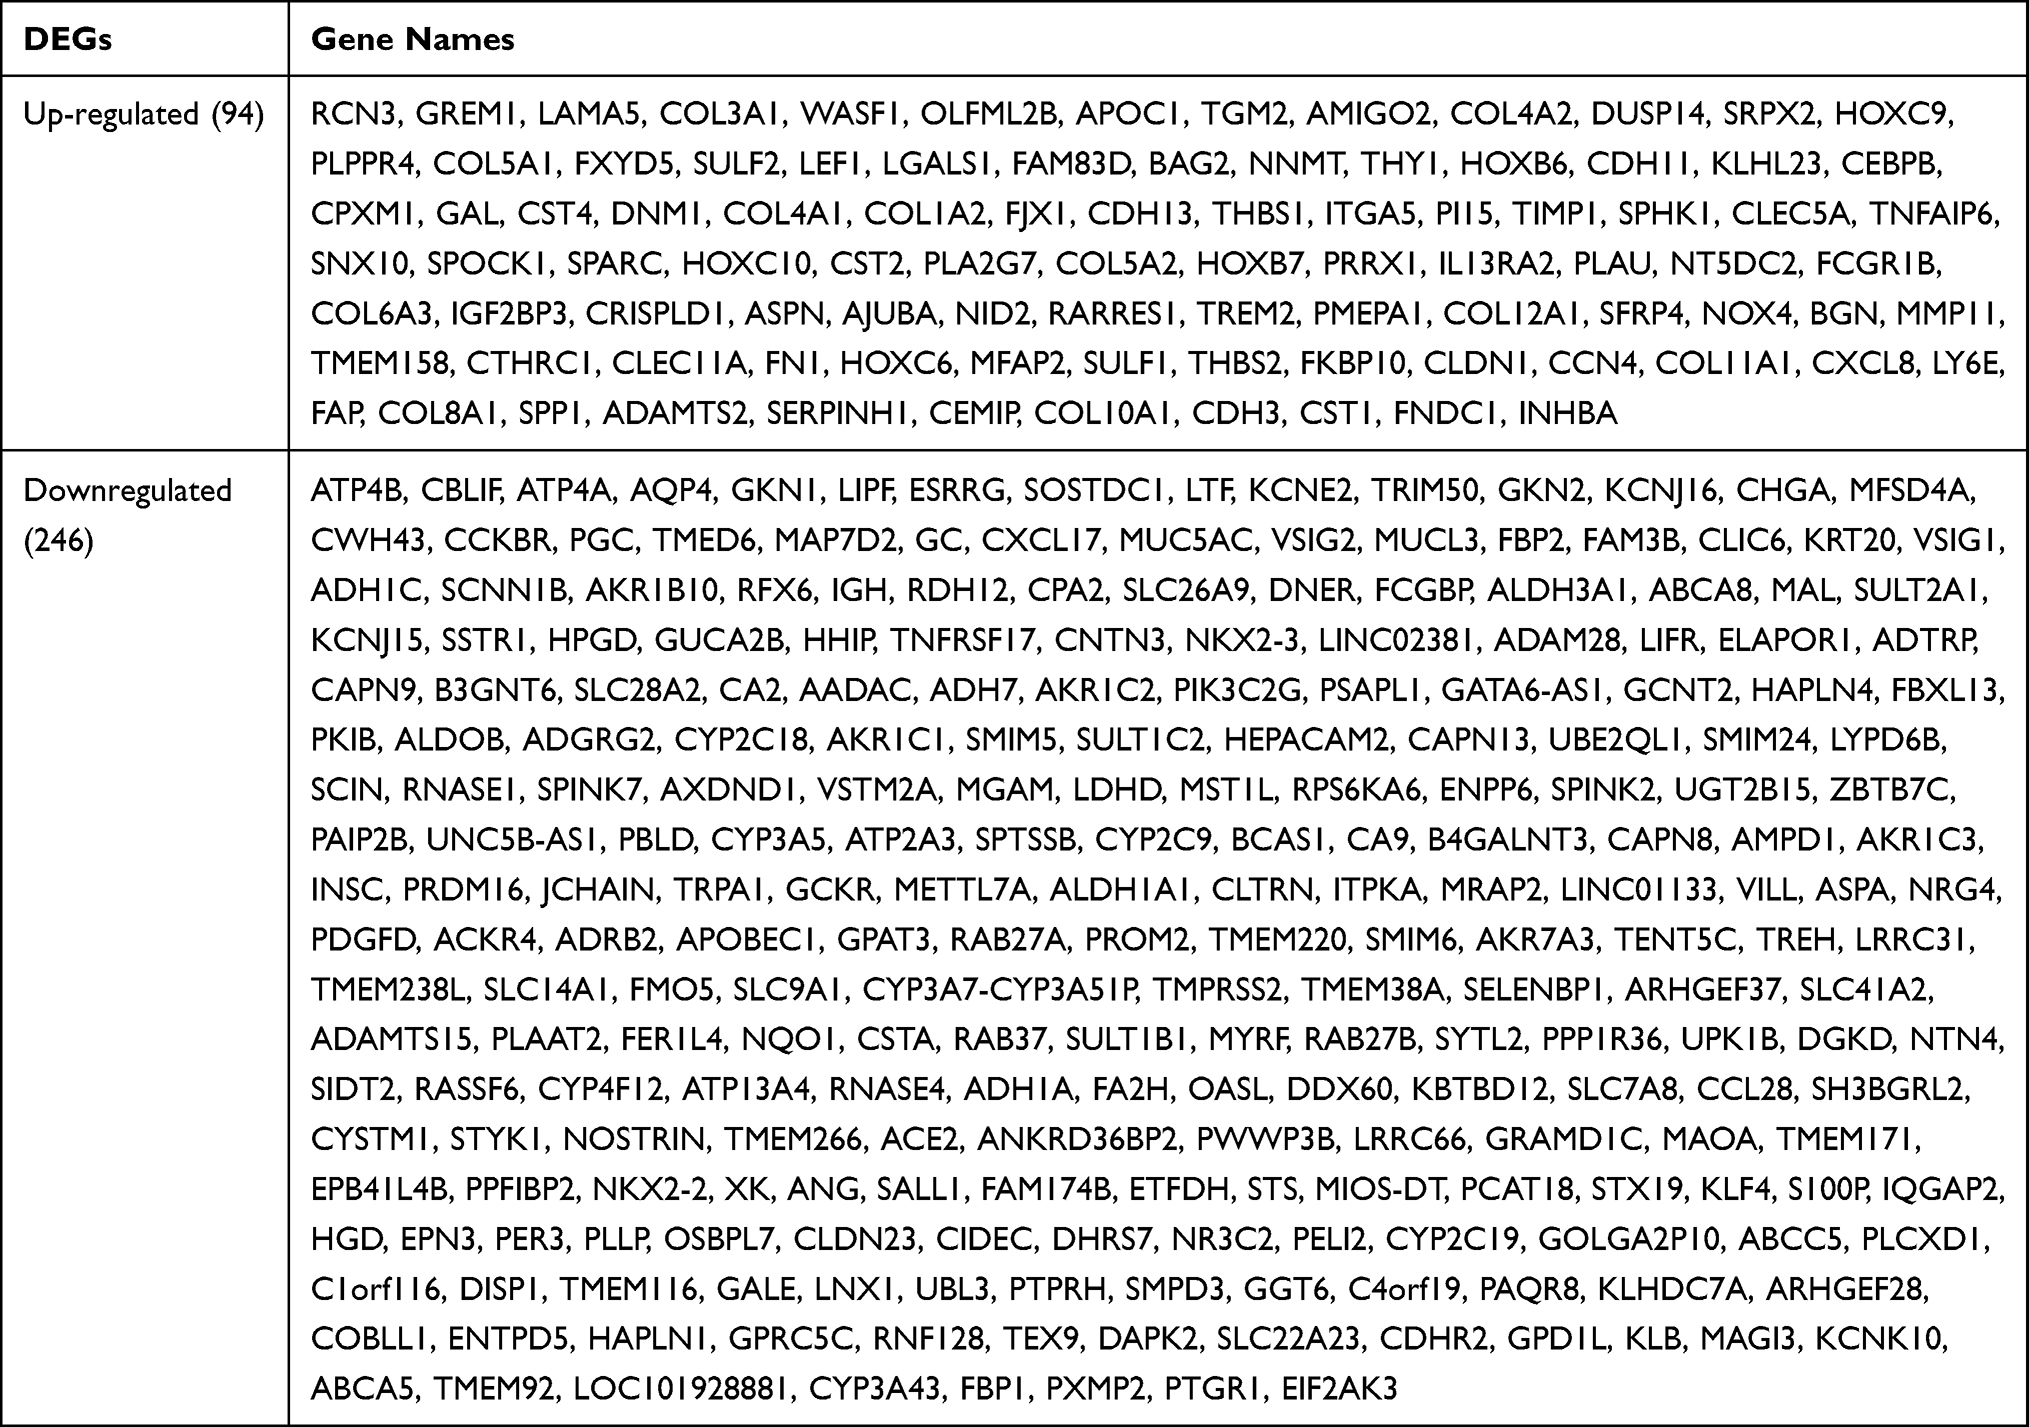 |
Table 2 Details of the 340 DEGs |
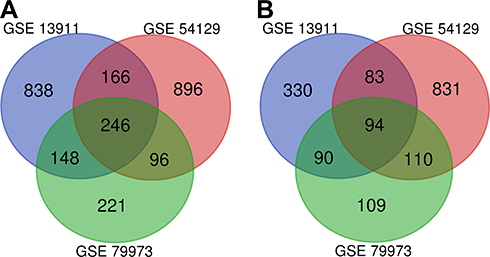 |
Figure 1 The 340 DEGs identified from the three microarray datasets: (A) 246 downregulated genes; (B) 94 up-regulated genes. |
GO and KEGG Enrichment Analysis of DEGs
To better understand the biological functions of overlapping DEGs, their enriched biological processes (BP), cellular components (CC), and molecular functions (MF) were studied. For the BP category, the up-regulated DEGs were involved in the extracellular matrix organization, collagen catabolic process, collagen fibril organization, cell adhesion, and endodermal cell differentiation (Figure 2A), whereas downregulated DEGs were significantly involved in steroid metabolic process, xenobiotic metabolic process, oxidation-reduction process, digestion, and daunorubicin metabolic process (Figure 2E). For the CC category, the up-regulated DEGs correlated with the extracellular region, extracellular matrix, extracellular space, proteinaceous extracellular matrix, and endoplasmic reticulum lumen (Figure 2B), whereas the downregulated DEGs were associated with extracellular exosome, organelle membrane, integral component of membrane, apical plasma membrane, and basolateral plasma membrane (Figure 2F). For the MF category, the up-regulated DEGs were enriched in extracellular matrix structural constituent, extracellular matrix binding, integrin binding, platelet-derived growth factor binding, and calcium ion binding (Figure 2C), whereas the downregulated DEGs were related to oxidoreductase activity, retinol dehydrogenase activity, monooxygenase activity, oxygen binding, and aromatase activity (Figure 2G). For the KEGG pathway, the up-regulated DEGs were enriched in ECM-receptor interaction, focal adhesion, protein digestion and absorption, and the amoebiasis PI3K-Akt signaling pathway (Figure 2D), and the down-regulated DEGs were enriched in chemical carcinogenesis, metabolism of xenobiotics by cytochrome P450, retinol metabolism, drug metabolism-cytochrome P450, and gastric acid secretion (Figure 2H). The detail results of GO and KEGG pathway analysis of up-regulated and down-regulated DEGs are shown in Tables 3 and 4, respectively.
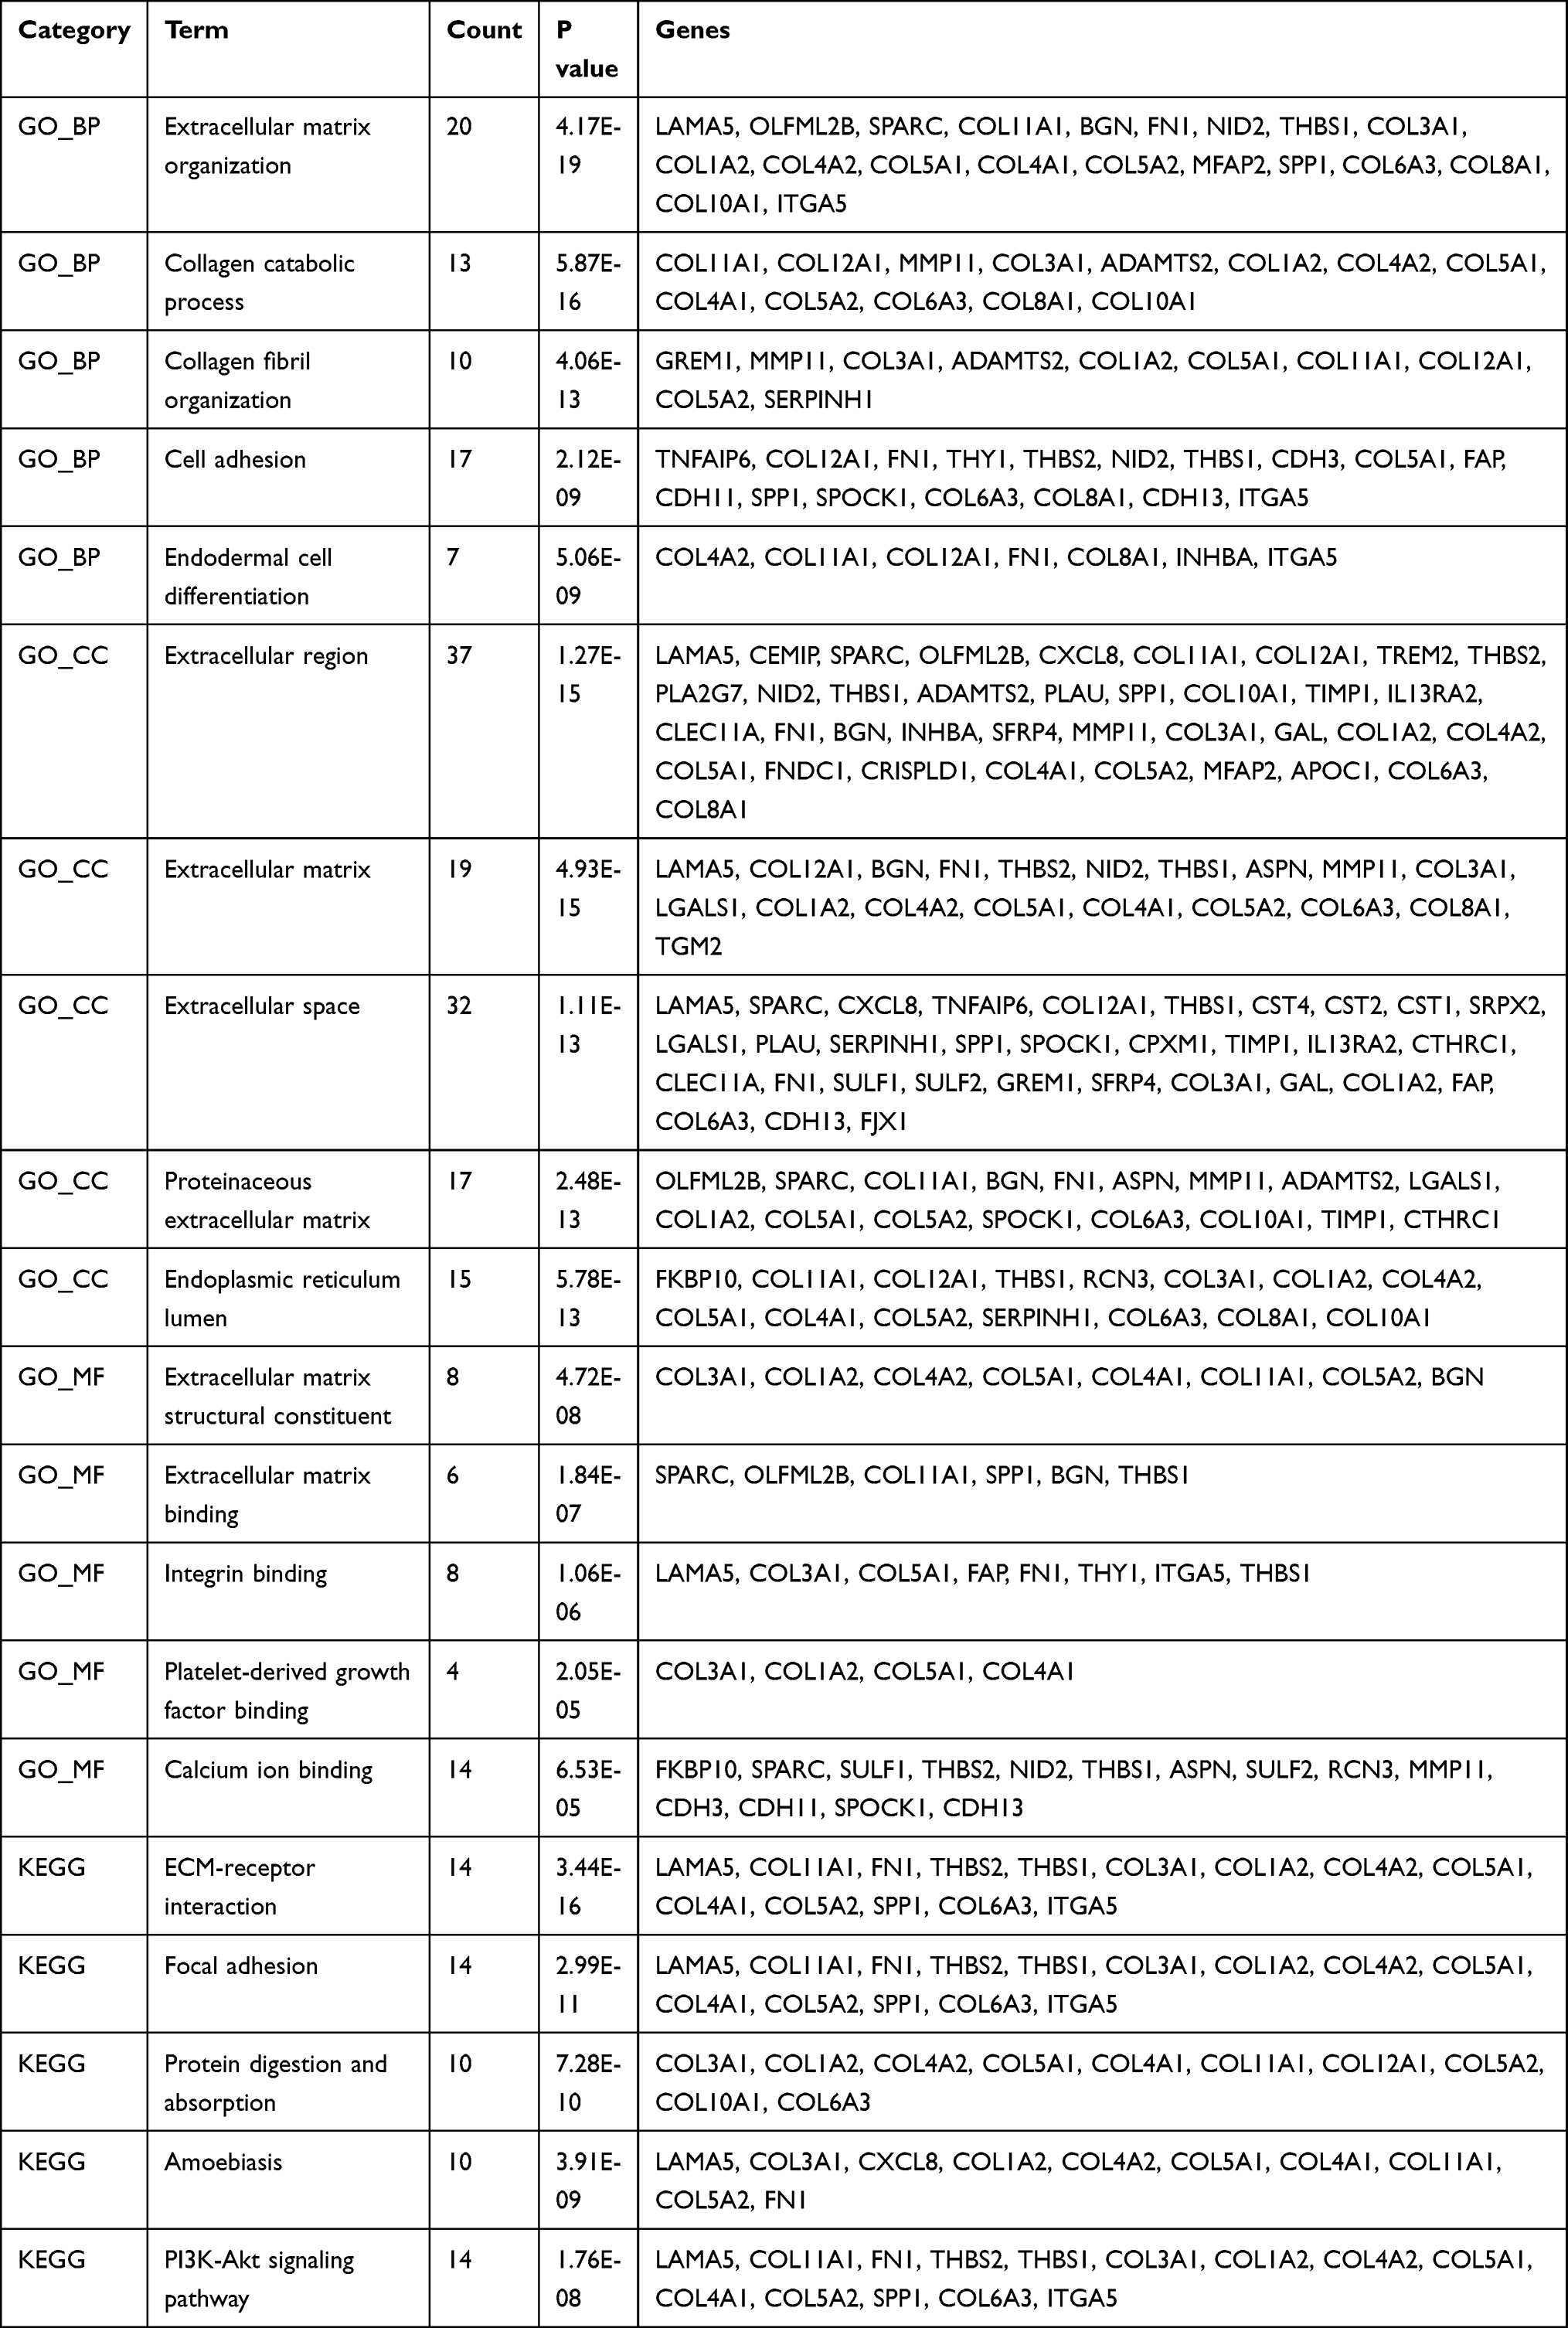 |
Table 3 GO (Gene Ontology) and KEGG (Kyoto Encyclopedia of Genes and Genomes) Enrichment Analysis Results of Up-Regulated DEGs |
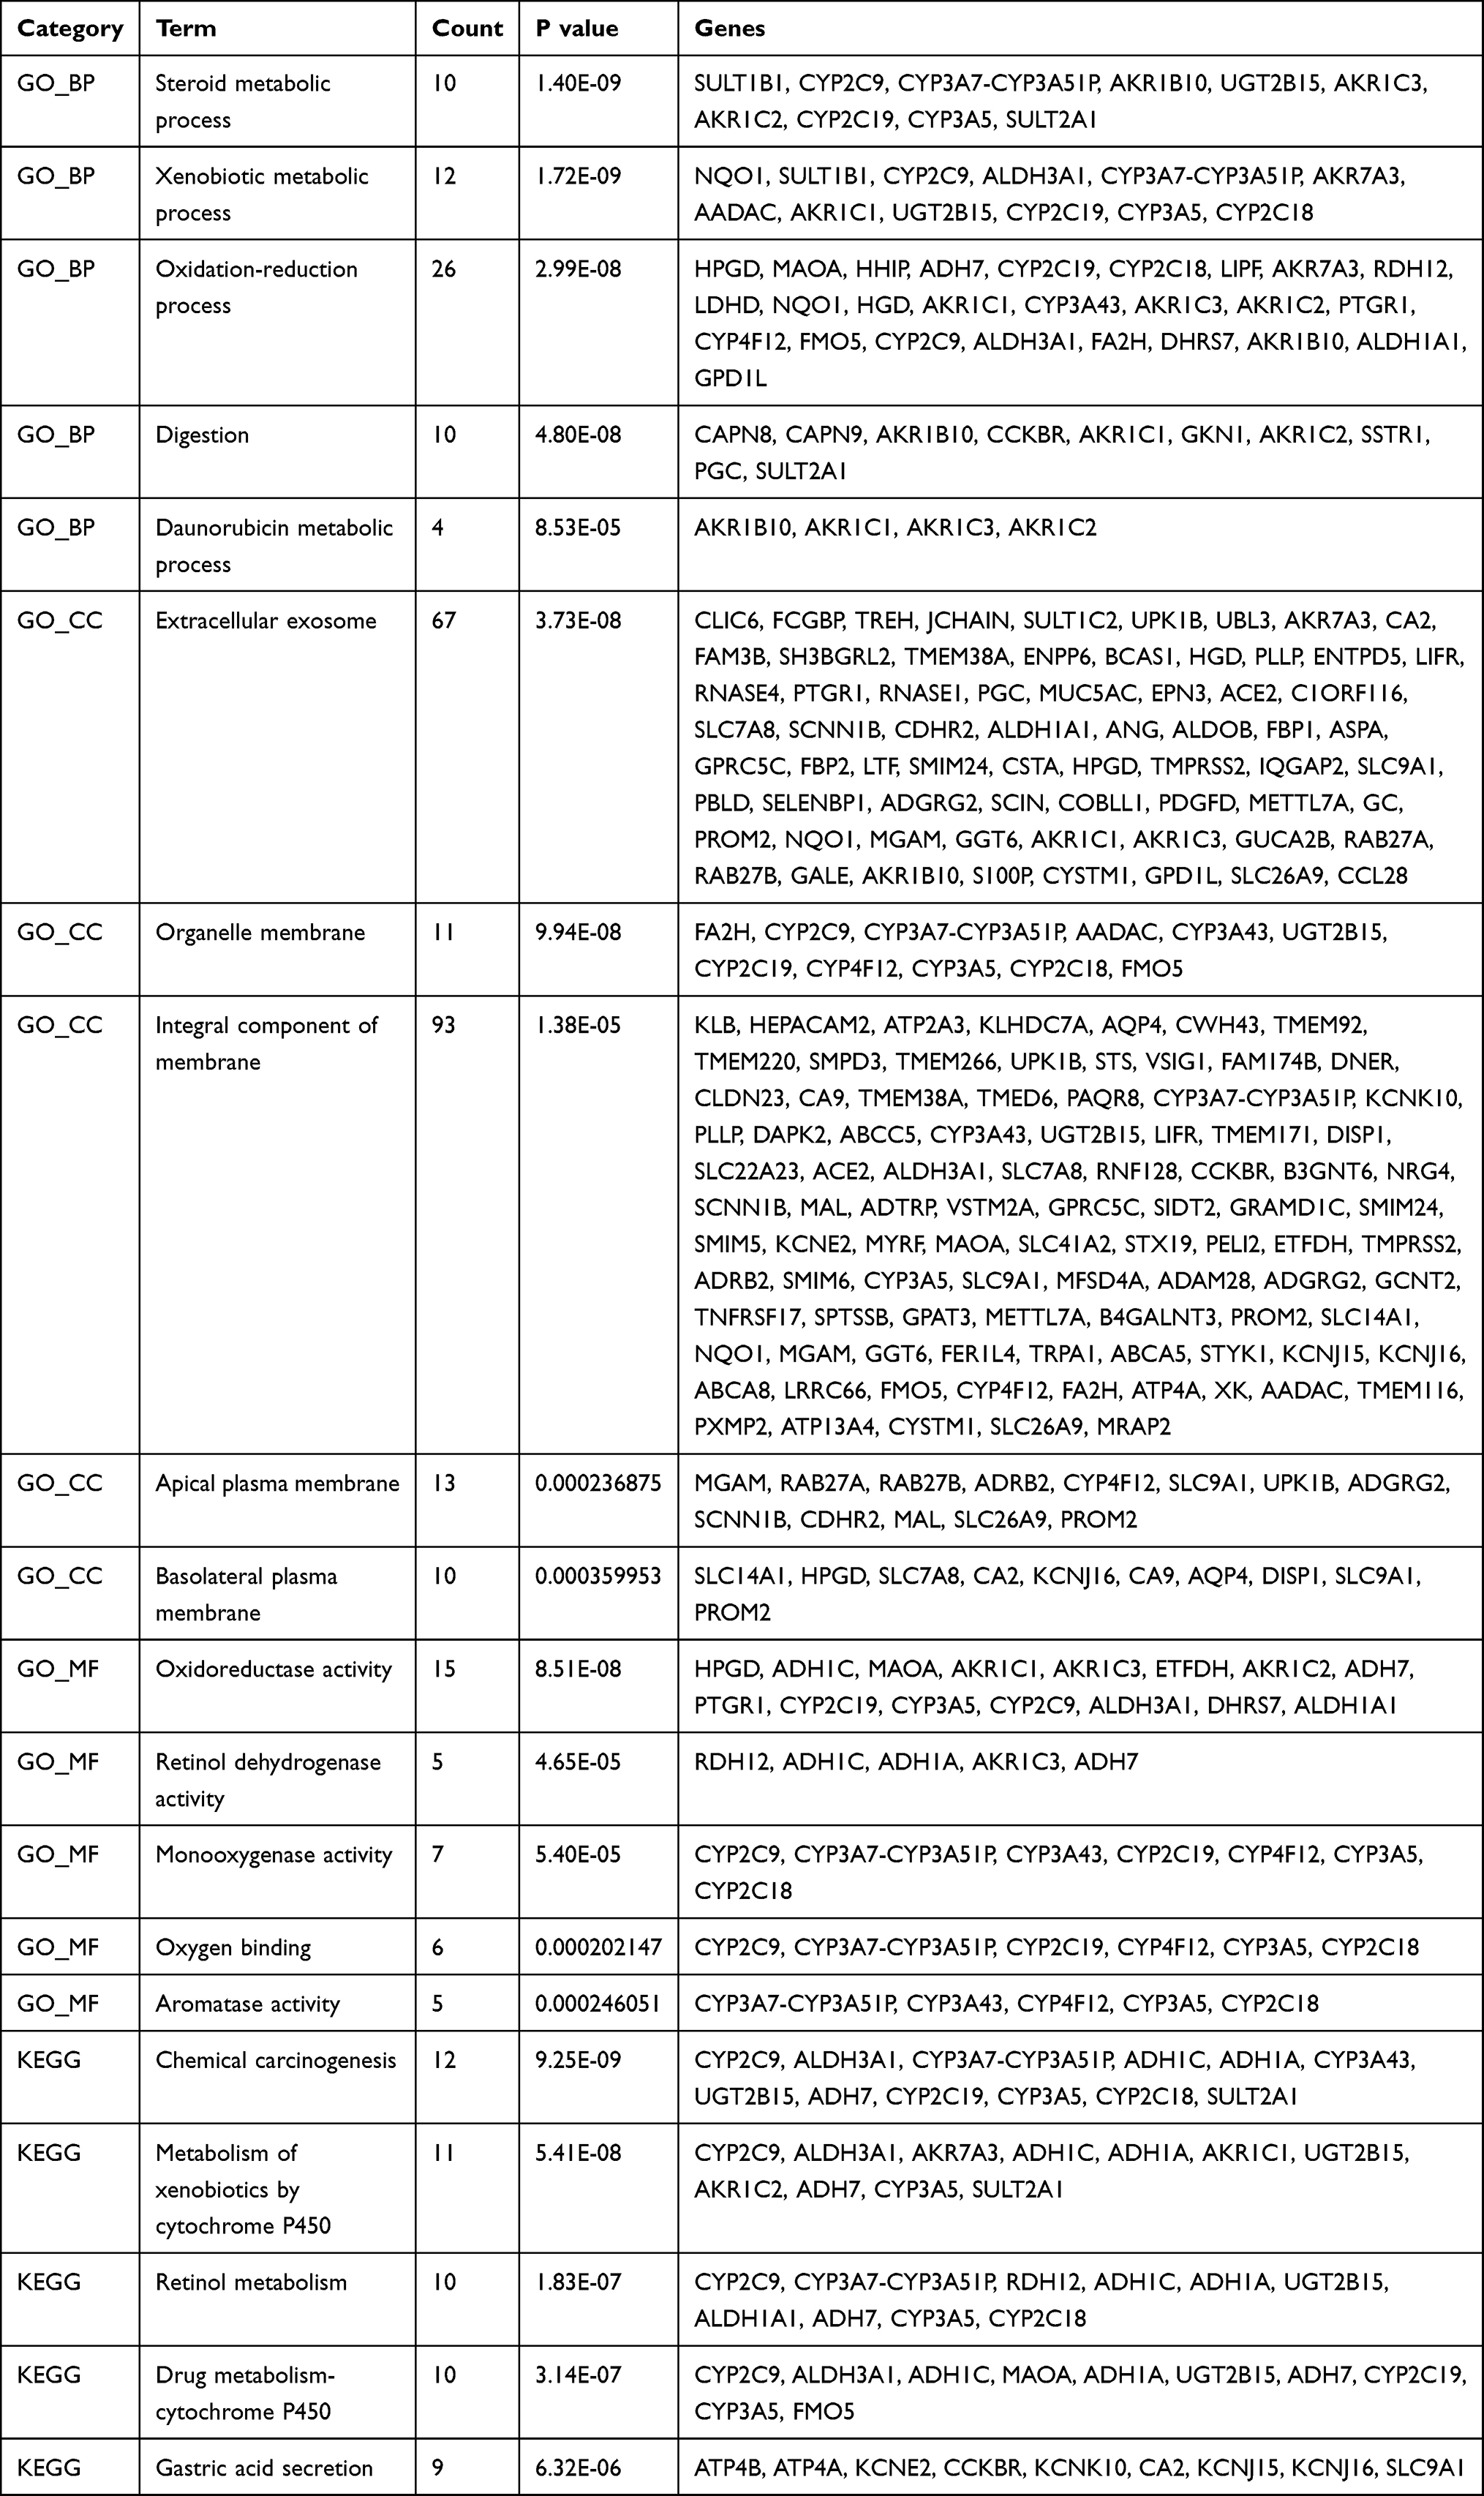 |
Table 4 GO (Gene Ontology) and KEGG (Kyoto Encyclopedia of Genes and Genomes) Enrichment Analysis Results of Down-Regulated DEGs |
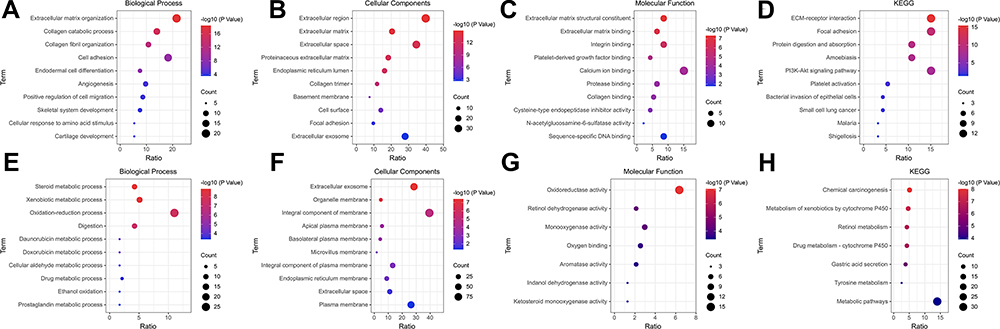 |
Figure 2 The top 10 significant terms in GO analysis (Biological Process, Cellular Components, and Molecular Function) and KEGG enrichment analysis of DEGs. (A–D) Down-regulated DEGs; (E–H) Up-regulated DEGs. Abbreviations: GO, Gene Ontology; KEGG, Kyoto Encyclopedia of Genes and Genomes; DEGs, differentially expressed genes. |
PPI Network and Module Analysis
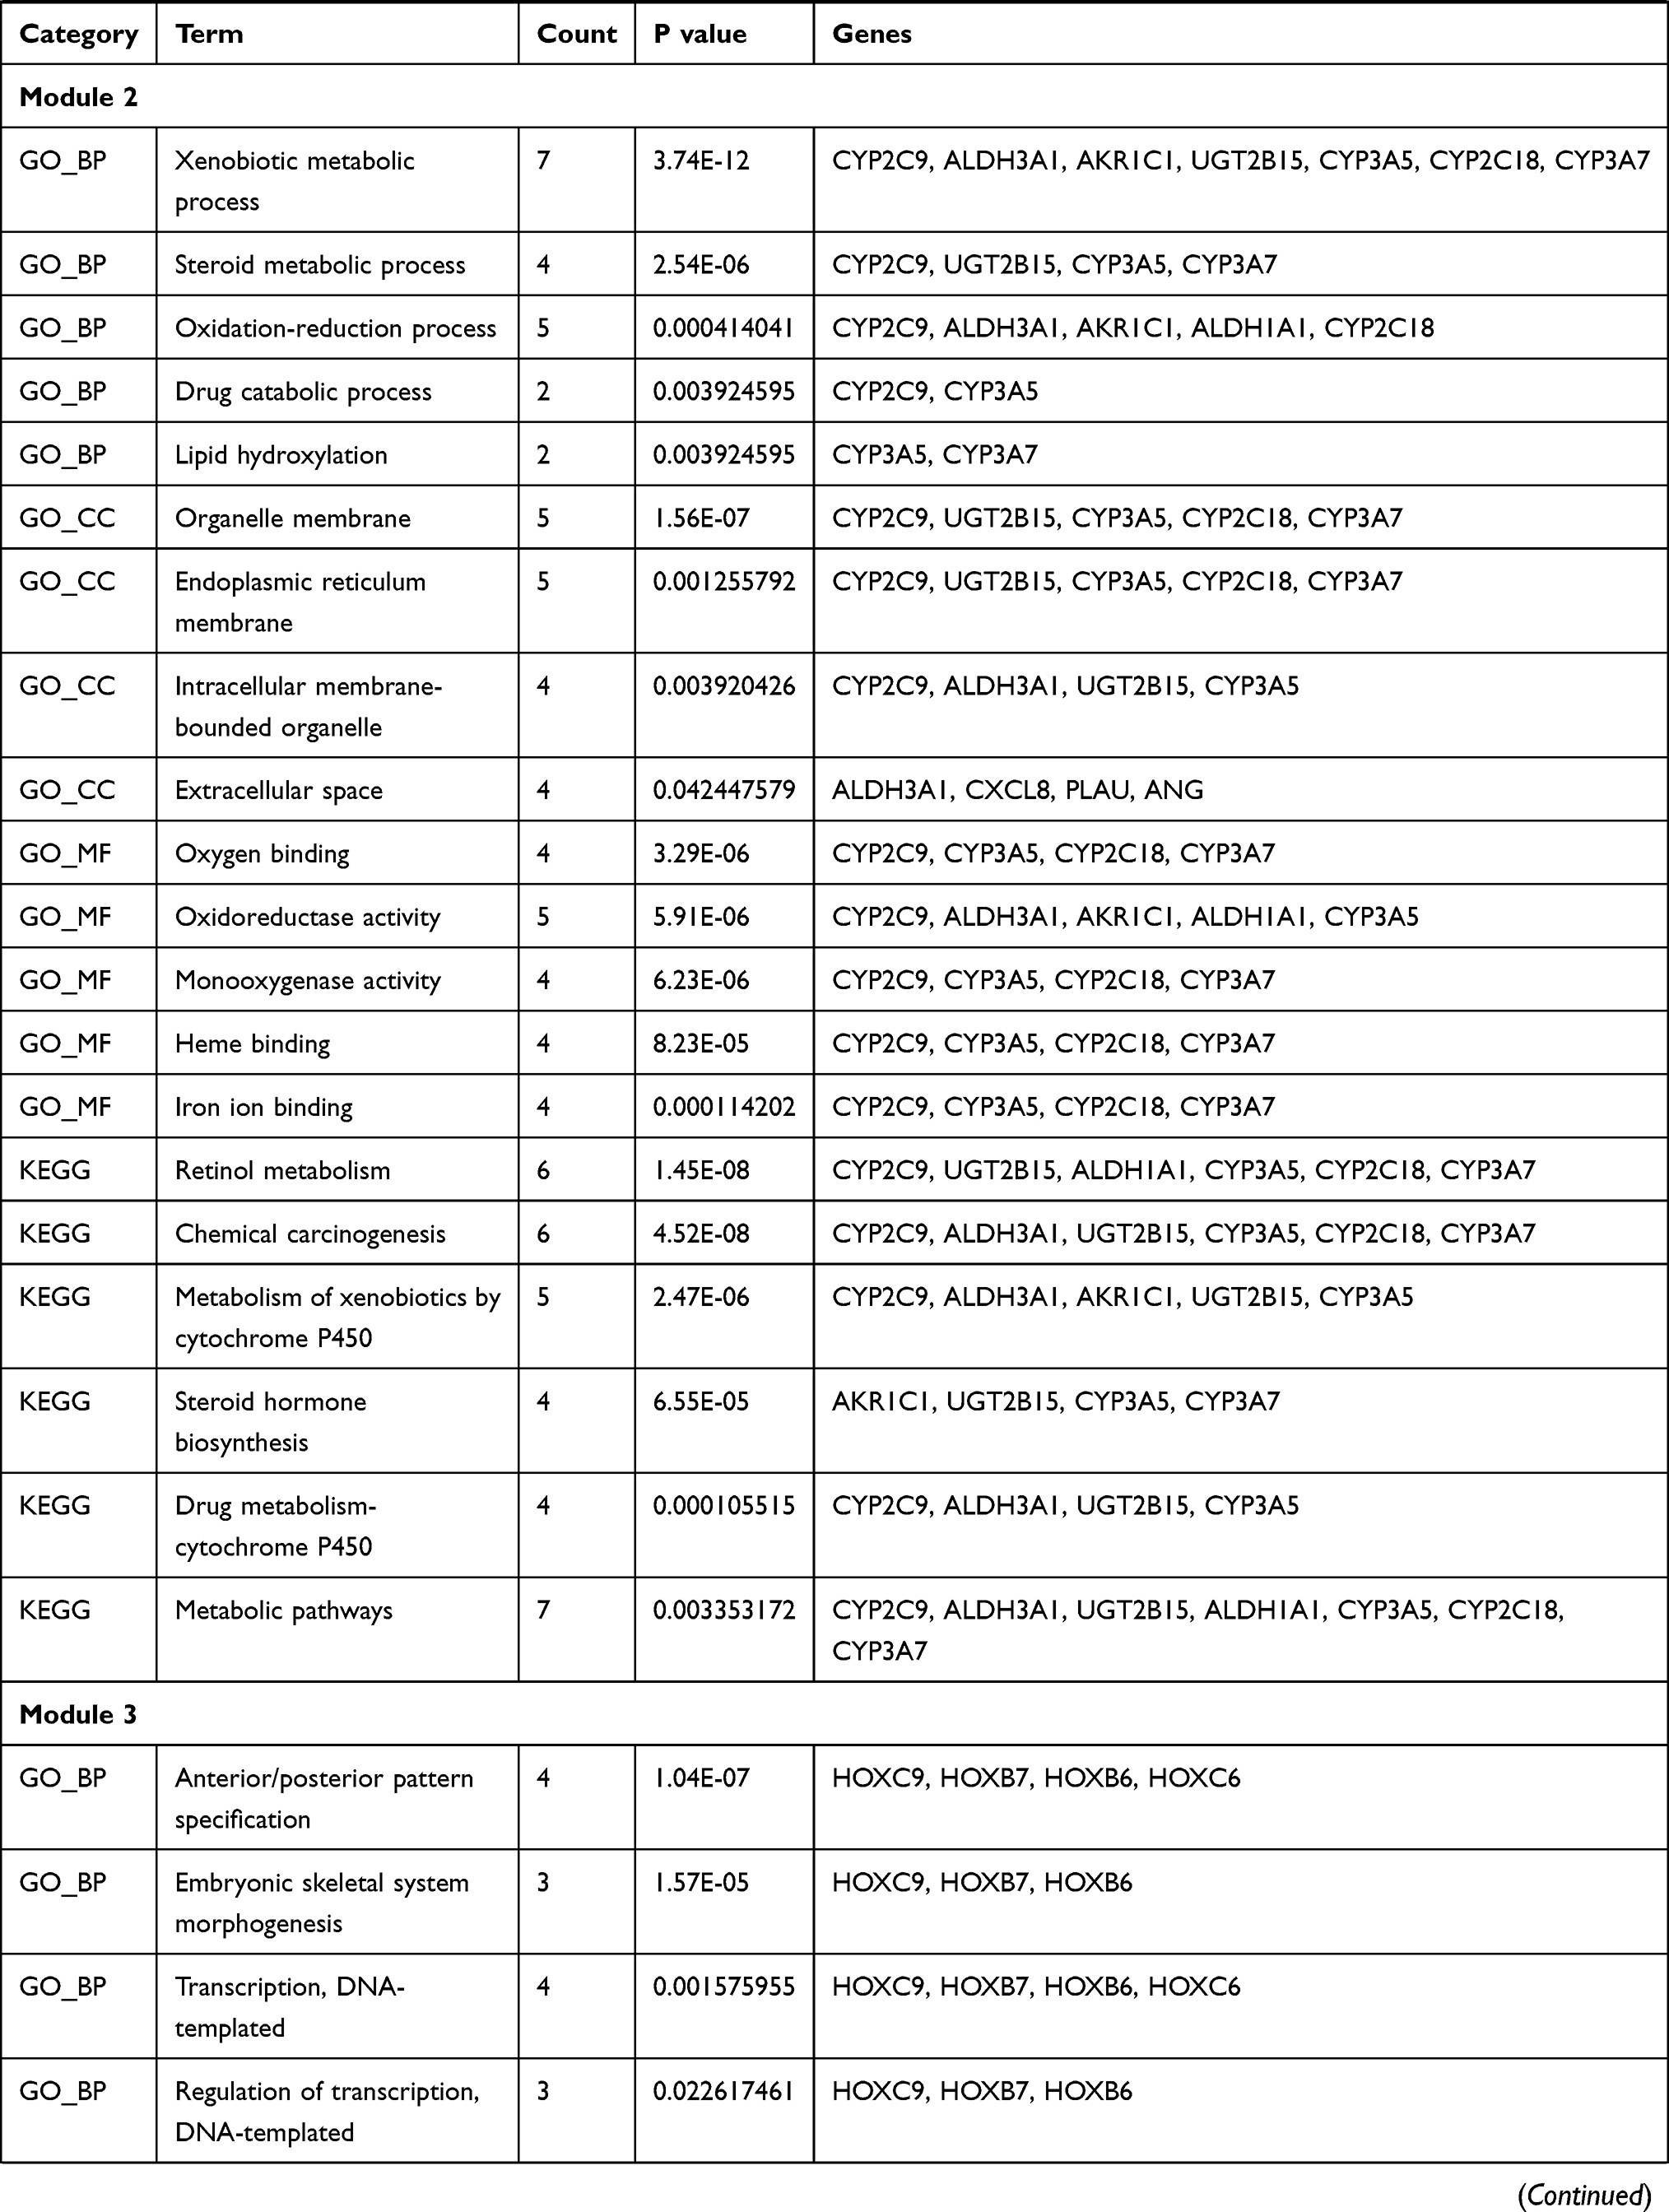
The PPI network contained 321 nodes and 664 edges, and its PPI enrichment P-value was lower than 1.0e-16 (Figure 3). In addition, an interaction network of 340 DEGs and their neighboring genes was also constructed (Figure 4A). According to the ranking of MCODE scores, we selected the top three modules for visualization (Figure 4B, module 1, MCODE score=16.111; Figure 4C, module 2, MCODE score=4.167; and Figure 4D, module 3, MCODE score=4). As shown in Figure 4B, module 1 consisted of 19 nodes and 145 edges. KEGG enrichment analysis showed that genes in module 1 were mainly enriched in ECM-receptor interaction, focal adhesion, protein digestion and absorption, PI3K-Akt signaling pathway, and amoebiasis pathway (Table 5). Module 2 consisted of 13 nodes and 25 edges (Figure 4C), with genes enriched in retinol metabolism, chemical carcinogenesis, metabolism of xenobiotics by cytochrome P450, steroid hormone biosynthesis, and drug metabolism-cytochrome P450 pathway (Table 5). Module 3 contained 4 nodes and 6 edges (Figure 4D), with no gene enriched in any pathway (Table 5). The PPI enrichment P-value of each module was lower than 0.05.
 |
 |
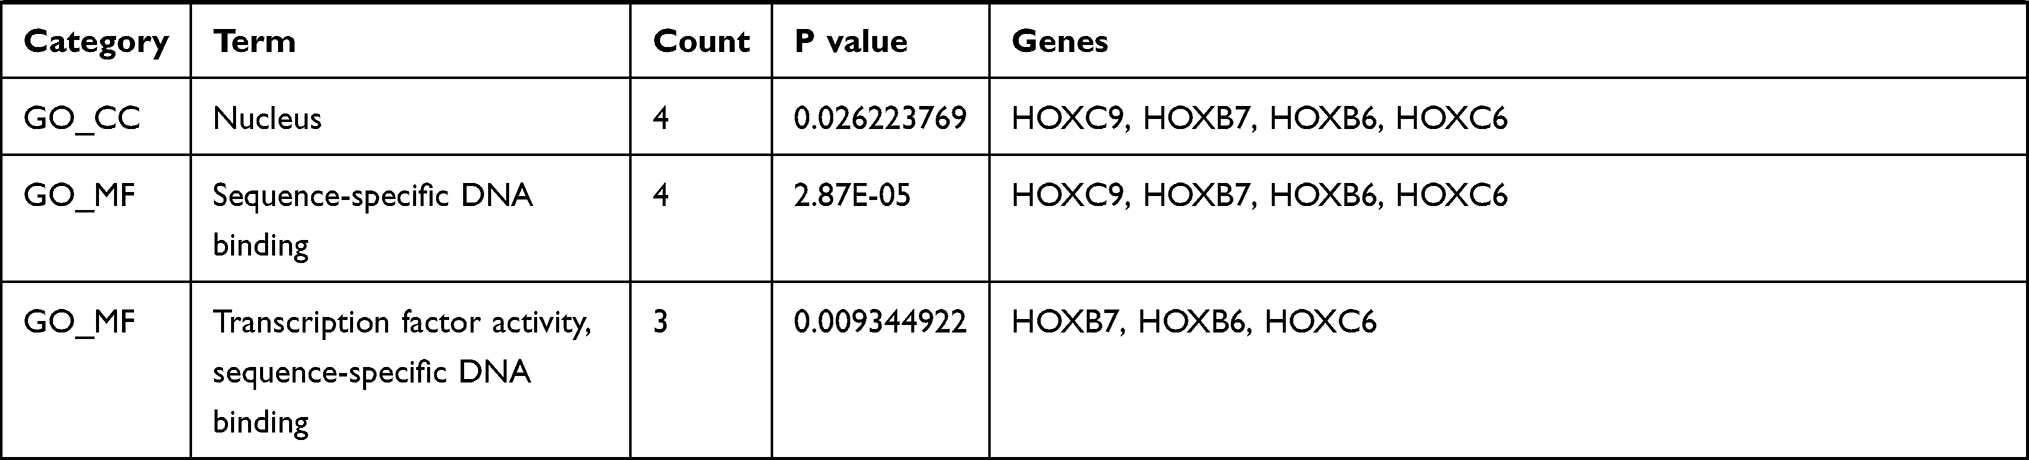 |
Table 5 GO (Gene Ontology) and KEGG (Kyoto Encyclopedia of Genes and Genomes) Enrichment Analysis of Each Module |
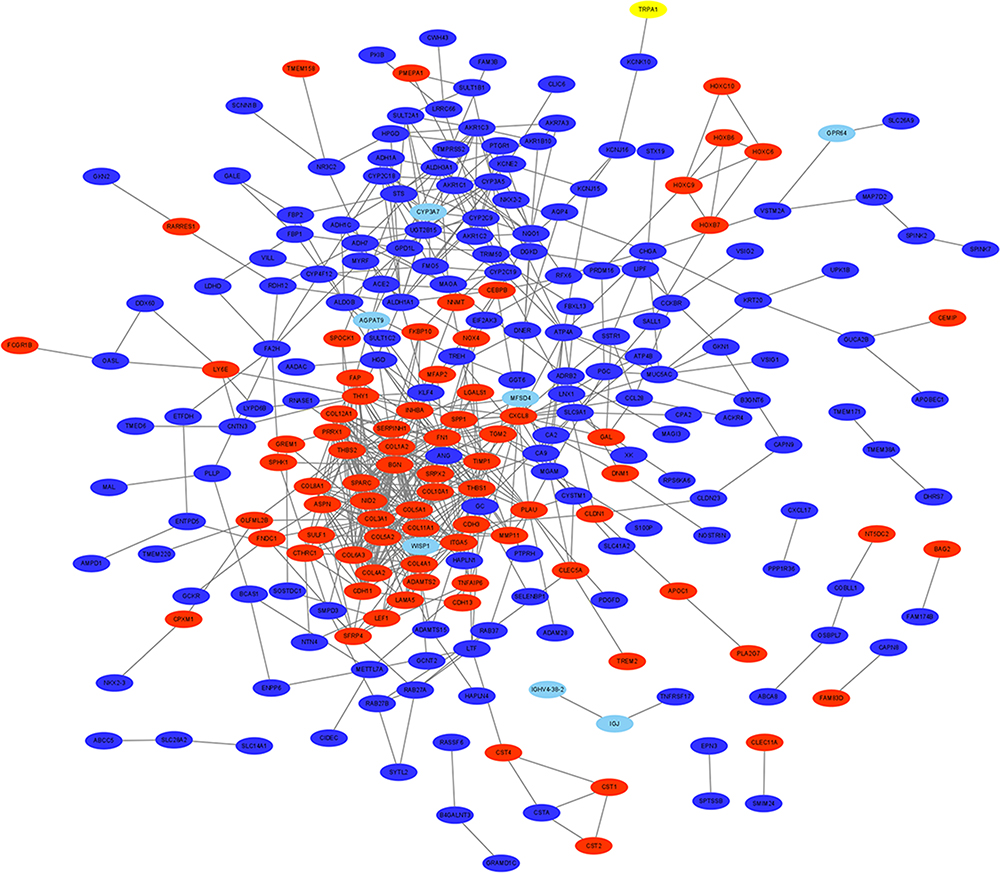 |
Figure 3 A PPI network of the 340 DEGs in GC. The red represents up-regulated genes, and the blue represents down-regulated genes. Abbreviations: PPI, protein–protein interaction; DEGs, differentially expressed genes; GC, gastric cancer. |
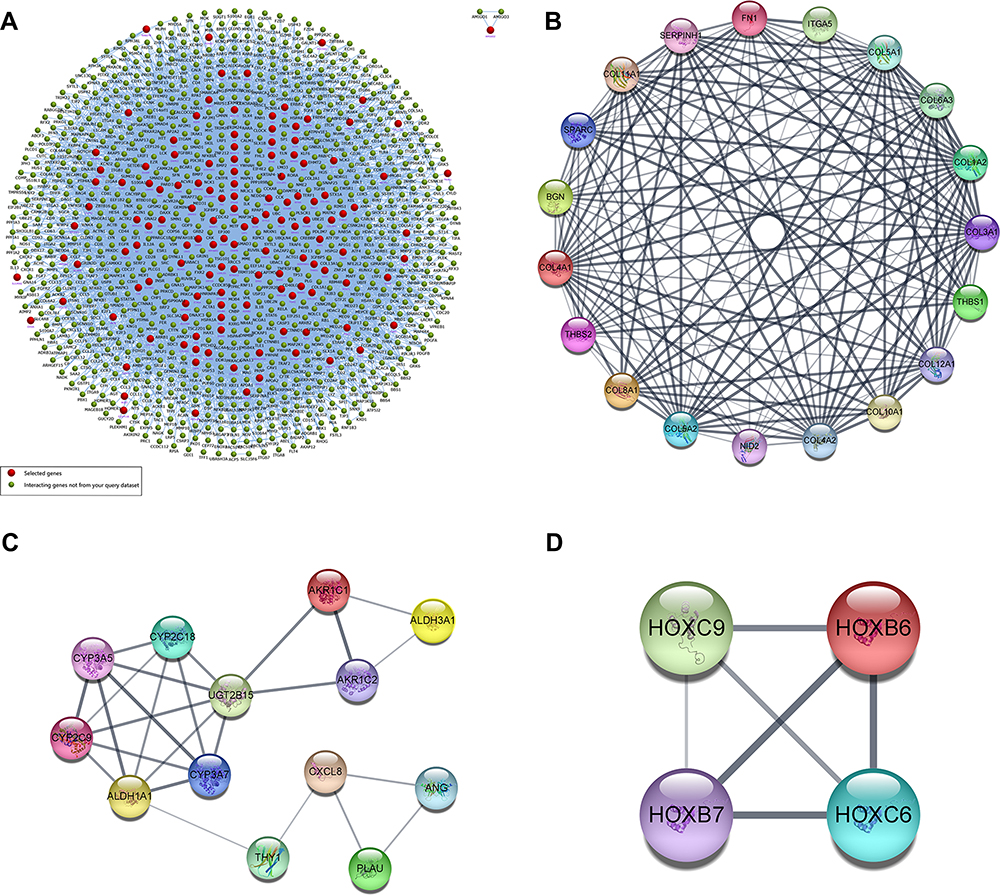 |
Figure 4 (A) Interaction network of the 340 DEGs and their neighboring genes. Red represents selected genes, and greed represents interacting genes. (B–D) The top 3 significant clusters of modules. Abbreviations: PPI, protein–protein interaction; DEGs, differentially expressed genes. |
Ten up-regulated genes (FN1, COL3A1, COL1A2, BGN, THBS2, COL5A2, THBS1, COL5A1, SPARC, and COL4A1) were identified as core genes based on the ranking of scores (Table 6). Furthermore, we also constructed a PPI network of hub genes with 10 nodes and 44 edges (Figure 5A) and interaction network between hub genes and their related genes (Figure 5B). The clustering coefficient of the PPI network was 0.978, and PPI enrichment P-value was lower than 1.0e-16.
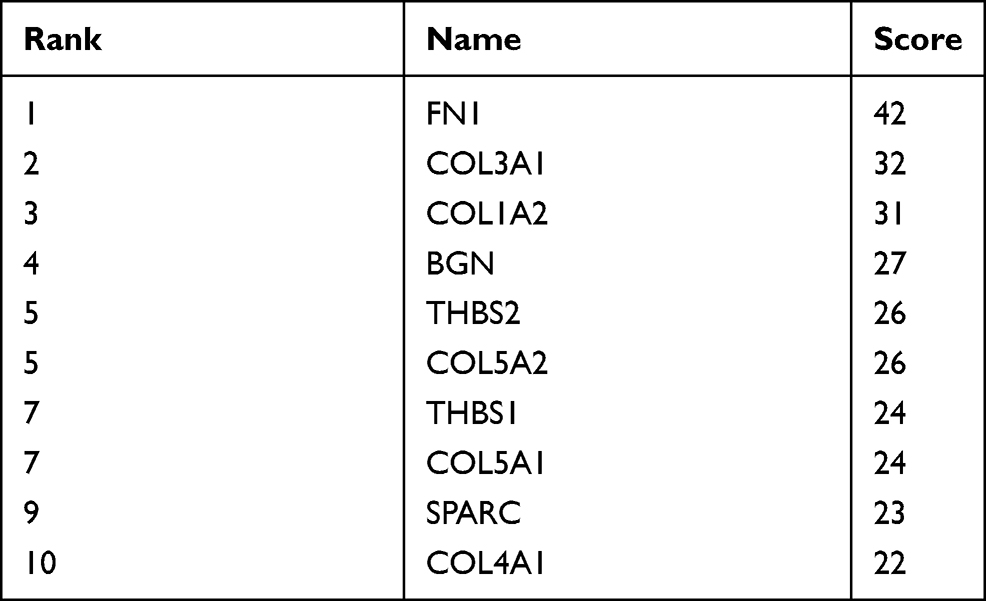 |
Table 6 Top 10 Hub Genes in the PPI Network Ranked by the Degree Method |
 |
Figure 5 (A) The interaction network of hub genes and their related genes. Red represents selected genes, and greed represents interacting genes. (B) PPI network of the hub genes constructed via the STRING online database. Abbreviations: PPI, protein–protein Interaction; STRING, Search Tool for the Retrieval of Interacting Genes/Proteins. |
Survival Analysis and Online Validation of Hub Gene Expression
As can be seen from the forest map (Figure 6A) and survival curve (Figure 6B–K) we constructed, among the 10 hub genes, 7 genes (FN1, COL1A2, BGN, THBS2, COL5A1, SPARC, COL4A1) were significantly associated with the OS of GC patients (Figure 6). High expression levels of all hub genes except COL3A1, COL5A2, and THBS1, were significantly related to poor OS in GC patients.
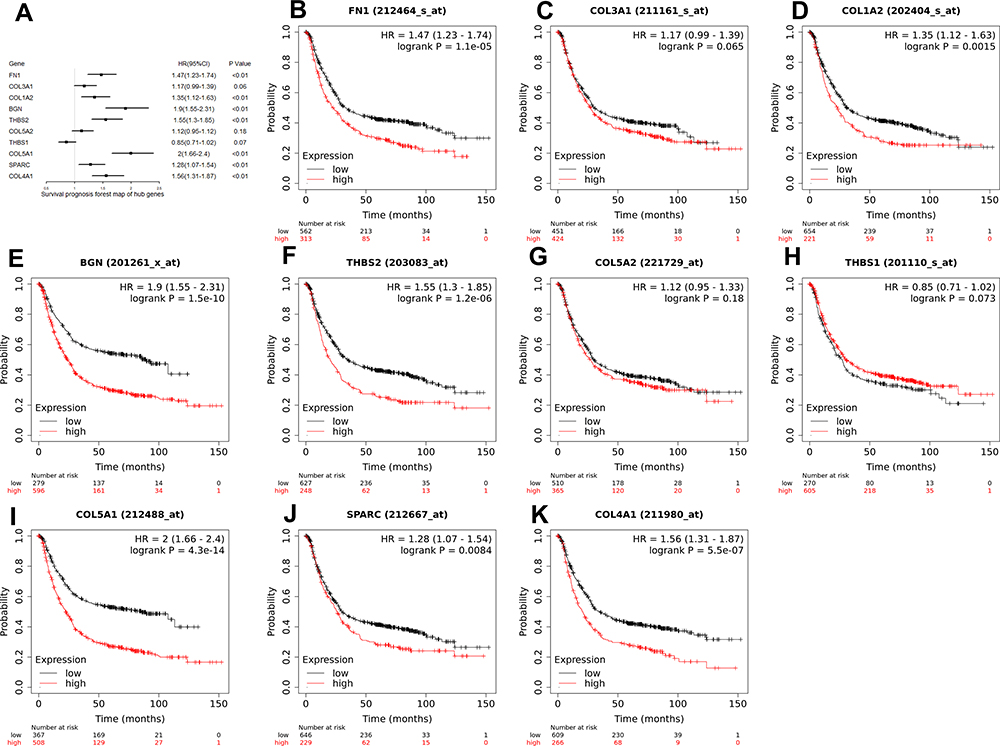 |
Figure 6 (A) A forest map of the 10 hub genes in all stages. 7 hub genes (FN1, COL1A2, BGN, THBS2, COL5A1, SPARC, and COL4A1) were significantly associated with the OS of GC patients. (B–K) The Kaplan-Meier survival curves of 10 hub genes. Abbreviations: OS, overall survival; GC, gastric cancer. |
Subsequently, genetic alteration information of the 10 hub genes was determined via cBioPortal, as illustrated in Figure 7. The genes COL1A2 and COL4A1 were altered most often (14% and 12%, respectively). These alterations included amplifications, missense mutations, deep deletions, truncating mutations, inframe mutations, and splice-site mutations (Figure 7A). Gene amplification is the most common of all types of genetic alterations (Figure 7B).
 |
Figure 7 (A) Genetic alteration information of the 10 hub genes. (B) Alterations in the 10 hub genes from datasets of GC in the TCGA database. Abbreviations: GC, gastric cancer; TCGA, The Cancer Genome Atlas. |
Additionally, we verified the relative expression levels of hub genes using gene expression profiles of GC and normal tissues in TCGA and GTEx. As shown in Figure 8A–J, except THBS1, the expression levels of other hub genes were significantly up-regulated in GC compared with normal tissues (P < 0.05). The expression of THBS1 in GC tissues was up-regulated, but the difference was not statistically significant (P > 0.05). We further analyzed the expression levels of hub genes in different stages of GC (Figure 9). There were significant variations in the expression levels of BGN [Pr (>F) < 0.001] (Figure 9A), COL1A2 [Pr (>F) = 0.004] (Figure 9B), COL3A1 [Pr (>F) = 0.001] (Figure 9C), COL5A1 [Pr (>F) = 0.012] (Figure 9E), COL5A2 [Pr (>F) = 0.049] (Figure 9F), SPARC [Pr (>F) = 0.015] (Figure 9H), THBS1 [Pr (>F) = 0.011] (Figure 9I), and THBS2 [Pr (>F) = 0.025] (Figure 9J) in GC patients from different stages. These results strongly suggest that the hub genes identified hub genes may play an important role in the GC progression.
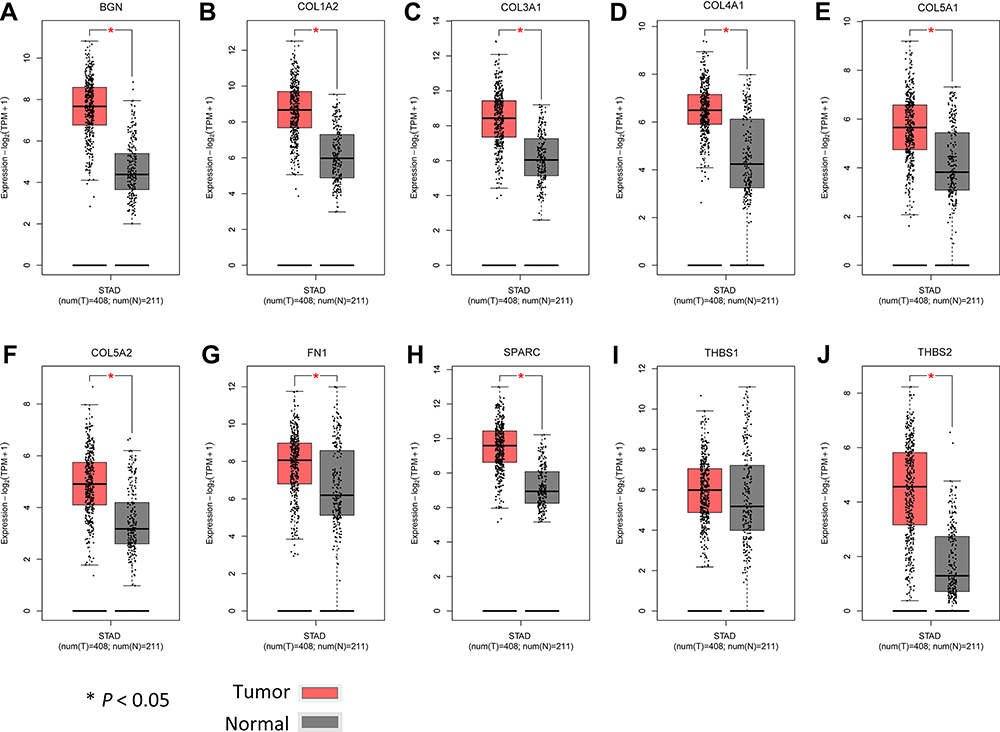 |
Figure 8 Comparison of expression levels of 10 hub genes in gastric cancer and normal tissues using the GEPIA2 database. We use red for gastric cancer tissues and gray for normal tissues. (A–J) respectively shows the BGN, COL1A2 COL3A1, COL4AI, COL5A1, COL5A2, FN1, SPARC, THBS1 and THBS2 expression level. Except for THBS1, the expression levels of the other nine hub genes in gastric cancer are significantly higher than those in normal tissues. Abbreviation: GEPIA2, Gene Expression Profiling Interactive Analysis 2. |
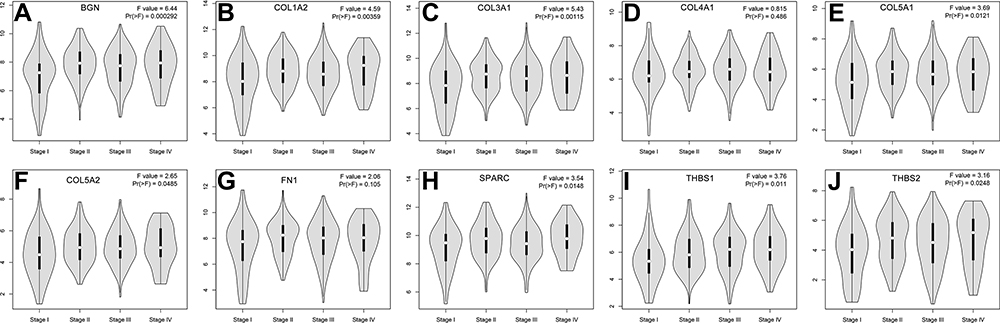 |
Figure 9 A comparison of expression levels of the 10 hub genes in different stages of GC. (A–J) respectively shows the BGN, COL1A2 COL3A1, COL4AI, COL5A1, COL5A2, FN1, SPARC, THBS1 and THBS2 expression level. There were significant variations in the expression levels of BGN (A), COL1A2 (B), COL3A1 (C), COL5A1 (E), COL5A2 (F), SPARC (H), THBS1 (I), and THBS2 (J) in GC patients from different stages. Abbreviation: GC, gastric cancer. |
Real-Time PCR and Immunohistochemistry
As shown in Figure 10A–N, immunohistochemical staining revealed that the expression of core genes in GC tissue was significantly higher than that in normal tissue. Statistical analysis confirmed that the relative expression levels in tumor tissues of mRNA of these 7 hub genes were significantly higher than in normal tissues (Figure 10O), and the average optical density (AOD) value of immunohistochemical staining was also significantly higher in tumor tissues (Figure 10P). The primer sequences used are shown in Table 7.
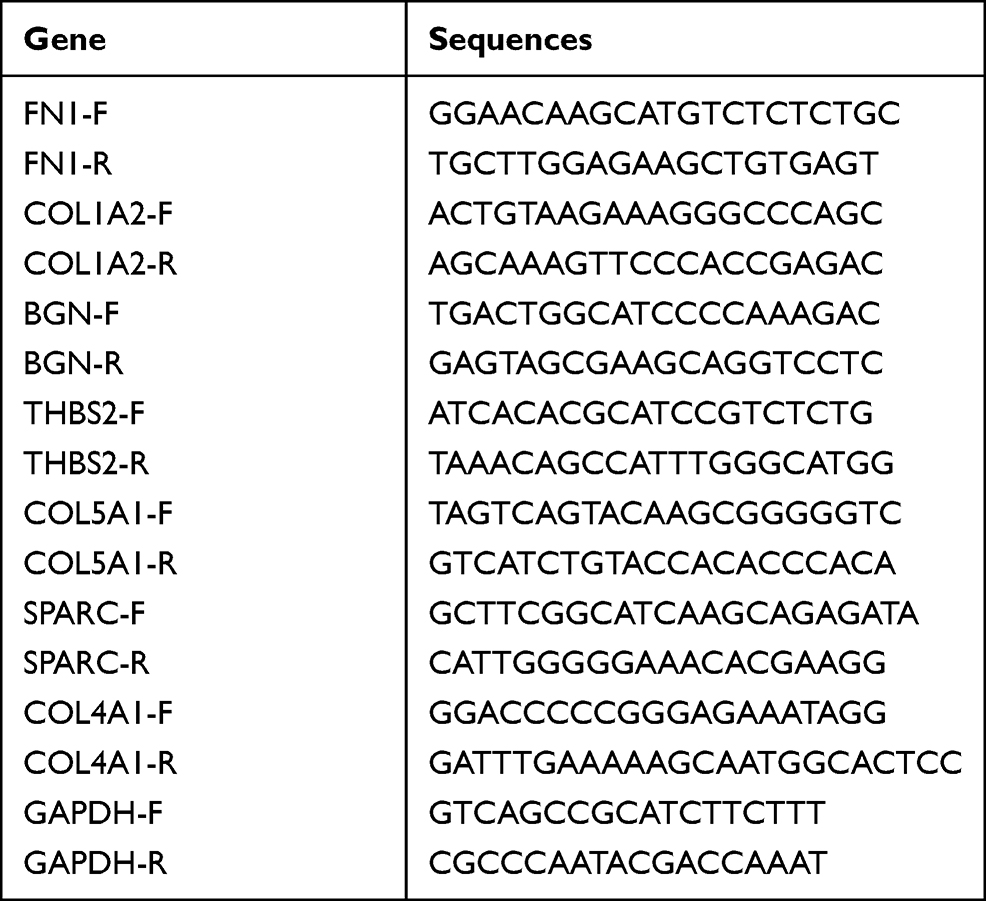 |
Table 7 Primer Sequences Used in PCR Experiments |
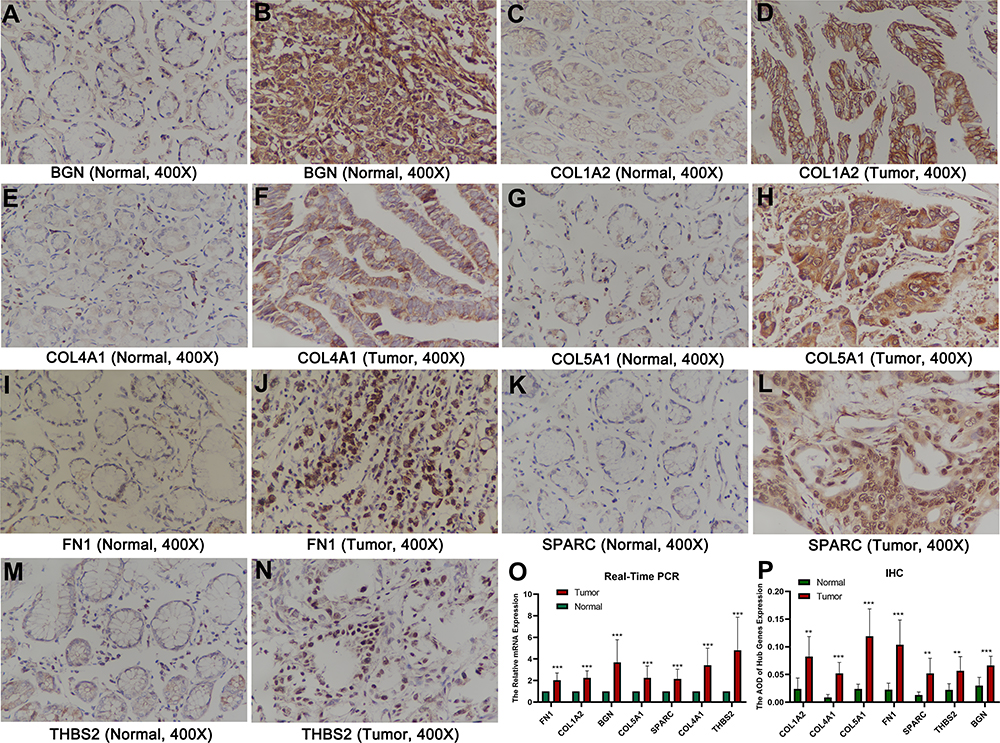 |
Figure 10 The results of real-time PCR and IHC. (A–N) IHC images of the 7 core genes in GC tissues and normal tissues under a 400 X microscope. (O) The relative hub gene mRNA levels in normal and GC tissues. (P) The AOD of hub genes expression. **P < 0.01; ***P < 0.001. Abbreviations: GC, gastric cancer; IHC, immunohistochemistry; AOD, average optical density. |
Diagnostic Value of Hub Genes Based on TCGA Data
A total of 348 GC patients were enrolled in the project. RNA sequencing data was available for 343 tumor tissue samples and 30 non-tumor tissue samples from 348 patients. We selected 7 hub genes with significant differences in survival analysis for diagnostic value evaluation. The ROC (receiver operating characteristic) curve (Figure 11) showed that these 7 hub genes had a high diagnostic value for GC: FN1 (AUC = 0.724, CI = 0.616–0.831), COL1A2 (AUC = 0.874, CI = 0.831–0.917), BGN (AUC = 0.949, CI = 0.925–0.973), THBS2 (AUC = 0.866, CI = 0.816–0.916), COL5A1 (AUC = 0.808, CI = 0.744–0.873), SPARC (AUC = 0.879, CI = 0.835–0.924), and COL4A1 (AUC = 0.861, CI = 0.783–0.939).
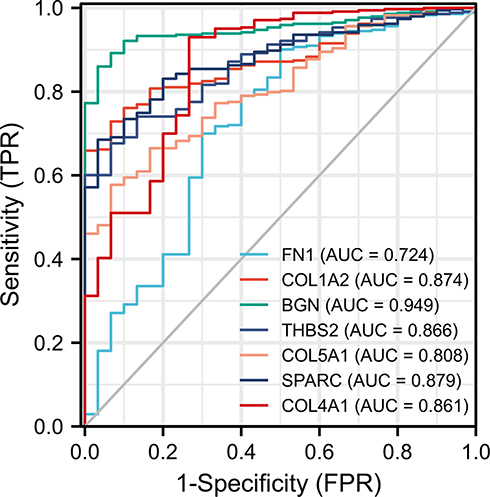 |
Figure 11 ROC curves of the 7 hub genes in the diagnosis of GC. Different colored curves represent the different core genes. Abbreviations: ROC, receiver operating characteristic; GC, gastric cancer. |
miRNA–mRNA Network
As illustrated in Figure 12, the miRNA-hub gene interaction network consists of 10 hub genes and 293 miRNAs. The four interactive hub genes that most miRNAs would target were THBS1 (degree score = 95), THBS2 (degree score = 81), COL4A1 (degree score = 42), and COL5A1 (degree score = 31). These were followed by COL1A2 (degree score = 30), SPARC (degree score = 21), COL3A1 (degree score = 11), BGN (degree score = 11), FN1 (degree score = 8), and COL5A2 (degree score = 7). Furthermore, hsa-miR-29b-3p (degree score = 6), hsa-miR-140-3p (degree, score = 5), hsa-miR-29a-3p (degree, score = 5), and hsa-miR-29c-3p (degree, score = 5) were the top four interactive miRNAs that targeted the most hub genes (Figure 12). Additionally, the detailed relationship between miRNAs and hub genes is shown in Table 8.
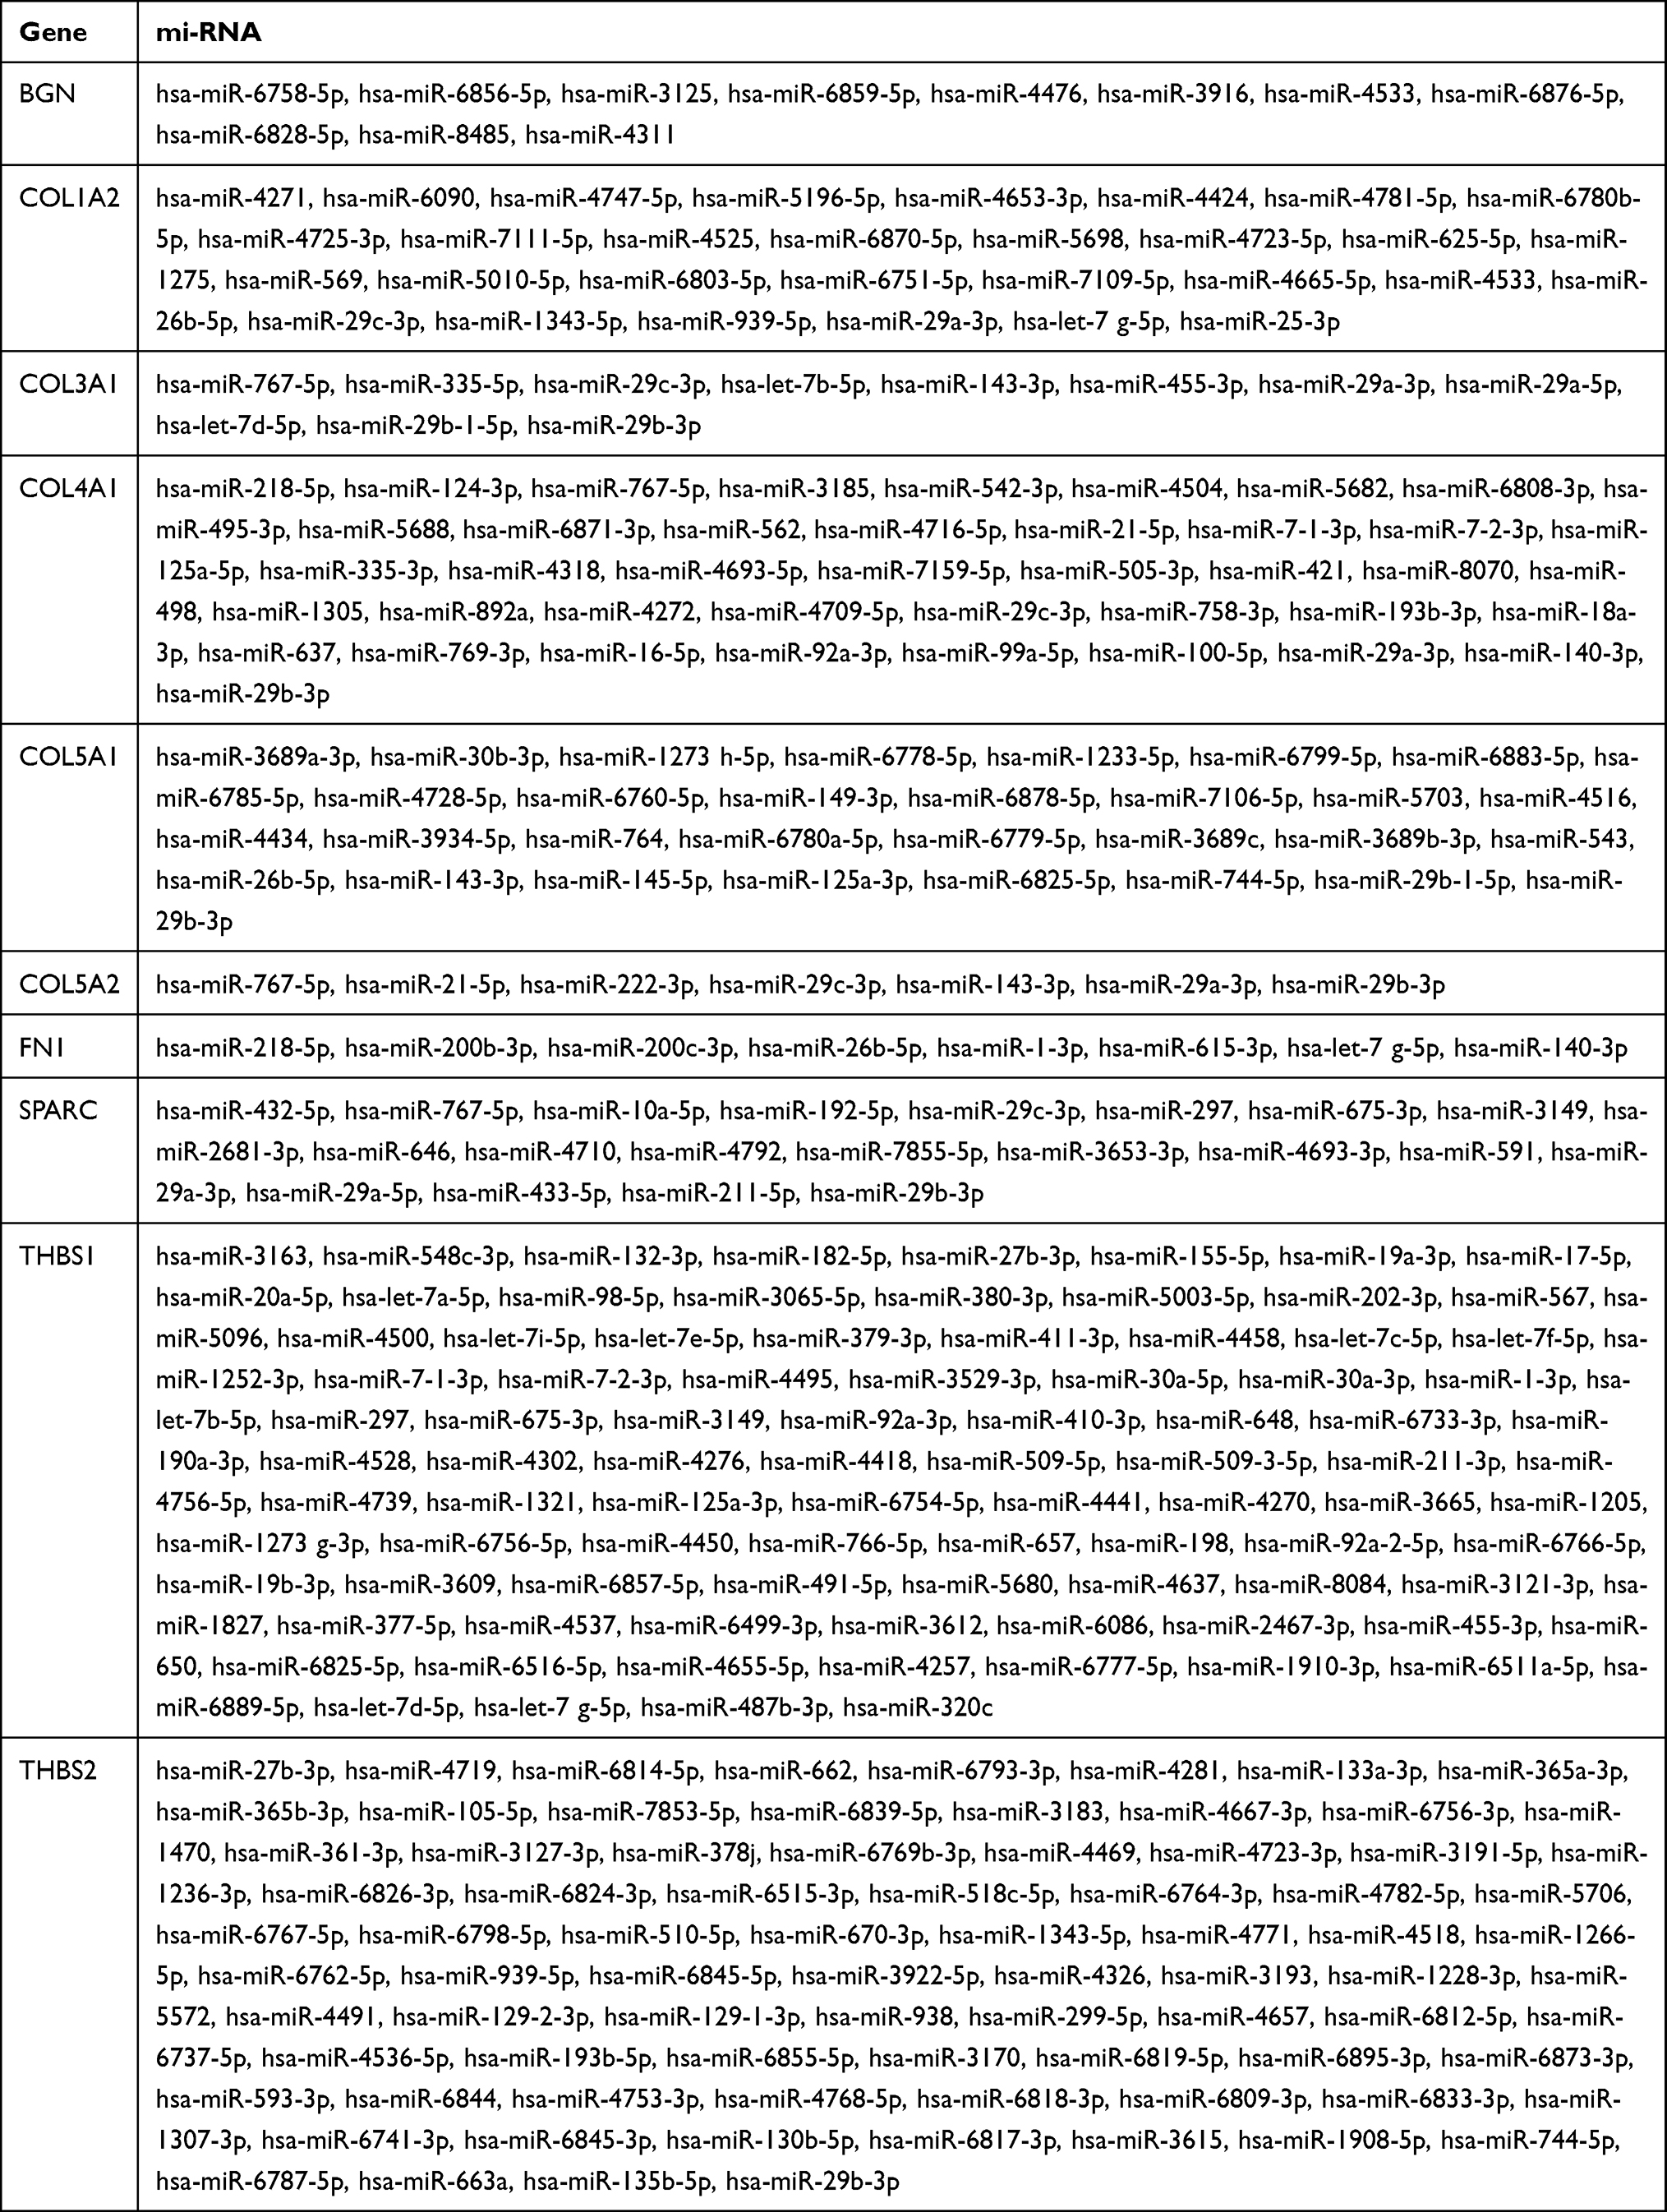 |
Table 8 The Respective miRNAs Targeting the 10 Hub Genes |
 |
Figure 12 The interaction network between hub genes and target miRNAs. Hub genes are presented in yellow circles, whereas target miRNAs are shown in green circles. The interaction between hub genes and their related miRNAs is shown in the form of arrows. |
Drug-Gene Interaction Analysis
A total of 14 drugs related to 8 genes were selected, and the relationships between them were visualized through Cytoscape (Figure 13). Based on the total score on the website, the top ten drugs with higher scores were selected. The results are shown in Table 9.
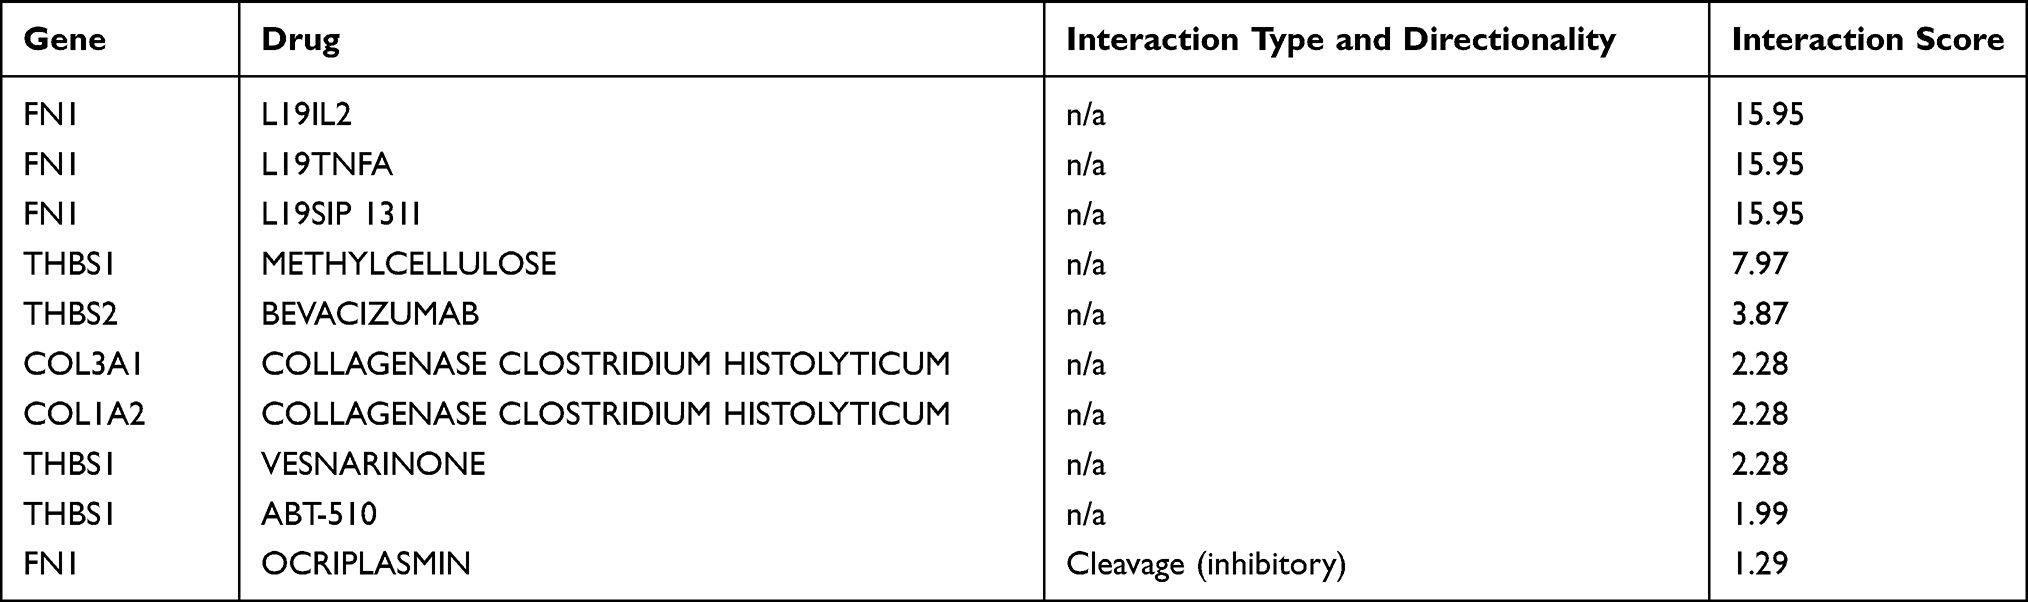 |
Table 9 Top 10 Drugs by Score Ranking in DGIdb |
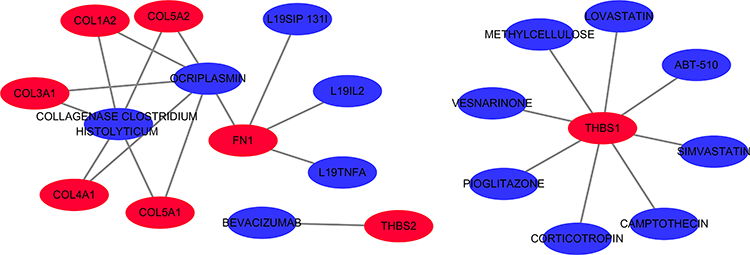 |
Figure 13 The 14 predicted drugs associated with the hub genes. Red represents hub genes and blue represents potential drugs. |
Discussion
Gastric Cancer remains the fifth most frequently diagnosed neoplasm and the third most deadly tumor in the world.14 With the rapid developments in molecular biology, leading to novel treatments, the current survival rate of GC patients has improved. However, there are certain limitations to treatment, and the outcome of patients is not always promising. Therefore, it is important to discover novel biomarkers and better understand the underlying molecular mechanisms to enable earlier diagnosis, treatment, and a better prognosis for GC patients. In recent years, with the rapid developments in the field of bioinformatics, more and more microarray and sequencing data can be obtained from online platforms, which provides a feasible way to discover new tumor-related diagnostic and therapeutic biomarkers.
In this study, three datasets for GC and normal tissue were downloaded from the GEO online database, and the differentially expressed genes were analyzed. A total of 340 common DEGs were identified, including 94 up-regulated and 246 downregulated genes. Subsequently, functional enrichment analysis of the DEGs was performed using the DAVID online tool. The top 3 significant terms from the GO enrichment analysis showed that the up-regulated DEGs were involved in the extracellular matrix organization, collagen catabolic process, and cell adhesion in the BP category. It is interesting to note that about 90% percent of tumor-related deaths are due to metastasis.15 Collagen is the main component of the extracellular matrix and interstitial microenvironment. It provides a scaffold for the growth of tumor cells and induces their migration.16 Jang et al have reported that collagen synthesis increases significantly in GC tissue.17 Additionally, changes in cell-cell adhesion and cell-matrix adhesion promote the chances of metastasis of the tumor cell.18 Collagen components are qualitatively and quantitatively reorganized in the tumor microenvironment. Collagen width has been identified as a useful prognostic indicator for GC.19 For KEGG pathway enrichment analysis, the up-regulated DEGs were enriched in ECM-receptor interaction, focal adhesion, and protein digestion and absorption. The structural integrity of ECM is crucial to maintain the normal and healthy activity of cells.20 Several studies have identified that the ECM plays an important role in various biological processes associated with tumor development, such as escaping apoptosis, cell growth regulation, tumor angiogenesis, invasion of cells, and metastasis.21–24 Thus, studying the remodeling of ECM that occurs in GC patients could lead to the discovery of potential therapeutic targets.
The degree of connectivity of a gene in a PPI network reflects its association with GC. In this study, a PPI network of 340 DEGs was constructed that included 321 nodes and 664 edges, and 10 hub genes were identified based on the highest degrees of connectivity. Subsequently, survival analysis of these hub genes was done, and it demonstrated that 7 hub genes (FN1, COL1A2, BGN, THBS2, COL5A1, SPARC, COL4A1) were significantly associated with the OS of GC patients. Then, the expression levels of these hub genes in tumor and normal tissues were compared through the GEPIA2 database. The results were consistent with those from the GEO database. PCR and IHC also confirmed that, compared with normal tissues, the expression levels of all hub genes were significantly higher in GC tissue. It is reasonable to hypothesize that these hub genes play an important role in the occurrence and development of GC. The prognostic value of hub genes was also evaluated based on data from TCGA. The ROC curve showed that 7 hub genes had a high diagnostic value for GC. Although a large number of studies have already shown that these hub genes are associated with the diagnosis and prognosis of GC, their underlying molecular mechanisms have not yet been fully clarified.
The SPARC gene encodes a cysteine-rich acidic matrix-associated protein which is required for collagen formation and is also involved in extracellular matrix synthesis and promotion of changes in cell shape.25 Previous studies have shown that the SPARC protein is associated with a variety of cancers, including GC;26 It may affect GC metastasis by regulating changes in the tumor microenvironment.27 These findings support the accuracy of our bioinformatics analyses to a certain extent.
The FN1 gene encodes fibronectin, a glycoprotein found as either a dimer or a polymer on the cell surface and in the extracellular matrix. Studies have shown that FN1 is associated with a variety of tumor types and that its expression is higher in tumor tissues.28–30 The FN1 protein probably interacts with vascular endothelial growth factor A and plays an important role in the development of non-small cell lung cancer (NSCLC). Hence, it can be used as a diagnostic or therapeutic target for NSCLC patients.31 However, no relevant studies on FN1 have been done in GC patients to date. Our study shows that the downregulation of FN1 is associated with better overall survival in GC patients. Furthermore, we identified 8 potential miRNAs (hsa-miR-218-5p, hsa-miR-200b-3p, hsa-miR-200c-3p, hsa-miR-26b-5p, hsa-miR-1-3p, hsa-miR-615-3p, hsa-let-7 g-5p, and hsa-miR-140-3p) that might be targets for FN1.
The THBS1 gene encodes thromboplastin 1, which is involved in angiogenesis and tumor progression, and its increased expression significantly correlates with tumor differentiation.32 Elevated expression of THBS1 protein has been associated with tumor growth and lymph node metastasis in GC patients.33 Interestingly, in this study, Kaplan-Meier’s plots showed that THBS1 overexpression was not an adverse prognostic factor for overall survival in patients with GC. Therefore, further studies on the effect of THBS1 on GC are needed.
Thromboplastin 2 (THBS2) is a member of the thromboplastin family of proteins that mediates the cell-cell and cell-matrix interactions. Overexpression of THBS2 has been associated with poor survival in patients with lung adenocarcinoma.34 THBS2 expression was also significantly correlate with the TNM stage, AJCC stage, and clinical outcome (P < 0.05). It may also be an important prognostic indicator of colorectal cancer.35 Previous studies have found that the expressions of TGF-β and THBS2 in GC cells are in a time-dependent relationship with the survival of patients,36 suggesting that THBS2 may affect PI3K by up-regulating the TGF-β signaling pathway.
BGN is a class I gene of the small-leucine-rich-proteoglycan (SLRP) family and encodes a leucine repeat-rich protein with a molecular weight of 42 kDa. BGN has been reported to be up-regulated in several cancer types and associated with tumor progression and worsening patient prognosis,37–39 which is consistent with our findings. As a potential new prognostic biomarker for GC, BGN can be easily translated into the clinical setting and provides an opportunity to develop new therapies.
The COL family of genes is involved in the interactions of the ECM-receptor and local adhesion pathway, which play an important role in the invasion and metastasis of tumors. Collagen, laminin, and fibronectin are major components of the extracellular matrix, which provides the matrix for cancer cell growth, survival, and migration.40 Studies have shown that the COL1A2 mRNA levels are related to the histological types and lymph node status of GC, and may be involved in the invasion, metastasis, and carcinogenesis of GC.41,42 All of these previous findings support the accuracy of our results. In addition, the expression of COL5A2 is also closely related to the occurrence and development of colon cancer.43 Overexpression of COL3A1 has been confirmed in a variety of cancers, such as bladder cancer,44,45 but the effect of its expression levels in GC is not fully understood. COL5A1 has been reported to be closely associated with breast cancer,46 lung adenocarcinoma,47 oral squamous cell carcinoma,48 and GC.49 High expression of COL4A1 was found to be associated with an advanced tumor stage and poor overall survival in patients with hepatocellular carcinoma.50 Furthermore, in breast cancer cells, COL4A1 knockout resulted in reduced cell viability and cell cycle arrest.51 In this study, we found that COL1A2, COL3A1, COL4A1, COL5A1, and COL5A2 were significantly overexpressed in GC tissue, which is consistent with the TCGA results, indicating that the COL family of genes could make good biomarker panels for GC diagnosis.
With the help of the DGIdb database, a total of 14 drugs with potential therapeutic effects on GC were identified. The top 10 drugs among these, based on the website’s total score, were L19IL2, L19TNFA, L19SIP 131I, methylcellulose, bevacizumab, collagenase clostridium histolyticum, vesnarinone, ABT-510, and ocriplasmin. These drugs were mainly related to genes FN1, COL3A1, COL1A2, THBS2, COL5A2, THBS1, COL5A1, and COL4A1. The ability of the L19 antibody to preferentially target tumor sites has been widely demonstrated using nuclear medicine procedures with the preparation of radiologically labeled antibodies. L19IL2 is a recombinant fusion protein, containing the L19 antibody in diabody format fused to human IL2.52 In a study of the treatment of advanced metastatic melanoma, it was found that the use of L19IL2 in combination with dacarbazine (DTIC) significantly improved the overall response rates and median progression-free survival, as compared to the use of DTIC alone.53 The use of radioimmunotherapy with 131I-L19SIP has been reported to induce a sustained partial response in patients with relapsed Hodgkin’s lymphoma.54 L19-TNFα/L19-IL2 combination therapy could eradicate tumors in myeloma mice through TNFα-induced tumor necrosis and L19-TNFα/L19-IL2-mediated local cellular immune response.55 Surfactant-free solubilization of docetaxel is an efficient method for insoluble drug delivery to enhance the antitumor effect.56 Bevacizumab is expected to remain a key agent in cancer therapy, both due to its established efficacy in approved indications and its promise as a partner in novel targeted combination treatments.57 Combined bevacizumab can significantly reduce the risk of progression of advanced tumors and improve the overall survival rate in cases of metastatic colorectal cancer,58 non-small cell lung cancer,59 and renal cell carcinoma.60 Vesnarinone is a unique anti-proliferating, differentiation-inducing, and apoptosis-inducing drug against several human malignancies, including leukemia and several solid tumors.61 ABT-510 is a small mimetic peptide of a natural anti-angiogenic compound called thromboreactive protein-1. It has been shown to significantly reduce tumor growth and burden in preclinical mouse models and in naturally occurring dog tumors.62 Additionally, ABT-510 induced tumor cell apoptosis and inhibited ovarian tumor growth in an orthotopic, syngeneic model of epithelial ovarian cancer.62 It is interesting to note that all the above-mentioned drugs are gene-related and obtained through database predictions. They provide us with new potential strategies for the treatment of cancers. However, to determine whether they can be used in GC treatment, we need more experiments and clinical verification.
Conclusions and Limitations
In this study, we have successfully screened 10 hub genes associated with GC using the GEO database and bioinformatics analyses and have established that 7 of these genes were associated with poor cancer prognosis. We have also studied the mRNA and protein expression levels through real-time PCR and IHC experiments. We demonstrated that searching for drugs related to these hub genes in the DGIdb has provided new insights for GC treatment. However, this study has some limitations. Due to the lack of further experimental studies and validation, we cannot explain exactly how the hub gene-miRNAs networks and therapeutic drugs play a role in the diagnosis and treatment of GC. Due to the short follow-up time and a small number of patients (n = 60), clinicopathological data could not be analyzed conclusively. This issue will be addressed in future research.
In summary, identifying the hub genes, miRNA–mRNA network, and potential candidate drugs associated with GC provides new insights into the molecular mechanisms and treatment of GC.
Data Sharing Statement
All data in the study is available from the submitting author, Shiyu Zhang.
Ethics Approval and Written Informed Consent
The study has been approved by the Ethics Committee of the First Affiliated Hospital of Guangxi Medical University (No. 2021 KY-E-188) and the First People’s Hospital of Suqian (No. 2020-SL-0093). All participating gastric cancer patients were informed of the study purpose and signed informed consent forms.
Consent for Publication
All authors agree to the publication of all texts, images and tables in this study.
Funding
All funding for this study was provided by the National Natural Science Foundation of China (81970558) and Guangxi Natural Science Foundation (2020GXNSFAA259095).
Disclosure
All authors state that they have no potential conflicts of interest in this work.
References
1. Arai HN, Akajima TE. Recent developments of systemic chemotherapy for gastric cancer. Cancers (Basel). 2020;12(5):1100. doi:10.3390/cancers12051100
2. Magnelli L, Schiavone N, Staderini F, et al. MAP kinases pathways in gastric cancer. Int J Mol Sci. 2020;21:2893. doi:10.3390/ijms21082893
3. Ashrafizadeh M, Rafiei H, Mohammadinejad R, et al. Wnt-regulating microRNAs role in gastric cancer malignancy. Life Sci. 2020;250:117547. doi:10.1016/j.lfs.2020.117547
4. Ashrafizadeh M, Zarrabi A, Orouei S, et al. STAT3 pathway in gastric cancer: signaling, therapeutic targeting and future prospects. Biology (Basel). 2020;9. doi:10.3390/biology9060126
5. Kumar V, Soni P, Garg M, et al. Emerging therapies in the management of advanced-stage gastric cancer. Front Pharmacol. 2018;9:404. doi:10.3389/fphar.2018.00404
6. Oh SC, Sohn BH, Cheong JH, et al. Clinical and genomic landscape of gastric cancer with a mesenchymal phenotype. Nat Commun. 2018;9:1777. doi:10.1038/s41467-018-04179-8
7. Meng LB, Shan MJ, Qiu Y, et al. TPM2 as a potential predictive biomarker for atherosclerosis. Aging (Albany NY). 2019;11:6960–6982. doi:10.18632/aging.102231
8. Sun CC, Zhou Q, Hu W, et al. Transcriptional E2F1/2/5/8 as potential targets and transcriptional E2F3/6/7 as new biomarkers for the prognosis of human lung carcinoma. Aging (Albany NY). 2018;10:973–987. doi:10.18632/aging.101441
9. Pfeifer SP. From next-generation resequencing reads to a high-quality variant data set. Heredity. 2017;118:111–124. doi:10.1038/hdy.2016.102
10. Owzar K, Barry WT, Jung SH, et al. Statistical challenges in preprocessing in microarray experiments in cancer. Clin Cancer Res. 2008;14:5959–5966. doi:10.1158/1078-0432.CCR-07-4532
11. Huber W, Carey VJ, Gentleman R, et al. Orchestrating high-throughput genomic analysis with bioconductor. Nat Methods. 2015;12:115–121. doi:10.1038/nmeth.3252
12. Ritchie ME, Phipson B, Wu D, et al. limma powers differential expression analyses for RNA-sequencing and microarray studies. Nucleic Acids Res. 2015;43:e47–e47. doi:10.1093/nar/gkv007
13. Ginestet C. ggplot2: elegant graphics for data analysis. J R Stat Soc A Stat. 2011;174:245. doi:10.1111/j.1467-985X.2010.00676_9.x
14. Rawla P, Barsouk A. Epidemiology of gastric cancer: global trends, risk factors and prevention. Prz Gastroenterol. 2019;14:26–38. doi:10.5114/pg.2018.80001
15. Gilkes DM, Semenza GL, Wirtz D. Hypoxia and the extracellular matrix: drivers of tumour metastasis. Nat Rev Cancer. 2014;14:430–439. doi:10.1038/nrc3726
16. Climent M, Pera M, Aymar I, et al. Bone health in long-term gastric cancer survivors: a prospective study of high-dose vitamin D supplementation using an easy administration scheme. J Bone Miner Metab. 2018;36:462–469. doi:10.1007/s00774-017-0856-1
17. Jang M, Koh I, Lee SJ, et al. Droplet-based microtumor model to assess cell-ECM interactions and drug resistance of gastric cancer cells. Sci Rep. 2017;7:41541. doi:10.1038/srep41541
18. Liu X, Chu KM. E-cadherin and gastric cancer: cause, consequence, and applications. Biomed Res Int. 2014;2014:637308. doi:10.1155/2014/637308
19. Zhou ZH, Ji CD, Xiao HL, et al. Reorganized collagen in the tumor microenvironment of gastric cancer and its association with prognosis. J Cancer. 2017;8:1466–1476. doi:10.7150/jca.18466
20. Giussani M, Triulzi T, Sozzi G, et al. Tumor extracellular matrix remodeling: new perspectives as a circulating tool in the diagnosis and prognosis of solid tumors. Cells. 2019;8:81. doi:10.3390/cells8020081
21. Pickup MW, Mouw JK, Weaver VM. The extracellular matrix modulates the hallmarks of cancer. EMBO Rep. 2014;15:1243–1253. doi:10.15252/embr.201439246
22. Eble JA, Niland S. The extracellular matrix in tumor progression and metastasis. Clin Exp Metastasis. 2019;36:171–198. doi:10.1007/s10585-019-09966-1
23. Poltavets V, Kochetkova M, Pitson SM, et al. The role of the extracellular matrix and its molecular and cellular regulators in cancer cell plasticity. Front Oncol. 2018;8:431. doi:10.3389/fonc.2018.00431
24. Malik R, Lelkes PI, Cukierman E. Biomechanical and biochemical remodeling of stromal extracellular matrix in cancer. Trends Biotechnol. 2015;33:230–236. doi:10.1016/j.tibtech.2015.01.004
25. Morrissey MA, Jayadev R, Miley GR, et al. SPARC promotes cell invasion in vivo by decreasing type IV collagen levels in the basement membrane. PLoS Genet. 2016;12:e1005905. doi:10.1371/journal.pgen.1005905
26. Inoue M, Senju S, Hirata S, et al. Identification of SPARC as a candidate target antigen for immunotherapy of various cancers. Int J Cancer. 2010;127:1393–1403. doi:10.1002/ijc.25160
27. Mo A, Yang SW, Jiang YX, et al. Role of secreted protein acidic in hematogenous metastasis of gastric cancer. Eur Rev Med Pharmacol Sci. 2017;21:4311–4321.
28. Cai X, Liu C, Zhang TN, et al. Down-regulation of FN1 inhibits colorectal carcinogenesis by suppressing proliferation, migration, and invasion. J Cell Biochem. 2018;119:4717–4728. doi:10.1002/jcb.26651
29. Wang J, Deng L, Huang J, et al. High expression of Fibronectin 1 suppresses apoptosis through the NF-kappaB pathway and is associated with migration in nasopharyngeal carcinoma. Am J Transl Res. 2017;9:4502–4511.
30. Yang X, Hu Q, Hu LX, et al. miR-200b regulates epithelial-mesenchymal transition of chemo-resistant breast cancer cells by targeting FN1. Discov Med. 2017;24:75–85.
31. Wang Y, Huang L, Wu S, et al. Bioinformatics analyses of the role of vascular endothelial growth factor in patients with non-small cell lung cancer. PLoS One. 2015;10:e0139285. doi:10.1371/journal.pone.0139285
32. Hong BB, Chen SQ, Qi YL, et al. Association of THBS1 rs1478605 T>C in 5ʹ-untranslated regions with the development and progression of gastric cancer. Biomed Rep. 2015;3:207–214. doi:10.3892/br.2015.414
33. Lin XD, Chen SQ, Qi YL, et al. Overexpression of thrombospondin-1 in stromal myofibroblasts is associated with tumor growth and nodal metastasis in gastric carcinoma. J Surg Oncol. 2012;106:94–100. doi:10.1002/jso.23037
34. Tian Q, Liu Y, Zhang Y, et al. THBS2 is a biomarker for AJCC stages and a strong prognostic indicator in colorectal cancer. J BUON. 2018;23:1331–1336.
35. Peng HY, Chang MC, Hu CM, et al. Thrombospondin-2 is a highly specific diagnostic marker and is associated with prognosis in pancreatic cancer. Ann Surg Oncol. 2019;26:807–814. doi:10.1245/s10434-018-07109-6
36. Kim H, Watkinson J, Varadan V, et al. Multi-cancer computational analysis reveals invasion-associated variant of desmoplastic reaction involving INHBA, THBS2 and COL11A1. BMC Med Genomics. 2010;3:51. doi:10.1186/1755-8794-3-51
37. Andrlová H, Mastroianni J, Madl J, et al. Biglycan expression in the melanoma microenvironment promotes invasiveness via increased tissue stiffness inducing integrin-β1 expression. Oncotarget. 2017;8:42901–42916. doi:10.18632/oncotarget.17160
38. Liu Y, Li W, Li X, et al. Expression and significance of biglycan in endometrial cancer. Arch Gynecol Obstet. 2014;289:649–655. doi:10.1007/s00404-013-3017-3
39. Jacobsen F, Kraft J, Schroeder C, et al. Up-regulation of Biglycan is associated with poor prognosis and PTEN deletion in patients with prostate cancer. Neoplasia (New York, N Y). 2017;19:707–715. doi:10.1016/j.neo.2017.06.003
40. Bonnans C, Chou J, Werb Z. Remodelling the extracellular matrix in development and disease. Nat Rev Mol Cell Biol. 2014;15:786–801. doi:10.1038/nrm3904
41. Rong L, Huang W, Tian S, et al. COL1A2 is a novel biomarker to improve clinical prediction in human gastric cancer: integrating bioinformatics and meta-analysis. Pathol Oncol Res. 2018;24:129–134. doi:10.1007/s12253-017-0223-5
42. Oue N, Hamai Y, Mitani Y, et al. Gene expression profile of gastric carcinoma: identification of genes and tags potentially involved in invasion, metastasis, and carcinogenesis by serial analysis of gene expression. Cancer Res. 2004;64:2397–2405. doi:10.1158/0008-5472.CAN-03-3514
43. Uddin MN, Li M, Wang X. Identification of transcriptional markers and microRNA-mRNA regulatory networks in colon cancer by integrative analysis of mRNA and microRNA expression profiles in colon tumor stroma. Cells. 2019;8:1054. doi:10.3390/cells8091054
44. Gao YF, Mao XY, Zhu T, et al. COL3A1 and SNAP91: novel glioblastoma markers with diagnostic and prognostic value. Oncotarget. 2016;7:70494–70503. doi:10.18632/oncotarget.12038
45. Liu X, Wu J, Zhang D, et al. Identification of potential key genes associated with the pathogenesis and prognosis of gastric cancer based on integrated bioinformatics analysis. Front Genet. 2018;9:265. doi:10.3389/fgene.2018.00265
46. Chai F, Liang Y, Zhang F, et al. Systematically identify key genes in inflammatory and non-inflammatory breast cancer. Gene. 2016;575:600–614. doi:10.1016/j.gene.2015.09.025
47. Liu W, Wei H, Gao Z, et al. COL5A1 may contribute the metastasis of lung adenocarcinoma. Gene. 2018;665:57–66. doi:10.1016/j.gene.2018.04.066
48. Li G, Li X, Yang M, et al. Prediction of biomarkers of oral squamous cell carcinoma using microarray technology. Sci Rep. 2017;7:42105. doi:10.1038/srep42105
49. Zhao X, Cai H, Wang X, et al. Discovery of signature genes in gastric cancer associated with prognosis. Neoplasma. 2016;63:239–245. doi:10.4149/209_150531N303
50. Désert R, Mebarki S, Desille M, et al. “Fibrous nests” in human hepatocellular carcinoma express a Wnt-induced gene signature associated with poor clinical outcome. Int J Biochem Cell Biol. 2016;81:195–207. doi:10.1016/j.biocel.2016.08.017
51. Salem O, Erdem N, Jung J, et al. The highly expressed 5ʹisomiR of hsa-miR-140-3p contributes to the tumor-suppressive effects of miR-140 by reducing breast cancer proliferation and migration. BMC Genomics. 2016;17:566. doi:10.1186/s12864-016-2869-x
52. Carnemolla B, Borsi L, Balza E, et al. Enhancement of the antitumor properties of interleukin-2 by its targeted delivery to the tumor blood vessel extracellular matrix. Blood. 2002;99:1659–1665. doi:10.1182/blood.V99.5.1659
53. Weide B, Eigentler T, Catania C, et al. A Phase II study of the L19IL2 immunocytokine in combination with dacarbazine in advanced metastatic melanoma patients. Cancer Immunol Immunother. 2019;68:1547–1559. doi:10.1007/s00262-019-02383-z
54. Sauer S, Erba PA, Petrini M, et al. Expression of the oncofetal ED-B-containing fibronectin isoform in hematologic tumors enables ED-B-targeted 131I-L19SIP radioimmunotherapy in Hodgkin lymphoma patients. Blood. 2009;113:2265–2274. doi:10.1182/blood-2008-06-160416
55. Menssen HD, Harnack U, Erben U, et al. Antibody-based delivery of tumor necrosis factor (L19-TNFα) and interleukin-2 (L19-IL2) to tumor-associated blood vessels has potent immunological and anticancer activity in the syngeneic J558L BALB/c myeloma model. J Cancer Res Clin Oncol. 2018;144:499–507. doi:10.1007/s00432-017-2564-6
56. Chung JY, Ko JH, Lee YJ, et al. Surfactant-free solubilization and systemic delivery of anti-cancer drug using low molecular weight methylcellulose. J Control Release. 2018;276:42–49. doi:10.1016/j.jconrel.2018.02.028
57. Garcia J, Hurwitz HI, Sandler AB, et al. Bevacizumab (Avastin(R)) in cancer treatment: a review of 15 years of clinical experience and future outlook. Cancer Treat Rev. 2020;86:102017. doi:10.1016/j.ctrv.2020.102017
58. Hurwitz HI, Fehrenbacher L, Hainsworth JD, et al. Bevacizumab in combination with fluorouracil and leucovorin: an active regimen for first-line metastatic colorectal cancer. J Clin Oncol. 2005;23:3502–3508. doi:10.1200/JCO.2005.10.017
59. Sandler A, Gray R, Perry MC, et al. Paclitaxel-carboplatin alone or with bevacizumab for non-small-cell lung cancer. N Engl J Med. 2006;355:2542–2550. doi:10.1056/NEJMoa061884
60. Escudier B, Bellmunt J, Négrier S, et al. Phase III trial of bevacizumab plus interferon alfa-2a in patients with metastatic renal cell carcinoma (AVOREN): final analysis of overall survival. J Clin Oncol. 2010;28:2144–2150. doi:10.1200/JCO.2009.26.7849
61. Kawamata H, Omotehara F, Nakashiro K, et al. Vesnarinone: a differentiation-inducing anti-cancer drug. Anticancer Drugs. 2003;14:391–395. doi:10.1097/00001813-200307000-00001
62. Greenaway J, Henkin J, Lawler J, et al. ABT-510 induces tumor cell apoptosis and inhibits ovarian tumor growth in an orthotopic, syngeneic model of epithelial ovarian cancer. Mol Cancer Ther. 2009;8:64–74. doi:10.1158/1535-7163.MCT-08-0864
 © 2021 The Author(s). This work is published and licensed by Dove Medical Press Limited. The
full terms of this license are available at https://www.dovepress.com/terms
and incorporate the Creative Commons Attribution
- Non Commercial (unported, 3.0) License.
By accessing the work you hereby accept the Terms. Non-commercial uses of the work are permitted
without any further permission from Dove Medical Press Limited, provided the work is properly
attributed. For permission for commercial use of this work, please see paragraphs 4.2 and 5 of our Terms.
© 2021 The Author(s). This work is published and licensed by Dove Medical Press Limited. The
full terms of this license are available at https://www.dovepress.com/terms
and incorporate the Creative Commons Attribution
- Non Commercial (unported, 3.0) License.
By accessing the work you hereby accept the Terms. Non-commercial uses of the work are permitted
without any further permission from Dove Medical Press Limited, provided the work is properly
attributed. For permission for commercial use of this work, please see paragraphs 4.2 and 5 of our Terms.