Back to Journals » OncoTargets and Therapy » Volume 9
Bioinformatics analysis of hepatitis C virus genotype 2a-induced human hepatocellular carcinoma in Huh7 cells
Authors Xu P, Wu M, Chen H, Xu J, Wu M, Li M, Qian F, Xu J
Received 3 July 2015
Accepted for publication 22 September 2015
Published 8 January 2016 Volume 2016:9 Pages 191—202
DOI https://doi.org/10.2147/OTT.S91748
Checked for plagiarism Yes
Review by Single anonymous peer review
Peer reviewer comments 4
Editor who approved publication: Dr Faris Farassati
Ping Xu,1,2 Meiying Wu,2,3 Hui Chen,1,2 Junchi Xu,1,2 Minjuan Wu,1 Ming Li,4 Feng Qian,4 Junhua Xu2,4
1Inspection Center, Affiliated Infectious Hospital of Soochow University, 2Key Laboratory of TB Prevention and Cure of Suzhou City, 3Department of Respiratory Medicine, Affiliated Infectious Hospital of Soochow University, 4Department of Infectious Diseases, Affiliated Infectious Hospital of Soochow University, Suzhou, Jiangsu Province, People’s Republic of China
Abstract: Hepatocellular carcinoma (HCC) is a liver cancer that could be induced by hepatitis C virus genotype 2a Japanese fulminant hepatitis-1 (JFH-1) strain. The aim of this study was to investigate the molecular mechanisms of HCC. The microarray data GSE20948 includes 14 JFH-1- and 14 mock (equal volume of medium [control])-infected Huh7 samples. The data were downloaded from the Gene Expression Omnibus. After data processing, soft cluster analyses were performed to identify co-regulated genes with similar temporal expression patterns. Functional and pathway enrichment analyses, as well as functional annotation analysis, were performed. Subsequently, combined networks of protein–protein interaction network, microRNA regulatory network, and transcriptional regulatory network were constructed. Hub nodes, modules, and five clusters of co-regulated genes were also identified. In total, 173 up and 207 down co-regulated genes were separately identified in JFH-1-infected Huh7 cells compared with those of control cells. Functional enrichment analysis indicated that up co-regulated genes were related to skeletal system morphogenesis and neuron differentiation and down co-regulated genes were related to steroid/cholesterol/sterol metabolisms. Hub genes (such as IRF1, GBP1, ICAM1, Foxa1, DHCR7, HMGCS2, and MSMO1) were identified. Transcription factors IRF1 and Foxa1 were the targets of miR-130a, miR-17-5p, and miR-20a. PPARGC1A was targeted by miR-29 family, and MSMO1 was the target of miR-23 family. Hub nodes (such as IRF1, GBP1, ICAM1, Foxa1, DHCR7, HMGCS2, and MSMO1) and microRNAs might be used as candidate biomarkers of JFH-1-infected HCC.
Keywords: soft cluster analysis, co-regulated genes, transcription factors, microRNAs, combined network
Introduction
Hepatocellular carcinoma (HCC) is the seventh most common cancer in women, the fifth most common cancer in men, and the third leading cause of cancer death.1 Hepatitis C virus (HCV) is a common blood-borne viral infection resource and a leading cause of chronic liver diseases including HCC.2 Persistent viremia induced by HCV infection is believed to be the main cause of sustained liver dysfunction and higher HCC rate.3 Individuals with substantial or repeated direct percutaneous exposures such as injecting drugs, receiving blood from infected donors, hemophilia, and surgical resection have a higher prevalence of antibody to HCV.2,4 In North American and Western European countries, antibody to HCV has been detected in the serum of nearly 70% of HCC patients.5,6
In recent years, investigations on HCC mechanisms have been extensively performed. Studies have shown that genetic factors, metabolic factors, and environment conditions were the main causes of HCC.2,4 After being infected with HCV, patients frequently develop liver steatosis pathophysiology7 and show resistance to interferon (IFN) treatment.8,9 HCV is a lipotropic virus associated with serum lipoprotein.10 The replication and infectivity of HCV can be regulated by cellular lipid status,4 making serum lipoprotein level a good candidate marker and therapy for HCV-induced disease progression.11
Gene expression profile analyses have revealed that the genes associated with lipid metabolism and viral particle production can be repressed by microRNAs (miRNAs).10 Shirasaki et al revealed that overexpression of miR-27a decreases viral infectivity, enhances IFN signaling, and develops a more favorable response to IFN therapy.10 Previous studies focusing on miRNAs suggest the regulatory effect of miRNAs such as miR-130a,12 miR-196,13 and Let-7b14 on lipid metabolism and HCV replication, indicating that miRNAs have therapeutic potential for HCV-induced HCC patients. In addition, downregulation of HCC-related protein 1 may be related to decrease the invasion of HCC cells.15 HCCA1 plays an active role in HCC carcinogenesis and progression, and it may be used as a marker for HCC diagnosis and a potential target for treatment of this disease.16
As a genotype 2a HCV clone, HCV genotype 2a Japanese fulminant hepatitis-1 (JFH-1) strain can undergo a complete infection cycle in cell culture. This makes it possible to clarify the influence of HCV infection on host gene expression.13,17 In 2010, Blackham et al18 used microarray data to analyze the differentially expressed genes (DEGs) between JFH-1-infected Huh7 cell samples and mock-infected Huh7 cell samples (controls). They demonstrated that JFH-1 infection decreased the expression of genes involved in lipid metabolism (TXNIP and CYP1A1) and increased the expression of genes involved in cellular defense metabolism (CXCR1 and CXCR2). However, they did not perform the regulatory analysis of transcriptional and miRNA regulatory interrelationships. Thus, the miRNA regulation of these genes still remains unclear.
Using the microarray data GSE20948 released by Blackham et al,18 we first identified the co-regulated genes with similar temporal expression patterns. Then, the miRNAs related to the co-regulated genes were predicted to construct the regulatory network. Gene ontology (GO) and pathway analysis showed that the up co-regulated genes induced by JFH-1 infection were associated with neuron differentiation, response to virus, and immune response, and the down co-regulated genes were significantly relevant to steroid and cholesterol metabolic processes. Moreover, the genes and miRNAs were validated in HCC samples downloaded from The Cancer Genome Atlas (TCGA). This study indicated the importance of genes and miRNAs in HCC induced by HCV infection and the potential therapeutic properties of those miRNAs and genes for HCV-infected HCC.
Materials and methods
Microarray data
Expression profile of GSE20948 released by Blackham et al18 was downloaded from the Gene Expression Omnibus (http://www.ncbi.nlm.nih.gov/geo/) based on the platform of GPL570 (HG-U133_Plus_2) Affymetrix Human Genome U133 Plus 2.0 Array (Affymetrix, Santa Clara, CA, USA). GSE20948 includes 14 JFH-1-infected Huh7 cell samples and 14 mock-infected Huh7 cell samples, taken at 6 hours, 12 hours, 18 hours, 24 hours, and 48 hours post treatment (three repeats for each time point, the first repeat of both JFH-1- and mock-infected Huh7 cell samples at 6 hours post infection/treatment was not enrolled due to its poor quality).18
Data processing
After downloading GSE20948, microarray data were preprocessed by the Affy package (http://www.bioconductor.org).19 Probe identity documents of the raw data were converted to gene symbols using robust multi-array analysis package20 in Bioconductor (http://www.bioconductor.org/). For each transcript, mean expression values for each gene were determined by averaging the individual expression values. Then, the average expression values of transcripts in JFH-1-infected samples were normalized against those in mock-infected samples at the corresponding time points, which were considered as the fold changes. Subsequently, the log 2 transformation was performed. Finally, gene expression matrix of the samples was obtained.
Soft cluster analysis and identification of co-regulated genes
Soft cluster analysis was performed to detect the groups of transcripts with similar expression pattern during the experimental period. The Mfuzz package21 was used to conduct noise-robust soft cluster analysis to obtain the co-regulated genes with a similar expression pattern at five time points. The cluster algorithm was the fuzzy c-means algorithm.22 The parameters of minimum standard deviation and score were set as 0.1 and 0.6, respectively. A degree of membership of gene >0.6 was used as the inclusion criterion of co-regulated genes with a similar expression pattern.
Functional and pathway enrichment analysis for genes in modules
The Database for Annotation, Visualization, and Integrated Discovery23 was used to identify the significant GO biological process categories and the Kyoto Encyclopedia of Genes and Genomes pathway terms related to co-regulated genes. P<0.05 and enriched gene count >2 were used as the cutoff criteria.
Screening of transcription factors, oncogenes, and tumor suppressor genes
To determine whether the genes in clusters had functions of transcription factors (TFs), TF database (ftp://ftp.ncbi.nlm.nih.gov/repository/TFD/datasets/)24 was used to screen TFs among the co-regulated genes. In addition, by combining with tumor-associated genes (TAGs) database (http://www.binfo.ncku.edu.tw/TAG/)25 and tumor suppressor genes (TSGs) database (http://bioinfo.mc.vanderbilt.edu/TSGene/),26 all known oncogenes and TSGs were further extracted from the co-regulated genes.
Protein–protein interaction network analysis
The STRING online software (http://string-db.org/)27 was used to determine the protein–protein interaction (PPI) relationships of all the genes with confidence (combined score) >0.4. The other parameters were set to the defaults.
miRNA prediction
The WebGestalt tool (http://bioinfo.vanderbilt.edu/webgestalt/)28 was used to predict miRNAs (enriched gene count ≥2 and raw R<0.05) targeting the tightly co-regulated genes by using the cumulative hypergeometric distribution. Then, the raw P-values were adjusted to false discovery rates (FDRs) using the Benjamini and Hochberg method in a multi-test package.29 The FDR <0.05 was taken as the threshold.
Screening of transcriptional regulatory interrelationships
Based on the TF regulatory network data in the Encyclopedia of DNA Elements (ENCODE, http://genome.ucsc.edu/ENCODE),30 transcriptional interrelationships were identified.
Combination of networks
The combination of the PPI network, miRNA regulatory network, and transcriptional regulatory network was performed using the Cytoscape software (http://www.cytoscape.org/).31 Then, the key nodes (hub proteins) in the PPI network were identified using connectivity degree analysis.32
Module analysis
The Molecular Complex Detection (MCODE, http://baderlab.org/Software/MCODE)33 was used to screen the modules of PPI network (degree cutoff, 2; node score cutoff, 0.2; K-core, 2; maximum depth, 100). The MCODE score >3 and number of nodes >4 were used as the cutoff criteria. Afterward, functional and pathway enrichment analyses were performed for the co-regulated genes in the modules. P<0.05 and enriched gene count >2 were used as the cutoff criteria.
Validation of the key genes and miRNAs
The level 3 data of miRNASeq (including 372 HCC samples and 50 control samples) and RNASeq V2 (including 371 HCC samples and 50 control samples) were downloaded from TCGA (http://cancergenome.nih.gov/). The raw counts in miRNA or gene levels were selected from the data, and the miRNAs or genes, which had not been found in >20% of samples, were rejected. Then, the expression matrix was normalized by trimmed mean of M values method.34 The differentially expressed miRNAs (DE-miRNAs) and DEGs were identified by edgeR package35 in R. The FDR <0.01 and |log fold change| ≥1 were used as the cutoff criteria.
Results
Soft cluster analysis
Using the Mfuzz software, we obtained five clusters of temporal expression patterns (Figure 1). Genes in clusters 1 and 4 showed the increasing expression patterns, whereas genes in clusters 2 and 3 showed the decreasing expression ratios along with the extension of time. The temporal expression patterns of genes in clusters 1 and 2 were basically opposite to those in clusters 3 and 4, respectively. The genes in cluster 5 did not have unified expression profiles and did not have opposite time-dependent patterns. Thus, we performed further analysis for the co-regulated genes in clusters 1–4.
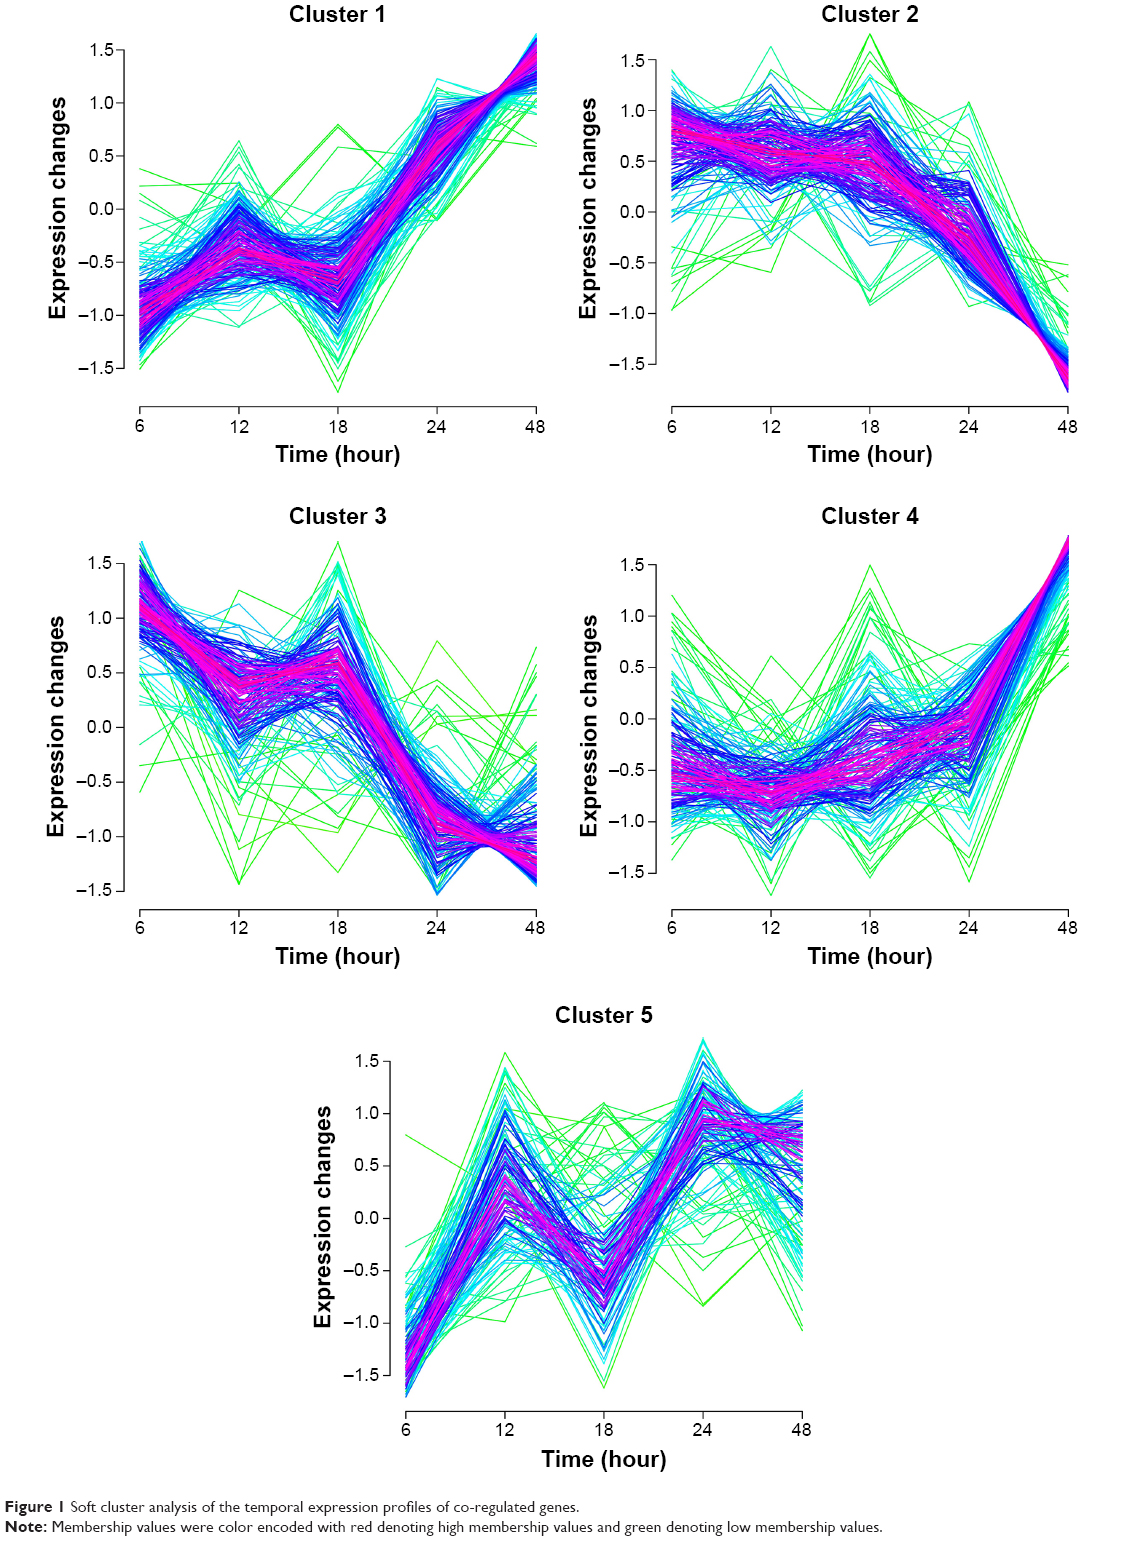 | Figure 1 Soft cluster analysis of the temporal expression profiles of co-regulated genes. |
Accordingly, a total of 380 genes including 173 co-regulated genes with continuously increasing temporal expression patterns (up co-regulated genes, 93 genes in cluster 1 and 80 genes in cluster 4) and 207 co-regulated genes with continuously decreasing temporal expression patterns (down co-regulated genes, 112 genes in cluster 2 and 95 genes in cluster 3) were identified.
Functional and pathway enrichment analyses
We separately performed the GO enrichment analysis for the up and down co-regulated genes. The up co-regulated genes were associated with response to skeletal system morphogenesis (P=3.67E-03) and neuron differentiation (P=6.99E-03; Table 1). The down co-regulated genes were significantly relevant to steroid metabolic process (P=1.21E-06) and cholesterol metabolic process (P=4.61E-05). Pathway enrichment analysis showed that the up co-regulated genes were associated with starch and sucrose metabolism pathway (P=5.48E-02; Table 2) and the down co-regulated genes were related to intestinal immune network for immunoglobulin A production pathway (P=2.05E-02; Table 2).
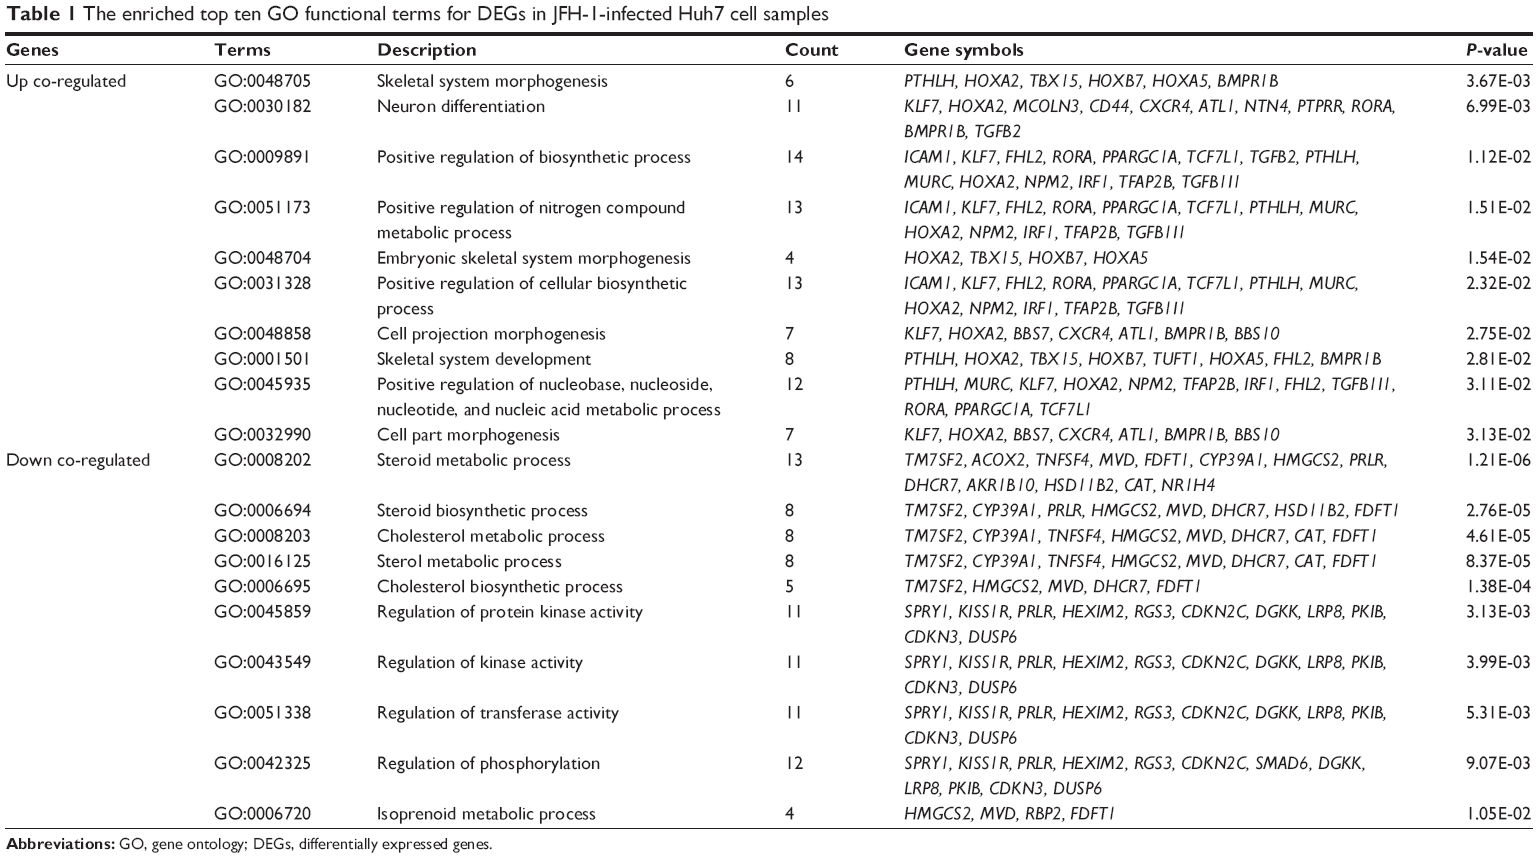 | Table 1 The enriched top ten GO functional terms for DEGs in JFH-1-infected Huh7 cell samples |
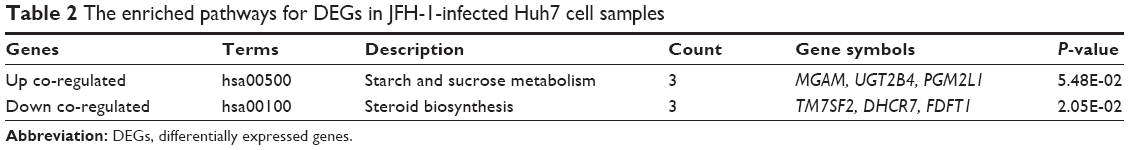 | Table 2 The enriched pathways for DEGs in JFH-1-infected Huh7 cell samples |
Screening of TFs, oncogenes, and TSGs
Using the TF, TAG, and TSG database, we obtained 12 TFs (eg, BACH2, IFN-γ regulatory factor-1 (IRF1), Hoxa2, Hoxb7, and MAFK) and eleven TSGs (eg, BACH2, IRF1, and TRIM3) from the up co-regulated genes, as well as ten TFs (eg, Foxa1, CDX2, and SMAD6), seven TSGs (eg, CDKN2C and DKK1), and two oncogenes (ETV1 and GPX2) from the down co-regulated genes (Table 3).
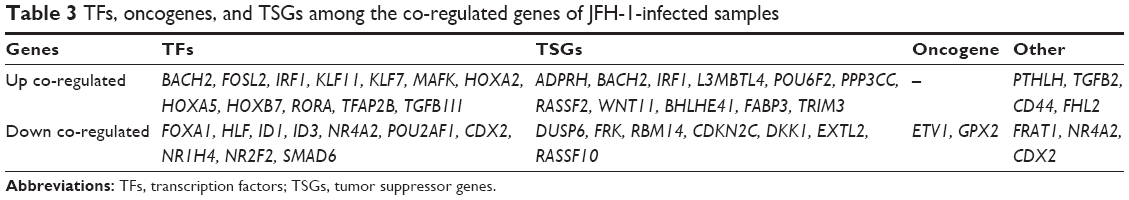 | Table 3 TFs, oncogenes, and TSGs among the co-regulated genes of JFH-1-infected samples |
PPI network analysis
We analyzed the interrelationship of all the up and down co-regulated genes. The PPI network of the up co-regulated genes was composed of 39 nodes (products of genes) and 77 edges (interrelationships), such as IRF1 (degree =25), MAFK (degree =13), intercellular adhesion molecule-1 (ICAM1; degree =7), and IRF9 (degree =7; Table 4). The PPI network of the down co-regulated genes was composed of 53 nodes and 90 edges, such as Foxa1 (degree =49), CDX2 (degree =10), methylsterol monooxygenase 1 (MSMO1; degree =8), hydroxymethylglutaryl CoA synthase 2 (HMGCS2; degree =7), delta7-sterol reductase (DHCR7; degree =7), and mevalonate diphosphate decarboxylase (MVD; degree =6; Table 4).
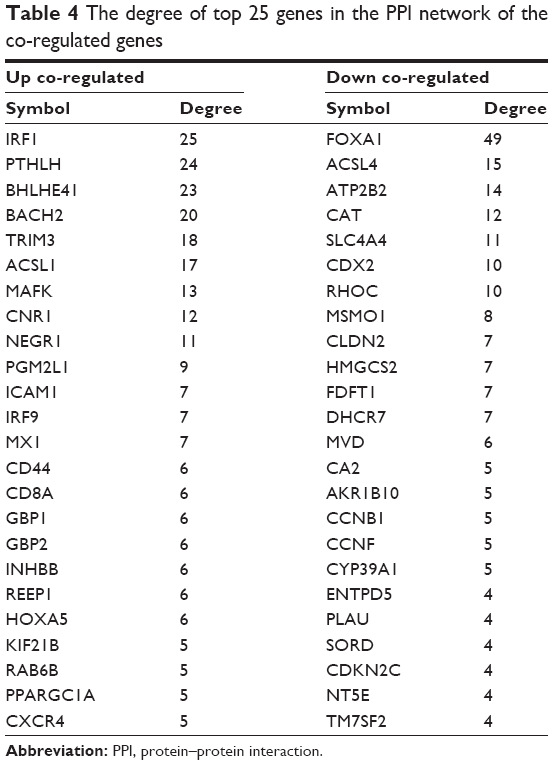 | Table 4 The degree of top 25 genes in the PPI network of the co-regulated genes |
Combination of the networks
Using the WebGestalt online tool, we predicted the miRNAs that might regulate the co-regulated genes in the PPI networks. Then, we further identified the transcriptional regulatory network using ENCODE. Finally, the combined networks of the PPI network, miRNA regulatory network, and transcriptional regulatory network of the up and down co-regulated genes were constructed and visualized using Cytoscape software, respectively (Figure 2). Hub nodes in each network were identified. Figure 3 shows the combined networks with the hub nodes of IRF1 (Figure 3A) and Foxa1 (Figure 3B).
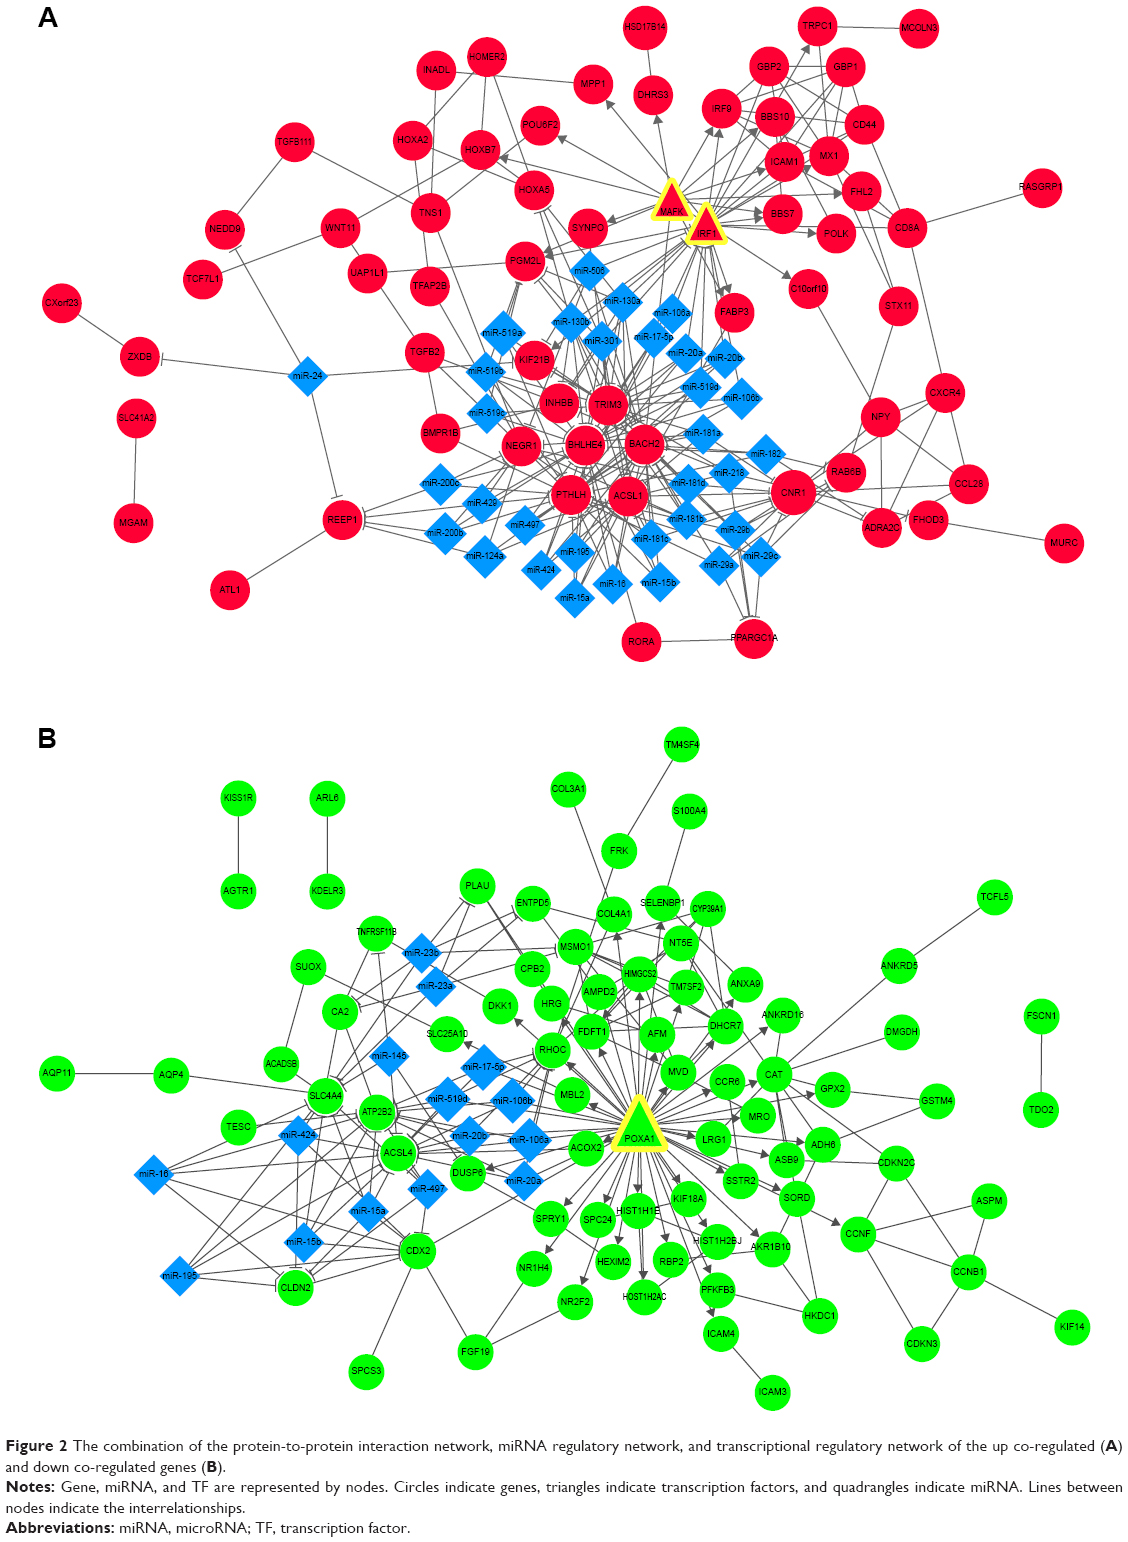 | Figure 2 The combination of the protein-to-protein interaction network, miRNA regulatory network, and transcriptional regulatory network of the up co-regulated (A) and down co-regulated genes (B). |
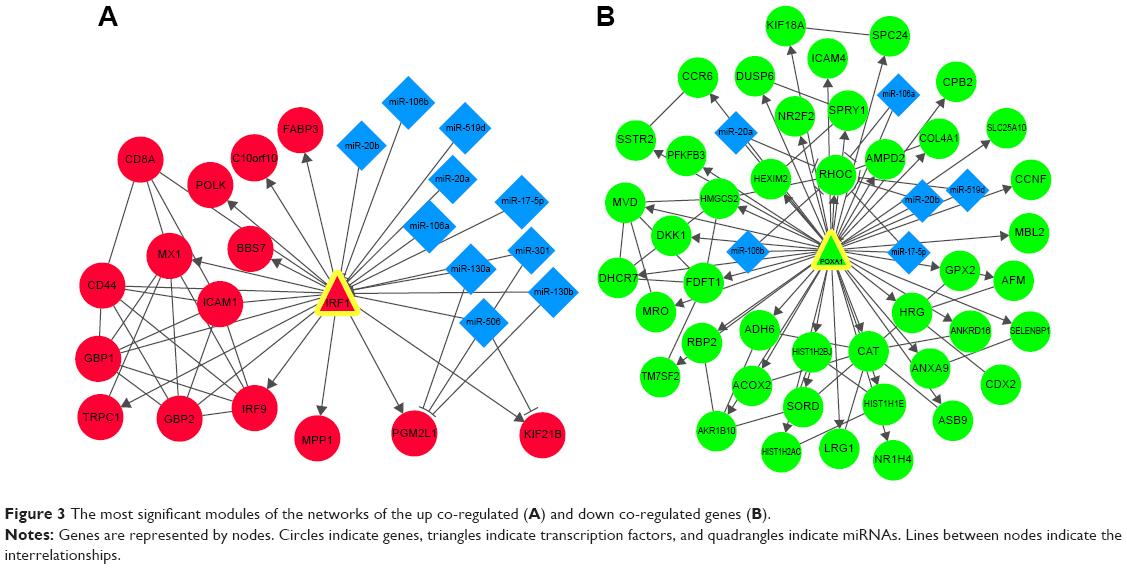 | Figure 3 The most significant modules of the networks of the up co-regulated (A) and down co-regulated genes (B). |
Interrelationships such as ICAM1–IRF1 (score =0.990) and IRF9–IRF1 (score =0.979) were identified in the network of the up co-regulated genes. Genes such as IRF1 and TRIM3 were the targets of miR-130a, miR-301, miR-181b, miR-17-5p, miR-20a, miR-106a, and so on. PPARGC1A was targeted by miR-29a, miR-29b, miR-29c, and so on (Figure 2A). Moreover, transcriptional regulatory interrelationships of IRF1 with other ten genes such as MX1, IRF9, and ICAM1 were identified (Figures 2A and 3A).
In the combined network of the down co-regulated genes, interrelationships such as MSMO1–farnesyl-diphosphate farnesyltransferase 1 (FDFT1; score =0.993), HMGCS2–MVD (score =0.940), and DHCR7–MSMO1 (score =0.868) were obtained. The Foxa1 gene was the target of miR-20a, miR-17-5p, miR-106a, miR-519d, and so on, and MSMO1 was targeted by miR-23a, miR-23b, and so on (Figure 2B). In addition, transcriptional regulatory interrelationships of Foxa1 with 42 other genes including HMGCS2 and PGM2L1 were identified (Figures 2B and 3B).
Module analysis
Figure 4 shows the most significant modules of networks for the up (mode score =6.333; Figure 4A) and down co-regulated genes (mode score =4.8; Figure 4B). The module of PPI network of up co-regulated genes consisted of seven nodes and 19 edges (Figure 4A). Enrichment analysis showed that these genes were mainly associated with immune response (P=3.40E-02) and response to virus (P=4.74E-02; Table 5). There were no enriched pathways for these genes.
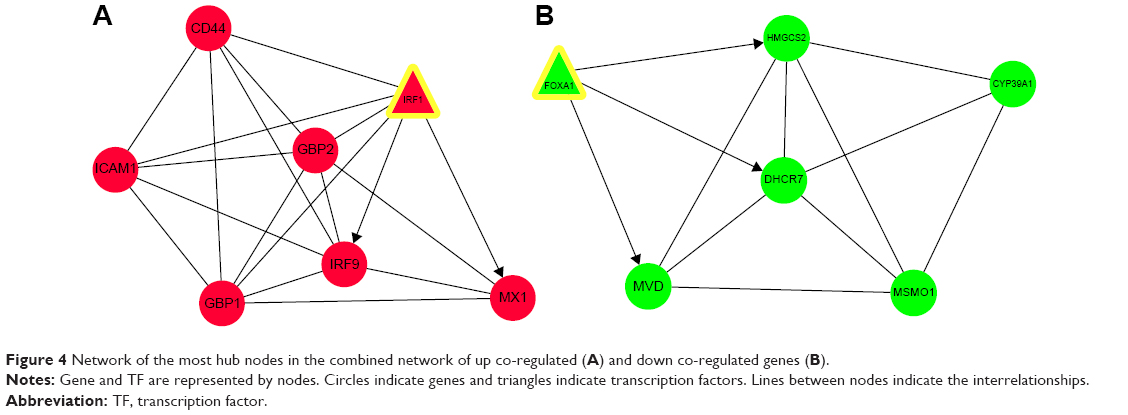 | Figure 4 Network of the most hub nodes in the combined network of up co-regulated (A) and down co-regulated genes (B). |
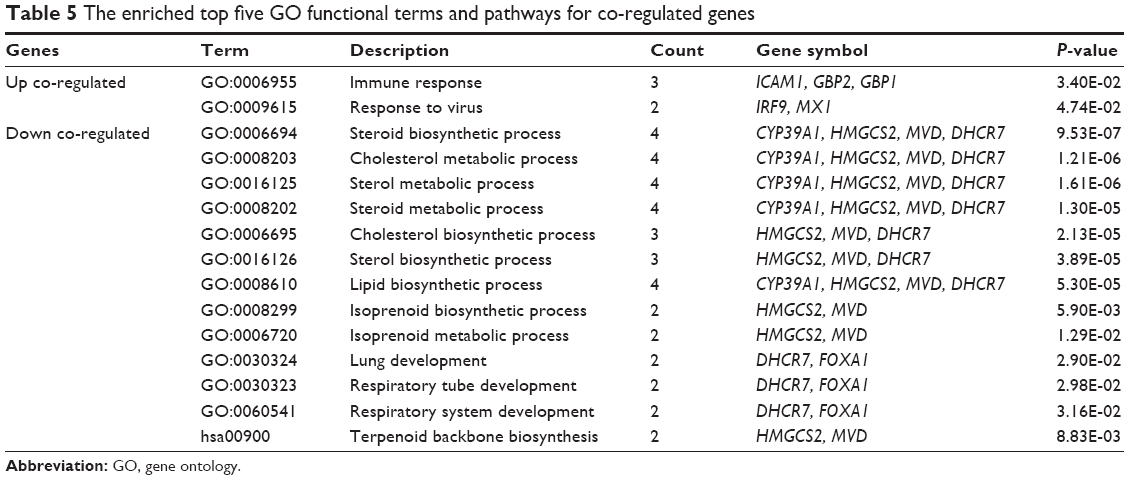 | Table 5 The enriched top five GO functional terms and pathways for co-regulated genes |
The module of PPI network of down co-regulated genes contained six nodes and 12 edges (Figure 4B). GO enrichment analysis revealed that the genes were enriched in cholesterol metabolic process (P=1.21E-06), sterol metabolic process (P=1.61E-06), isoprenoid metabolic process (P=1.29E-02), and lung development (P=2.90E-02; Table 5). Down co-regulated genes of HMGCS2 and MVD were involved in terpenoid backbone biosynthesis pathway (P=8.83E-03).
Validation of the key genes and miRNAs
A total of 113 DE-miRNAs (including 97 upregulated and 16 downregulated miRNAs, such as miR-17 and miR-20a) and 3,069 DEGs (including 2,103 upregulated and 966 downregulated genes, such as GBP1 and HMGCS2) were screened. Afterward, the DEGs were compared with the co-regulated genes in clusters 1–4. A total of 11, 21, 14 (eg, HMGCS2), and 19 (eg, GBP2) DEGs were found in clusters 1, 2, 3, and 4, respectively.
Discussion
IRF1 gene is a TF that regulates the transcription of type I IFN- and IFN-inducible genes.36 As an antiviral pleiotropic cytokine,37 IFN-γ can result in non-apoptotic cell death of Huh7 cells or human HCC cells by inducing autophagosome formation and autophagy in cells via IRF1 signaling pathway.38 A previous study suggested that the -300AA IRF1 genotype may be related to the outcome in HCV genotype 3-infected patients and therapeutic response in patients infected by HCV genotype 1.39 Thus, IRF1 was associated with the prognosis of HCC patients.
miR-17-5p is the most determinant regulator of the G1/S phase cell cycle transition.40 HEK293T cells transiently transfected with miR-17-5p develop a dramatic increment in the proliferation rate.40 However, the IRF1 mRNA expression levels increase and the proliferation rate of HEK293T cells reduces subsequently. This might be due to the autophagy triggered by IRF1. These results indicate that IRF1 can reduce the hypo-proliferation phenotype of tumor cells.40,41 In this study, we predicted that IRF1 was targeted by miRNAs of miR-130a, miR-301, miR-181b, miR-17-5p, miR-20a, miR-106a, and so on, indicating the vital role of IRF1 in regulating proliferation of HCC cells.
Both GBP1 and GBP2 expressions require TF IRF1 activation.42 Like IRF1, immunostaining indicates that GBP1/2 accumulation in intracellular compartments contributes to cell autophagy,43 which inhibits the growth of HCV-induced human HCC cells.38 According to these results, GBP2 has been discussed as a possible control factor in tumor development.44 The validation analysis revealed that GBP1 and GBP2 were the DEGs in HCC samples. Thus, the increased expression ratio of GBP1 and GBP2 in JFH-1-infected HCC samples compared with the mock-infected ones revealed that GBP1 and GBP2 might be used as two possible control factors in HCC development.
As an enzyme belonging to the immunoglobulin superfamily, ICAM1 plays an important role in innate and adaptive immune responses.45 Results of an enzyme-linked immunosorbent assay showed that the serum concentration of ICAM1 is significantly increased in patients with acute viral hepatitis and severe chronic active hepatitis C.46,47 In chronic hepatitis C patients and patients with non-B, non-C chronic liver diseases, the serum levels of soluble ICAM-1 is a promising noninvasive marker of liver disease activity.48 Thus, ICAM1 might be a candidate biomarker of JFH-1-infected HCC.
The forkhead protein FoxA1 (or hepatocyte nuclear factor 3α) is a TF and a major determinant of estrogen receptor (ER)-α activity.49 Estrogens can protect hepatocytes from malignancy, due to which men have a higher incidence of HCC than women.50 However, overexpression of ERα is related to the development of HCC.51 MiR-18a elevation that mediates ERα downregulation has been identified in females with HCC.52 Results from quantitative real-time PCR showed that elevated miR-20a levels are positively correlated with the severity of HCV-infected patients;53 thus, miR-20a may serve as a potential biomarker in HCV-mediated disease.54 In this study, Foxa1 was relatively downregulated in JFH-1-infected samples and was targeted by miRNAs such as miR-20a, miR-17-5p, miR-106a, and miR-519d; meanwhile, miR-17 and miR-20a were DE-miRNAs in the HCC samples downloaded from TCGA. Therefore, these miRNAs might serve as potential biomarkers in HCV-mediated HCC.
The FDFT1 gene functions as a key regulator in the cholesterol biosynthesis pathway.55 FDFT1 directs sterol biosynthesis to a branch resulting in the exclusive synthesis of cholesterol.56 This was inconsistent with the result of this study that FDFT1 was enriched in the cholesterol biosynthesis process. Park et al57 revealed the critical role of FDFT1 in HCV replication. They showed that siRNA-mediated silencing of FDFT1 gene impairs HCV replication and YM53601-inhibited activity of FDFT1 enzyme abrogates HCV propagation, indicating that FDFT1 is a host factor for HCV. They also observed that HCV infection elevated the level of FDFT1 protein rather than FDFT1 mRNA,57 demonstrating that HCV might modulate FDFT1 protein level to facilitate its own propagation.
The MSMO1 gene (also known as sterol-C4-methyl oxidase) was relatively downregulated in HCC samples. MSMO1 is reported to be involved in the biosynthetic and metabolic processes of sterol and cholesterol.58,59 HCV infection is partly dependent on membrane cholesterol.60 In this study, MSMO1 was continuously downregulated, demonstrating that sterol/cholesterol metabolism had been altered in HCV-infected cells. Glucose-6-phosphatase (G6PC) is a key enzyme catalyzing the final step of gluconeogenesis.61 The expression of G6PC is negatively correlated with the tumor grades.62,63 Wang et al showed that elevation of miR-23a can severely suppress gluconeogenesis in HCC by downregulating its target gene G6PC.63 In this study, MSMO1 was targeted by miR-23a and miR-23b, indicating that miR-23a and miR-23b might be the targets to alter gluconeogenesis, and sterol and cholesterol metabolic processes in HCC.
The MVD (EC 4.1.1.33) gene encodes a key enzyme in the mevalonate pathway, which catalyzes the metabolism of isoprenoids.64,65 Isoprenoids participate in and are essential for diverse cellular functions, ranging from cholesterol synthesis to growth control.65 In this study, MVD was enriched in biological processes including cholesterol/sterol/steroid/isoprenoid metabolic/biosynthetic processes. All the isoprenoids were required for the HCV RNA replication or energy metabolism. These results indicated the vital role of MVD in HCV-related HCC.
Like MVD, HMGCS2, and DHCR7, genes were also enriched in biological processes such as cholesterol/sterol/steroid and/or isoprenoid metabolic/biosynthetic processes. HMGCS2 enzyme catalyzes the first step in isoprenoid biosynthesis, a site controlling the cholesterol pathway.66 DHCR7 enzyme catalyzes the last step in the biosynthesis of cholesterol.67 In our study, HMGCS2 was not only a DEG in HCC samples downloaded from TCGA but also a co-regulated gene in cluster 3. Therefore, both HMGCS2 and DHCR7 were vital genetic factors regulating cholesterol metabolism to control the energy metabolism of HCV, thereby controlling the replication of HCV. However, there are no experimental studies that had verified the important roles of HMGCS2 and DHCR7.
Conclusion
In conclusion, we identified the clusters of co-regulated genes with similar temporal expression patterns in the JFH-1-infected HCC samples compared with the mock-infected samples. IRF1 and Foxa1 were the targets of miR-130a, miR-17-5p, and miR-20a. PPARGC1A was the target of miR-29a, miR-29b, and miR-29c, and MSMO1 was the target of miR-23a and miR-23b. Both the up and down co-regulated genes and miRNAs were related to HCV-induced human HCC. Therefore, they could be used as candidate biomarkers of JFH-1-infected HCC. However, further studies are still needed to testify the viability of the above-mentioned assumptions.
Disclosure
The authors report no conflicts of interest in this work.
References
Bosetti C, Turati F, La Vecchia C. Hepatocellular carcinoma epidemiology. Best Pract Res Clin Gastroenterol. 2014;28(5):753–770. | ||
Morgan RL, Baack B, Smith BD, Yartel A, Pitasi M, Falck-Ytter Y. Eradication of hepatitis C virus infection and the development of hepatocellular carcinoma: a meta-analysis of observational studies. Ann Intern Med. 2013;158:329–337. | ||
Singal A, Freeman D Jr, Anand B. Meta-analysis: interferon improves outcomes following ablation or resection of hepatocellular carcinoma. Aliment Pharmacol Ther. 2010;32:851–858. | ||
Shalmani H, Ranjbar M, Alizadeh A. Recommendations for prevention and control of hepatitis C virus (HCV) infection and HCV-related chronic disease. J Liver. 2013;3:2167–2889. | ||
Montalto G, Cervello M, Giannitrapani L, Dantona F, Terranova A, Castagnetta LA. Epidemiology, risk factors, and natural history of hepatocellular carcinoma. Ann N Y Acad Sci. 2002;963:13–20. | ||
Nishioka K, Watanabe J, Furuta S, et al. A high prevalence of antibody to the hepatitis C virus in patients with hepatocellular carcinoma in Japan. Cancer. 1991;67:429–433. | ||
Asselah T, Rubbia-Brandt L, Marcellin P, Negro F. Steatosis in chronic hepatitis C: why does it really matter? Gut. 2006;55:123–130. | ||
Poynard T, Ratziu V, McHutchison J, et al. Effect of treatment with peginterferon or interferon alfa-2b and ribavirin on steatosis in patients infected with hepatitis C. Hepatology. 2003;38:75–85. | ||
Kanwal S, Mahmood T. Hepatitis C virus resistance to interferon therapy: an alarming situation. Cent Eur J Biol. 2014;9:1155–1167. | ||
Shirasaki T, Honda M, Shimakami T, et al. MicroRNA-27a regulates lipid metabolism and inhibits hepatitis C virus replication in human hepatoma cells. J Virol. 2013;87:5270–5286. | ||
Rowell J, Thompson AJ, Guyton JR, et al. Serum apolipoprotein C-III is independently associated with chronic hepatitis C infection and advanced fibrosis. Hepatol Int. 2012;6:475–481. | ||
Bhanja Chowdhury J, Shrivastava S, Steele R, Di Bisceglie AM, Ray R, Ray RB. Hepatitis C virus infection modulates expression of interferon stimulatory gene IFITM1 by upregulating MIR-130a. J Virol. 2012;86:10221–10225. | ||
Hou W, Tian Q, Zheng J, Bonkovsky HL. MicroRNA-196 represses Bach1 protein and hepatitis C virus gene expression in human hepatoma cells expressing hepatitis C viral proteins. Hepatology. 2010;51:1494–1504. | ||
Cheng JC, Yeh YJ, Tseng CP, et al. Let-7b is a novel regulator of hepatitis C virus replication. Cell Mol Life Sci. 2012;69:2621–2633. | ||
Xu Z, Liang L, Wang H, Li T, Zhao M. Hcrp1, a novel gene that is downregulated in hepatocellular carcinoma, encodes a growth-inhibitory protein. Biochem Biophys Res Commun. 2003;311:1057–1066. | ||
Zeng J-Z, Wang H-Y, Chen Z-J, Ullrich A, Wu M-C. Molecular cloning and characterization of a novel gene which is highly expressed in hepatocellular carcinoma. Oncogene. 2002;21:4932–4943. | ||
Wakita T, Pietschmann T, Kato T, et al. Production of infectious hepatitis C virus in tissue culture from a cloned viral genome. Nat Med. 2005;11:791–796. | ||
Blackham S, Baillie A, Al-Hababi F, et al. Gene expression profiling indicates the roles of host oxidative stress, apoptosis, lipid metabolism, and intracellular transport genes in the replication of hepatitis C virus. J Virol. 2010;84:5404–5414. | ||
Gautier L, Cope L, Bolstad BM, Irizarry RA. Affy – analysis of Affymetrix GeneChip data at the probe level. Bioinformatics. 2004;20:307–315. | ||
Irizarry RA, Hobbs B, Collin F, et al. Exploration, normalization, and summaries of high density oligonucleotide array probe level data. Biostatistics. 2003;4:249–264. | ||
Kumar L, Futschik ME. Mfuzz: a software package for soft clustering of microarray data. Bioinformation. 2007;2:5. | ||
Futschik ME, Carlisle B. Noise-robust soft clustering of gene expression time-course data. J Bioinform Comput Biol. 2005;3:965–988. | ||
Huang DW, Sherman BT, Tan Q, et al. The DAVID gene functional classification tool: a novel biological module-centric algorithm to functionally analyze large gene lists. Genome Biol. 2007;8:183. | ||
Ghosh D. Status of the transcription factors database (TFD). Nucleic Acids Res. 1993;21:3117–3118. | ||
Chen J-S, Hung W-S, Chan H-H, Tsai S-J, Sun HS. In silico identification of oncogenic potential of fyn-related kinase in hepatocellular carcinoma. Bioinformatics. 2013;29:420–427. | ||
Zhao M, Sun J, Zhao Z. TSGene: a web resource for tumor suppressor genes. Nucleic Acids Res. 2013;41:D970–D976. | ||
Franceschini A, Szklarczyk D, Frankild S, et al. STRING v9. 1: protein-protein interaction networks, with increased coverage and integration. Nucleic Acids Res. 2013;41:D808–D815. | ||
Zhang B, Kirov S, Snoddy J. WebGestalt: an integrated system for exploring gene sets in various biological contexts. Nucleic Acids Res. 2005;33:W741–W748. | ||
Benjamini Y, Hochberg Y. Controlling the false discovery rate: a practical and powerful approach to multiple testing. J R Stat Soc Series B. 1995;57:289–300. | ||
Rosenbloom KR, Dreszer TR, Pheasant M, et al. Encode whole-genome data in the UCSC genome browser. Nucleic Acids Res. 2010;38:D620–D625. | ||
Kohl M, Wiese S, Warscheid B. Cytoscape: software for visualization and analysis of biological networks. In: Eisenacher M, Hamacher M, Stephan C, editors. Data Mining in Proteomics. Berlin: Springer; 2011:291–303. | ||
Ekman D, Light S, Björklund ÅK, Elofsson A. What properties characterize the hub proteins of the protein-protein interaction network of Saccharomyces cerevisiae? Genome Biol. 2006;7:R45. | ||
Bader GD, Hogue CW. An automated method for finding molecular complexes in large protein interaction networks. BMC Bioinformatics. 2003;4:2. | ||
Robinson MD, Oshlack A. A scaling normalization method for differential expression analysis of RNA-seq data. Genome Biol. 2010;11:R25. | ||
Robinson MD, McCarthy DJ, Smyth GK. edgeR: a bioconductor package for differential expression analysis of digital gene expression data. Bioinformatics. 2010;26:139–140. | ||
Itoh S, Harada H, Nakamura Y, White R, Taniguchi T. Assignment of the human interferon regulatory factor-1 (IRF1) gene to chromosome 5q23–q31. Genomics. 1991;10:1097–1099. | ||
Kajita A, Morizane S, Yamamoto T, et al. Interferon gamma enhances anti-viral activity induced by double-stranded RNA in keratinocytes. J Dermatol Sci. 2013;69:e77–e78. | ||
Li P, Du Q, Cao Z, et al. Interferon-gamma induces autophagy with growth inhibition and cell death in human hepatocellular carcinoma (HCC) cells through interferon-regulatory factor-1 (IRF-1). Cancer Lett. 2012;314:213–222. | ||
Wietzke-Braun P, Maouzi AB, Mänhardt LB, Bickeböller H, Ramadori G, Mihm S. Interferon regulatory factor-1 promoter polymorphism and the outcome of hepatitis C virus infection. Eur J Gastroenterol Hepatol. 2006;18:991–997. | ||
Cloonan N, Brown MK, Steptoe AL, et al. The miR-17-5p microRNA is a key regulator of the g1/s phase cell cycle transition. Genome Biol. 2008;9:R127. | ||
Lian J, Tian H, Liu L, et al. Downregulation of microRNA-383 is associated with male infertility and promotes testicular embryonal carcinoma cell proliferation by targeting IRF1. Cell Death Dis. 2010;1:e94. | ||
Ramsauer K, Farlik M, Zupkovitz G, et al. Distinct modes of action applied by transcription factors STAT1 and IRF1 to initiate transcription of the IFN-γ-inducible gbp2 gene. Proc Natl Acad Sci U S A. 2007;104:2849. | ||
Traver MK, Henry SC, Cantillana V, et al. Immunity-related GTPase M (IRGM) proteins influence the localization of guanylate-binding protein 2 (GBP2) by modulating macroautophagy. J Biol Chem. 2011;286:30471–30480. | ||
Godoy P, Cadenas C, Hellwig B, et al. Interferon-inducible guanylate binding protein (GBP2) is associated with better prognosis in breast cancer and indicates an efficient T cell response. Breast Cancer. 2014;21:491–499. | ||
Lawson C, Wolf S. Icam-1 signaling in endothelial cells. Pharmacol Rep. 2009;61:22–32. | ||
Nouri-Aria K, Koskinas J, Tibbs C, Portmann B, Williams R. Serum intercellular adhesion molecule-1 levels in chronic hepatitis C: association with disease activity and response to interferon alpha. Gut. 1995;36:599–603. | ||
Zöhrens G, Armbrust T, Pirzer U, Meyer zum Büschenfelde KH, Ramadori G. Intercellular adhesion molecule-1 concentration in sera of patients with acute and chronic liver disease: relationship to disease activity and cirrhosis. Hepatology. 1993;18:798–802. | ||
El-Gohary AM, Fawaz NA, Hassoba HM, Serwah A, Ali M. Soluble ICAM-1 in patients with chronic hepatitis C infection: a prognostic marker of disease activity. Egypt J Immunol. 2003;11:109–119. | ||
Hurtado A, Holmes KA, Ross-Innes CS, Schmidt D, Carroll JS. FOXA1 is a key determinant of estrogen receptor function and endocrine response. Nat Genet. 2011;43:27–33. | ||
Liu WH, Yeh SH, Lu CC, et al. MicroRNA-18a prevents estrogen receptor-α expression, promoting proliferation of hepatocellular carcinoma cells. Gastroenterology. 2009;136:683–693. | ||
Zhai Y, Zhou G, Deng G, et al. Estrogen receptor α polymorphisms associated with susceptibility to hepatocellular carcinoma in hepatitis B virus carriers. Gastroenterology. 2006;130:2001–2009. | ||
Li CL, Yeh KH, Liu WH, et al. Elevated p53 promotes the processing of miR-18a to decrease estrogen receptor-α in female hepatocellular carcinoma. Int J Cancer. 2015;136:761–770. | ||
Shrivastava S, Petrone J, Steele R, et al. Up-regulation of circulating miR-20a is correlated with hepatitis C virus-mediated liver disease progression. Hepatology. 2013;58:863–871. | ||
Shrivastava S, Mukherjee A, Ray RB. Hepatitis C virus infection, microrna and liver disease progression. World J Hepatol. 2013;5:479. | ||
Mori M, Sawashita J, Higuchi K. Functional polymorphisms of the Lss and Fdft1 genes in laboratory rats. Exp Anim. 2007;56:93–101. | ||
Tansey TR, Shechter I. Structure and regulation of mammalian squalene synthase. Biochim Biophys Acta. 2000;1529:49–62. | ||
Park E-M, Nguyen LN, Lim Y-S, Hwang SB. Farnesyl-diphosphate farnesyltransferase 1 regulates hepatitis C virus propagation. FEBS Lett. 2014;588:1813–1820. | ||
Dyck MK, Zhou C, Tsoi S, Grant J, Dixon WT, Foxcroft GR. Reproductive technologies and the porcine embryonic transcriptome. Anim Reprod Sci. 2014;149:11–18. | ||
Fukushima R, Kaneto M, Kitagawa H. Microarray analysis of leflunomide-induced limb malformations in CD-1 mice. Reprod Toxicol. 2010;29:42–48. | ||
Kapadia SB, Barth H, Baumert T, McKeating JA, Chisari FV. Initiation of hepatitis C virus infection is dependent on cholesterol and cooperativity between CD81 and scavenger receptor B type I. J Virol. 2007;81:374–383. | ||
Jia Y, Cong R, Li R, et al. Maternal low-protein diet induces gender-dependent changes in epigenetic regulation of the glucose-6-phosphatase gene in newborn piglet liver. J Nutr. 2012;142:1659–1665. | ||
Bensinger SJ, Christofk HR. New aspects of the Warburg effect in cancer cell biology. Semin Cell Dev Biol. 2012;23:352–361. | ||
Wang B, Hsu SH, Frankel W, Ghoshal K, Jacob ST. Stat3-mediated activation of microRNA-23a suppresses gluconeogenesis in hepatocellular carcinoma by down-regulating glucose-6-phosphatase and peroxisome proliferator-activated receptor gamma, coactivator 1 alpha. Hepatology. 2012;56:186–197. | ||
Shi L, Qin L, Xu Y, et al. Molecular cloning, characterization, and function analysis of a mevalonate pyrophosphate decarboxylase gene from Ganoderma lucidum. Mol Biol Rep. 2012;39:6149–6159. | ||
Goldstein JL, Brown MS. Regulation of the mevalonate pathway. Nature. 1990;343:425–430. | ||
Greenspan MD, Yudkovitz JB, Lo CY, et al. Inhibition of hydroxymethylglutaryl-coenzyme a synthase by l-659,699. Proc Natl Acad Sci U S A. 1987;84:7488–7492. | ||
Witsch-Baumgartner M, Ciara E, Löffler J, et al. Frequency gradients of DHCR7 mutations in patients with Smith-Lemli-Opitz syndrome in Europe: evidence for different origins of common mutations. Eur J Hum Genet. 2001;9:45–50. |
 © 2016 The Author(s). This work is published and licensed by Dove Medical Press Limited. The
full terms of this license are available at https://www.dovepress.com/terms
and incorporate the Creative Commons Attribution
- Non Commercial (unported, 3.0) License.
By accessing the work you hereby accept the Terms. Non-commercial uses of the work are permitted
without any further permission from Dove Medical Press Limited, provided the work is properly
attributed. For permission for commercial use of this work, please see paragraphs 4.2 and 5 of our Terms.
© 2016 The Author(s). This work is published and licensed by Dove Medical Press Limited. The
full terms of this license are available at https://www.dovepress.com/terms
and incorporate the Creative Commons Attribution
- Non Commercial (unported, 3.0) License.
By accessing the work you hereby accept the Terms. Non-commercial uses of the work are permitted
without any further permission from Dove Medical Press Limited, provided the work is properly
attributed. For permission for commercial use of this work, please see paragraphs 4.2 and 5 of our Terms.