Back to Journals » Cancer Management and Research » Volume 11
Bioinformatics analysis of dysregulated microRNAs in exosomes from docetaxel-resistant and parental human breast cancer cells
Authors Chen WX ![]() , Xu LY, Cheng L, Qian Q, He X, Peng WT, Zhu YL
, Xu LY, Cheng L, Qian Q, He X, Peng WT, Zhu YL ![]()
Received 12 January 2019
Accepted for publication 30 April 2019
Published 12 June 2019 Volume 2019:11 Pages 5425—5435
DOI https://doi.org/10.2147/CMAR.S201335
Checked for plagiarism Yes
Review by Single anonymous peer review
Peer reviewer comments 3
Editor who approved publication: Dr Rituraj Purohit
Wei-Xian Chen,1,2 Ling-Yun Xu,1 Lin Cheng,1 Qi Qian,1 Xiao He,1 Wen-Ting Peng,1 Yu-Lan Zhu1
1Department of Breast Surgery, The Affiliated Changzhou No.2 People’s Hospital of Nanjing Medical University, Changzhou 213000, People’s Republic of China; 2Department of Post-doctoral Working Station, The Affiliated Changzhou No.2 People’s Hospital of Nanjing Medical University, Changzhou 213000, People’s Republic of China
Background: Resistance to docetaxel is a major obstacle to effective treatment of breast cancer. Exosomal microRNAs (miRNAs) have recently been introduced in cell-to-cell transmission of chemoresistance between heterogeneous populations of tumor cells with diverse drug sensitivity. However, a systematic evaluation of the exosomal miRNA signature remains largely unclear.
Method: miRNA expression profiles in exosomes from docetaxel-resistant (D/exo) and parental sensitive breast cancer cells (S/exo) were assessed using microarray. Bioinformatics analysis was performed to predict target genes of the dysregulated miRNAs and to uncover their potential roles in chemoresistance formation. Signaling pathways, gene ontology terms, transcription factors, protein–protein interactions, and hub genes were also constructed.
Results: The selected exosomal miRNAs could modulate target genes responsible for MAPK, TGF-beta, Wnt, mTOR, and PI3K/Akt signaling pathways. Function enrichment analysis revealed the involvement of target genes in transcription regulation, protein phosphorylation, kinase activity, and protein binding. Enriched transcription factors including SP1, SP4, and EGR1 were obtained and a protein–protein interaction network was established. The hub genes for up-expressed and down-expressed exosomal miRNAs such as CCND1 and PTEN were identified.
Conclusion: This bioinformatics study provides a comprehensive view of the function of dysregulated exosomal miRNAs, and may help us to understand exosome-mediated resistance transmission and overcome docetaxel resistance in future breast cancer therapy.
Keywords: breast cancer, exosomes, microRNA, chemoresistance, docetaxel
Introduction
Breast cancer is the most common malignant tumor and the leading cause of cancer-related death among females worldwide.1 Docetaxel-based chemotherapy forms an important part of successful cancer treatment; however, drug resistance, whether innate or acquired over time, is almost inevitable.2 Chemoresistance is a multifactorial phenomenon involving many mechanisms. Although much effort has been expended in studying the molecular basis of chemoresistance, reasons for the failure of docetaxel have yet to be fully elucidated.
Exosomes are nano-sized extracellular vesicles about 50–100 nm in diameter released from many cell types. Mounting evidence suggests that exosomes play significant roles in cancer biology, including tumorigenesis, angiogenesis, invasion, and metastasis.3,4 Added to these, exosomes are regarded as powerful transmitters of drug resistance owing to their ability to shuttle functional proteins, and especially microRNAs (miRNAs), between cells.5,6 Our previous group explored the miRNA expression profiles of three chemoresistant breast cancer cell lines and their corresponding exosomes, and demonstrated that a number of resistance-associated miRNAs were concentrated in isolated exosomes.7 Our colleagues then found that exosomes from metastatic breast cancer cells could release miR-1246, leading to enhanced cell proliferation, invasion, and chemoresistance in non-metastatic cancer cells.8 Wei et al reported that exosomal miR-221/222 from tamoxifen-resistant breast cancer cells could increase tamoxifen resistance in recipient sensitive cells.9 Our previous work also demonstrated that docetaxel-resistant breast cancer cells were able to spread chemoresistance to sensitive cells by releasing exosomes and transferring specific miRNAs.10 In relation to treatment, exosomes could function as nanoparticles to deliver anti-miR-214 to reverse chemoresistance to cisplatin in cancer cells.11 All the above studies have, thus far, been conducted to support the hypothesis that exosomal miRNAs were tied to drug sensitivity and might serve as a potential alternative for breast cancer therapy.
Remarkably, most studies attempting to detect miRNA signatures relevant to chemoresistance have focused only on cellular miRNAs or on individual exosomal miRNA. A lack of knowledge regarding the miRNA expression profiles would limit the understanding of exosomal miRNA’s role in chemoresistance formation. Therefore, the purpose of this work was to bioinformatically analyze the miRNA signatures in exosomes from docetaxel-resistant and parental breast cancer cells.
Materials and methods
Cell culture
Human breast cancer cell line MCF-7 was purchased from the Cell Bank of the Chinese Academy of Sciences (Shanghai, People's Republic of China). The docetaxel-resistant subline (MCF-7/Doc) was successfully established from the parental sensitive cell line (MCF-7/S) by increasing the concentration of docetaxel in our laboratory, as described previously.12 All cell lines were cultured in DMEM high glucose (HyClone, South Logan, UT, USA) containing 10% FBS, 100 U/mL penicillin, and 100 μg/mL streptomycin, at 37°C and 5% CO2 in a humidified atmosphere.
Exosome isolation and characterization
Exosomes were isolated from medium of MCF-7/Doc and MCF-7/S cultured in exosome-free FBS using repeated centrifugation and ultracentrifugation steps, as described previously.10 They were respectively named D/exo and S/exo for simplicity. Characterization of harvested exosomes was performed by transmission electron microscopy as previously reported.13 In brief, approximately 10 μL exosome samples were placed on parafilm and covered by a 300-mesh copper grid for 45 minutes. After washing three times in PBS, the copper grid was fixed in 3% glutaraldehyde for 10 minutes, washed with double-distilled water, and then contrasted in 2% uranyl acetate. Images were captured by using a JEM-1010 electron microscope (JEOL, Tokyo, Japan) at an accelerating voltage of 80 kV.
Exosomal miRNA extraction and microarray
Exosomal RNA was extracted using the Total Exosome RNA and Protein Isolation Kit (Invitrogen, Waltham, MA, USA) in accordance with the manufacturer’s protocols. RNA was quantified spectrophotometrically (Thermo Scientific, Waltham, MA, USA), and its quality was assessed by an Agilent 2100 Bioanalyzer (Agilent Technologies, Santa Clara, CA, USA). MicroRNA expression profiles were generated and hybridization using the Affymetrix GeneChip miRNA 3.0 Array was carried out as previously described.14 In brief, hybridization was performed using the Affymetrix Fluidics Station 450 (Affymetrix, Santa Clara, CA, USA) and Hybridization Oven 640. Image processing was conducted using the Affymetrix Gene Array 3000 scanner. The raw data were treated using miRNA QC tool software (Affymetrix), and data output was received in Excel spreadsheets containing the normalized miRNA expression profiles. Differentially expressed exosomal miRNAs in D/exo were filtered to exclude those changes less than 2.0-fold different compared with exosomal miRNAs in S/exo.
Real-time PCR
Real-time PCR was conducted using the SYBR PrimeScript RT-PCR kit (Takara Bio, Tokyo, Japan) on a Light Cycler 480 (Roche, Sydney, Australia) according to the manufacturer’s protocols. All reactions were performed in a 20 μL reaction volume in triplicate. The primers for U6 are as follows: forward, 5ʹCGCAAGGATGACACG3ʹ; reverse, 5ʹGAGCAGGCTGGAGAA3ʹ. The relative miRNA expressions were calculated using the ΔΔCt method and normalized to U6.
Target gene prediction
We followed the methods of Zhong et al, as previously reported.7 The starBase version 2.0 (
KEGG pathway and GO analysis
The web-based program Database for Annotation, Visualization and Integrated Discovery (DAVID,
Screening of transcription factors
FunRich (
Integration of protein–protein interaction (PPI) network
Target genes of dysregulated exosomal miRNAs were uploaded to the Search Tool for the Retrieval of Interacting Genes (STRING) database (
Statistical analysis
Statistical analysis was performed using the SPSS 20.0 package (IBM Corp., Armonk, NY, USA). All experiments were carried out in triplicate and the data presented were representative of three independent experiments. Student’s t-test was used to assess the statistical significance of differences between groups in PCR analysis. A value of P<0.05 was considered significant.
Results
Exosome characterization and miRNA profiling
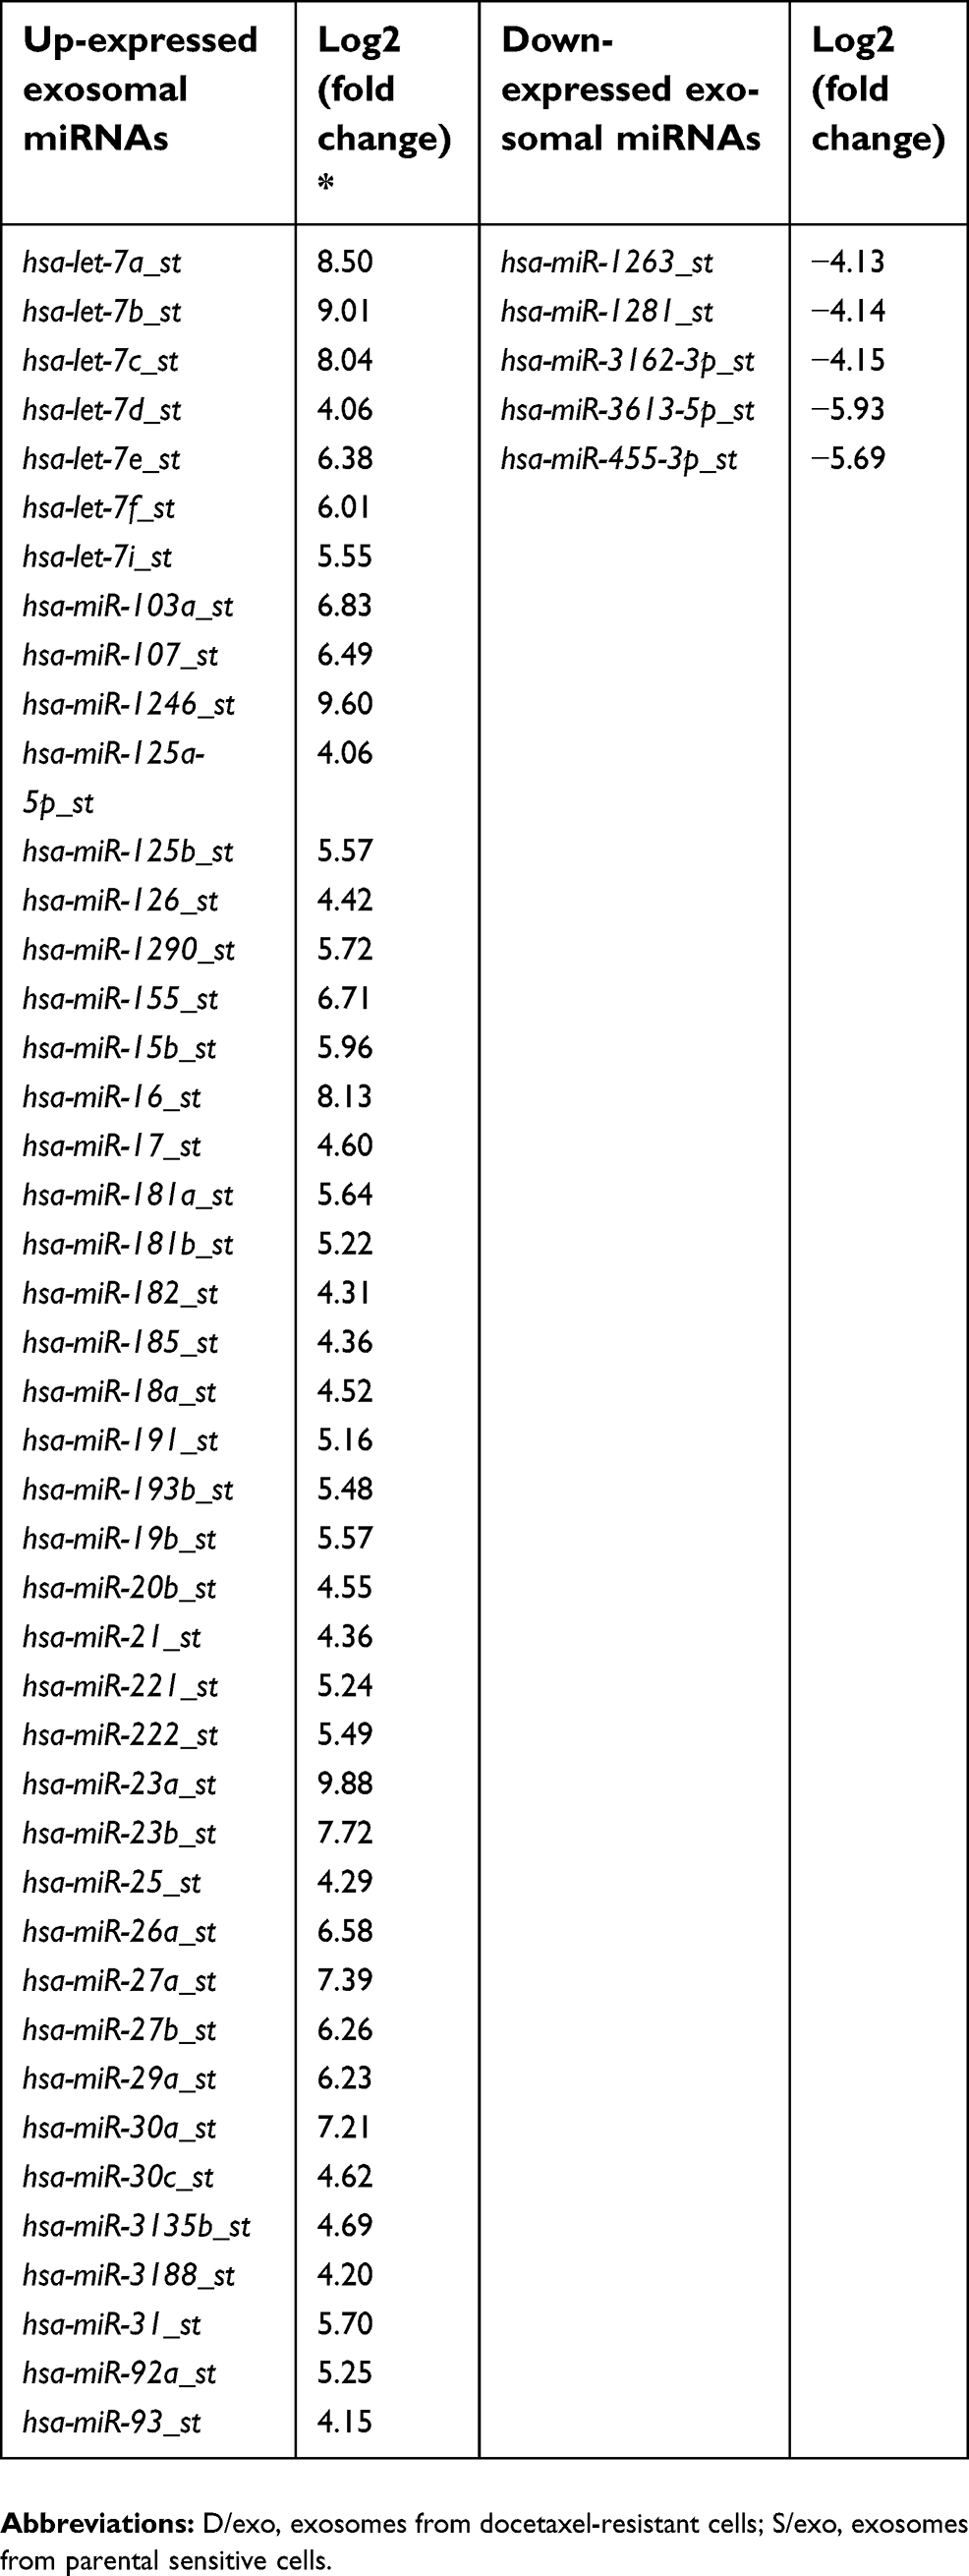
D/exo and S/exo had the same morphology and size, ranging from 20 to 100 nm in diameter, as observed by transmission electron microscopy (Figure 1A and B). Expressions of small RNAs in D/exo and S/exo were screened by microarray and then categorized into miRNA, CDBox, HacaBox, scaRNA, and snoRNA. A total of 66.5% from D/exo and 52.6% from S/exo were mapped onto miRNAs. Compared to S/exo, 208 and 99 miRNAs were significantly up-expressed and down-expressed (at least 2.0-fold changes), respectively, in D/exo. In all the differentially expressed miRNAs, D/exo had 44 novel miRNAs with increased expression levels >16.0-fold and five novel miRNAs with reduced expression levels >16.0-fold of the corresponding miRNAs in S/exo (Table 1). Hierarchical clustering analysis of miRNA signal intensities showed evidence of significant changes of miRNA expression in D/exo and S/exo (Figure 1C). The miRNA microarray data were further validated by PCR using the following selected exosomal miRNAs (miR-23a, miR-27a, miR-30a, and miR-222), and all trends of miRNA expression by PCR coincided with microarray (not shown).
 | Table 1 Novel miRNAs with expression levels >16.0-fold in D/exo with respect to S/exo |
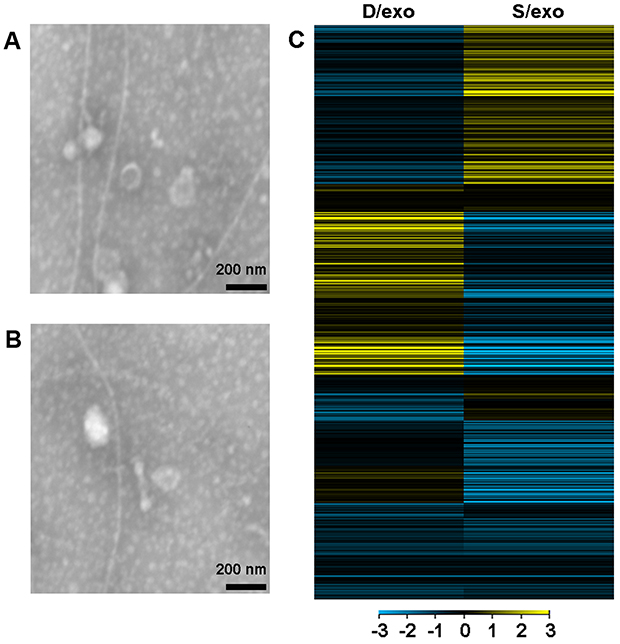 | Figure 1 Exosome characterization and miRNA profiling. Representative transmission electron microscopy images of D/exo (A) and S/exo (B), showing the same morphology and a diameter of 20–100 nm (scale bar, 200 nm). (C) Hierarchical cluster analysis of miRNA expression profiles in D/exo with respect to S/exo. Yellow and blue colors stand for a transcript level above and below the median level, respectively. Abbreviations: D/exo, exosomes from docetaxel-resistant cells; S/exo, exosomes from parental sensitive cells. |
Target gene prediction and pathway analysis
From the top 10 most differentially expressed miRNAs in D/exo, the nine most up-expressed miRNAs (let-7a, let-7b, let-7c, miR-103a, miR-16, miR-23a, miR-23b, miR-27a, and miR-30a) and eight most down-expressed miRNAs (miR-130a, miR-20b, miR-25, miR-425, miR-455-3p, miR-4725-5p, miR-551, and miR-92), which could be found in the starBase database, were selected for evaluation. The starBase tool was used for prediction, generating 1,857 potential target genes, including 953 genes for up-expressed miRNAs and 904 genes for down-expressed miRNAs.
To explore which pathways might be involved in chemoresistance formation, the predicted genes were assigned into the KEGG pathway, and Cytoscape software was applied to decipher the possible network. The enriched pathways for target genes of up-expressed miRNAs included “MicroRNAs in cancer”, “Signaling pathways regulating pluripotency of stem cells”, “MAPK signaling pathway”, “TGF-beta signaling pathway”, “FoxO signaling pathway”, and “Wnt signaling pathway”. For down-expressed miRNAs, the enriched pathways included “MAPK signaling pathway”, “TGF-beta signaling pathway”, “Pathways in cancer”, “FoxO signaling pathway”, “mTOR signaling pathway”, “PI3K/Akt signaling pathway”, and “Proteoglycans in cancer” (Figure 2). In breast cancer, these signaling pathways have been found to participate in drug resistance and treatment failure.22–26
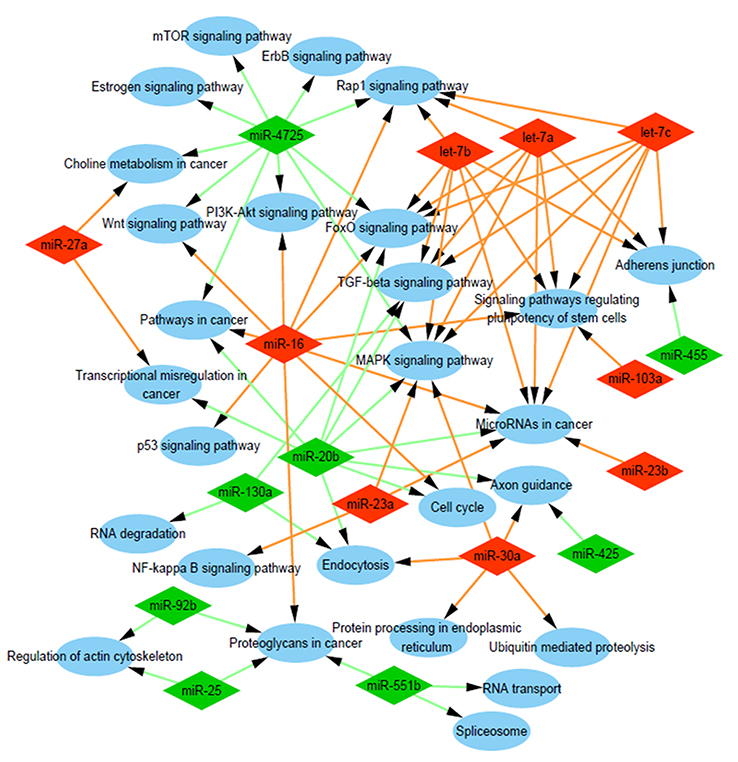 | Figure 2 Analysis of involved pathways. KEGG pathway analysis of target genes of the nine most up-expressed miRNAs and eight most down-expressed miRNAs in D/exo cells showed a functional network. Abbreviations: KEGG, Kyoto Encyclopedia of Genes and Genomes; D/exo, exosomes from docetaxel-resistant cells. |
GO enrichment and transcription factor analysis
To explore the role that predicted target genes play in biological functions, GO enrichment analysis was performed. The results showed that the selected miRNAs were significantly enriched in biological processes, including “protein phosphorylation/dephosphorylation”, “positive/negative regulation of transcription, DNA-templated”, “positive/negative regulation of cell proliferation”, and “positive/negative regulation of transcription from RNA polymerase II promoter” (Figure 3). For molecular function, the selected miRNAs were mainly related to “protein binding”, “kinase binding”, “DNA binding”, “ATP binding”, and “kinase activity” (Figure 4). In addition, cellular component analysis indicated that the selected miRNAs were involved in “cytoplasm”, “nucleoplasm”, “nucleus”, “membrane”, “cytosol”, and “cell–cell adherens junction” (Figure 5).
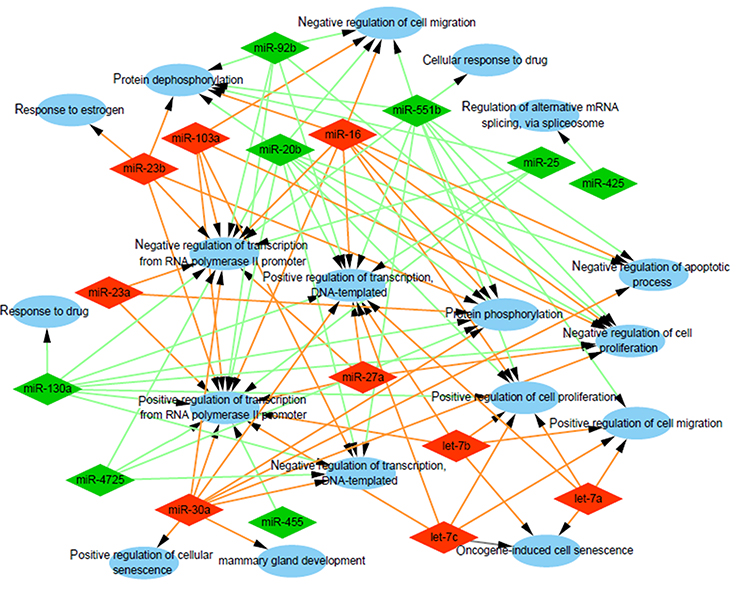 | Figure 3 Analysis of biological processes. Gene Ontology (GO) enrichment analysis of biological processes of the target genes showed a functional network. |
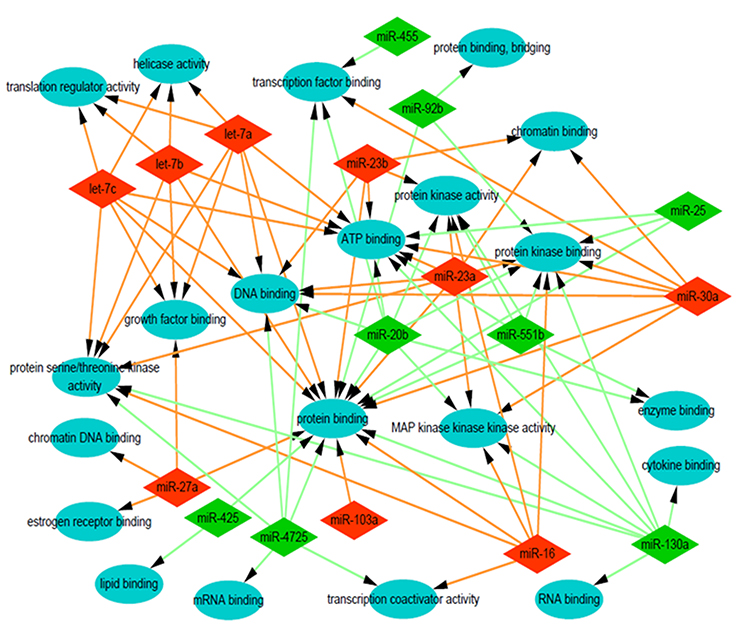 | Figure 4 Analysis of molecular function. Gene Ontology (GO) enrichment analysis of molecular functions of the target genes showed a functional network. |
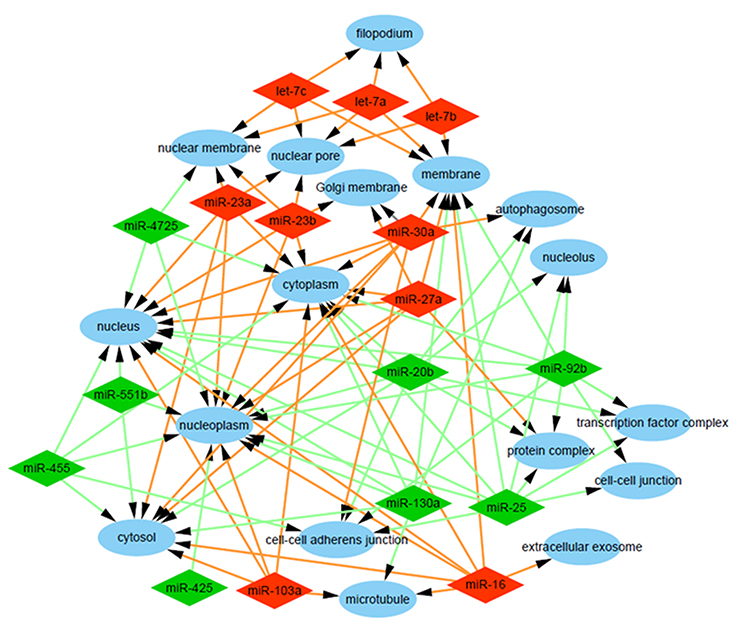 | Figure 5 Analysis of cellular components. Gene Ontology (GO) enrichment analysis of cellular components of the target genes showed a functional network. |
Based on data obtained from FunRich, the top 10 enriched transcription factors for the target genes of up-expressed miRNAs were SP1, SP4, KLF7, EGR1, HNF4A, POU2F1, ETS1, NF1C, NFYA, and MEF2A (Figure 6A). For the target genes of down-expressed miRNAs, the top 10 enriched transcription factors were SP1, SP4, EGR1, KLF7, POU2F1, ETS1, NFYA, NFIC, RREB1, and MEF2A (Figure 6B).
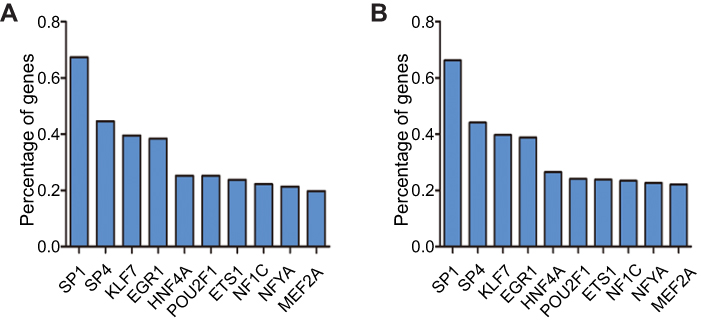 | Figure 6 Analysis of transcription factors. The top 10 most enriched transcription factors for the target genes of (A) up-expressed and (B) down-expressed exosomal miRNAs are presented |
PPI construction and selection of hub genes
According to the information obtained from STRING database, target genes of the selected miRNAs interacted with each other, and the PPI network consisted of 1,414 nodes and 12,272 edges. For better visualization, the top three modules with the top three highest MCODE scores were selected using the plug-in MCODE (Figure 7A–C). Enrichment pathway analysis indicated that the genes in the modules were mainly associated with “PI3K/Akt signaling pathway” and “mTOR signaling pathway” (Figure 7B and C). For the up-expressed miRNAs, the hub genes were CCND1, PTEN, BCL2, KRAS, MAP2K1, BTRC, XPO1, ACTA1, NRAS, and CREB1. CCND1 showed the highest node degree (degree =86). For the down-expressed miRNAs, the hub genes were PTEN, CCND1, CALM2, CDKN1A, STAT3, RB1, ITCH, ACTR1A, SP1, and CNOT6L. PTEN exhibited the highest node degree (degree =79) (Table 2).
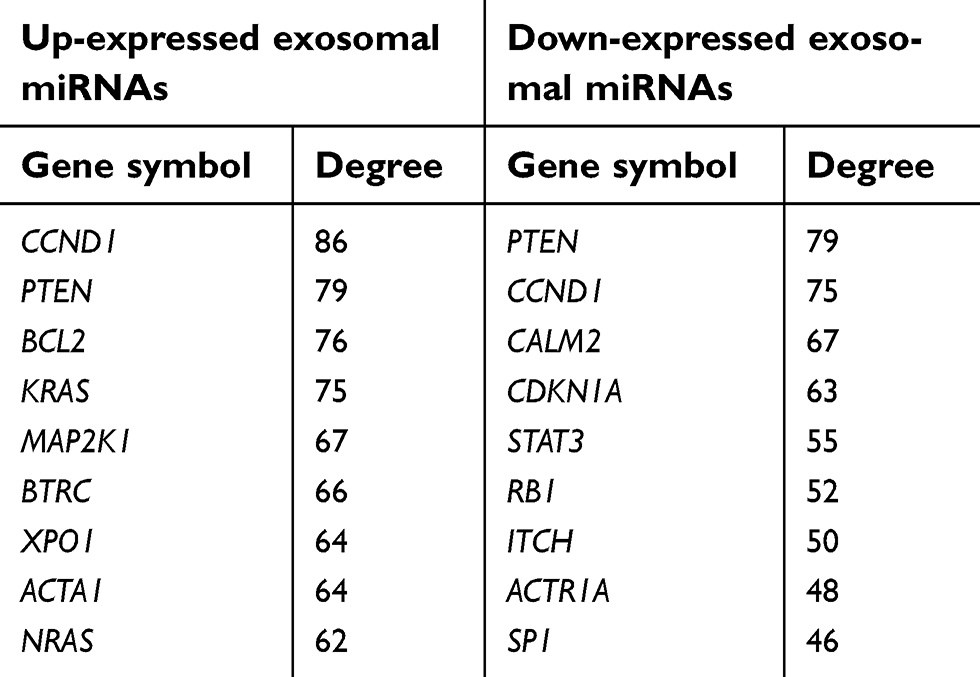 | Table 2 Hub genes identified in the protein–protein interaction network |
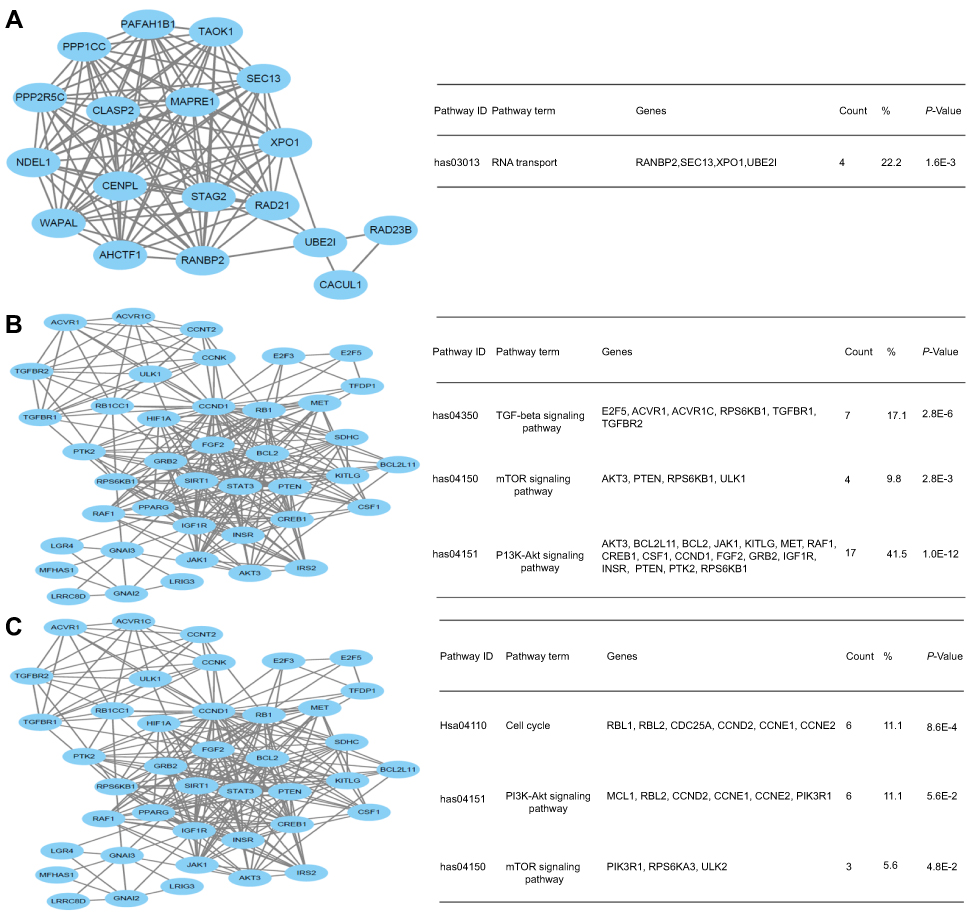 | Figure 7 Analysis of the protein–protein interaction network. (A) Module 1 and the enriched pathways. (B) Module 2 and the enriched pathways. (C) Module 3 and the enriched pathways. |
Discussion
Resistance to docetaxel is a major barrier for successful treatment of breast cancer. Understanding the molecular machinery is of critical importance for reversing drug insensitivity.2 Exosomal miRNAs have been confirmed to play important roles in the development of chemoresistance.4,5 Our previous group explored the miRNA expression profiles of three breast cancer cell lines, respectively resistant to docetaxel, epirubicin, and vinorelbine, and their exosomes, and demonstrated that a number of resistance-associated miRNAs were concentrated in the corresponding exosomes.7 Moreover, we confirmed that docetaxel-resistant breast cancer cells could transmit resistance capacity through altering gene expression in sensitive cells by transferring specific miRNAs contained within exosomes.10 It was also reported by our team that exosomal miR-1246 could promote cell proliferation, invasion pathways, and drug resistance in breast cancer.8 Therefore, the differential exosomal miRNA expression could partly explain docetaxel resistance in breast cancer cells. In the current study, bioinformatics analysis of miRNA signatures in exosomes from docetaxel-resistant and parental MCF-7 breast cancer cells was performed to investigate key pathways and biological functions associated with chemoresistance. To the best of our knowledge, this is the first report of integrative bioinformatics analysis of the dysregulated exosomal miRNAs in docetaxel-resistant MCF-7 breast cancer cells.
The microarray is increasingly valued as a promising tool in medical oncology, with many applications. In our previous study, we screened differentially expressed miRNAs between docetaxel-resistant and sensitive breast cancer cells.14 In the present work, miRNA expression profiles of D/exo and S/exo were also analyzed by microarray to explore which miRNAs might be responsible for exosome-mediated resistance transmission. With respect to S/exo, a total of 208 and 99 miRNAs were up-expressed and down-expressed in D/exo, indicating that D/exo were characterized by significant changes in miRNA expression and were miniature maps of their cells of origin. This result, along with our previous observation, is consistent with that of Zhong et al, who explored the miRNA expression profiles of three drug-resistant breast cancer cell lines and their exosomes and demonstrated that a number of resistance-associated miRNAs were concentrated in the isolated exosomes.7
During bioinformatics analysis, we followed the methods as previously described.7 KEGG pathway analysis was performed to check potentially involved pathways of target genes of the nine most up-expressed miRNAs and eight most down-expressed miRNAs in D/exo. From the results, a single exosomal miRNA could influence multiple pathways (eg, miRNA-16 and miRNA-20b) and the same pathway could be regulated by multiple miRNAs. Several classical signaling pathways associated with chemoresistance were identified from the top enriched KEGG terms, namely MAPK, TGF-beta, Wnt, mTOR, and PI3K/Akt signaling pathways. Breast cancer arises from a subpopulation of malignant cells with high tumor initiation and self-renewal capability, known as cancer stem cells, which are implicated to be a cause of metastasis, tumor relapse, and therapy resistance.27 The enriched pathways for target genes of both up-expressed exosomal miRNAs and down-expressed miRNAs contained “FoxO signaling pathway”. FoxO gene is considered to limit cell proliferation and induce apoptosis, serving as a mediator of tumor response to various therapies.24 Therefore, understanding the target genes involved in “signaling pathways regulating the pluripotency of stem cells” and “FoxO signaling pathway” may help to uncover the mechanisms of docetaxel resistance.
GO annotation and enrichment analysis demonstrated that the target genes of selected exosomal miRNAs were significantly enriched in functions involving transcription regulation, protein phosphorylation, kinase activity, and protein binding. Numerous studies have confirmed that defects of biological processes, molecular functions, and cellular components would influence cancer biology, promote cell proliferation, invasion, and metastasis, and change chemosensitivity.28 How these GO terms are implicated in drug resistance needs further investigation.
SP1, SP4, and EGR1 were the common enriched transcription factors for the target genes of up-expressed and down-expressed exosomal miRNAs. There is evidence that transformation of normal cells to malignant cells is associated with increased SP1 and SP4, which are highly expressed in cancer and responsible for cell growth, survival, migration, and drug resistance.29 A 2016 study indicated that EGR1 is an important regulator in a triple-negative breast cancer cell line and is a promising marker for docetaxel resistance.30 Therefore, exploring the possible transcription factors may represent another useful way toward the understanding of chemoresistance.
A PPI network was constructed and it was found that CCND1 and PTEN were the hub genes with the highest node degree among the targets of up-expressed and down-expressed exosomal miRNAs, respectively. CCND1 is required for the transition of cells from G1 to S phase and is overexpressed in up to 50% of human breast cancers.31 CCND1 orchestrated expression of a miRNA signature that induced the Wnt signaling pathway, serving both upstream and downstream of the Wnt cascade.32 Given the emerging nature of this field, we are currently trying to determine the association between exosomal miRNAs, CCND1, and the Wnt signaling pathway, and to verify their effects using gain- and loss-of-function assays. PTEN has emerged as the key functional antagonist to PI3K, controlling activation of the PI3K/AKT/mTOR signaling pathway. According to a 2017 meta-analysis, PTEN loss was of particular significance for predicting breast cancer aggressiveness and poor outcome.33 Our previous studies demonstrated that miR-222 could decrease the expression of PTEN, through which miR-222 may confer chemoresistance in breast cancer cells.14 In addition, we have confirmed that D/exo from docetaxel-resistant breast cancer cells were able to down-regulate PTEN expression.10 Analysis of the top three highest modules revealed the involvement of the genes in the PI3K/Akt signaling pathway and the mTOR signaling pathway. These results support that PTEN and the PI3K/Akt signaling pathway may be central points in exploring exosomal miRNA’s role in chemoresistance formation. More experiments are necessary to support this conclusion.
Conclusions
In summary, our work provides a comprehensive bioinformatic analysis of the dysregulated miRNAs in exosomes from docetaxel-resistant and parental sensitive breast cancer cells. After target gene prediction, KEGG pathways, GO terms, transcription factors, PPI network, and hub genes were evaluated. Further laboratory studies are needed to more precisely investigate the functions of target genes and pathways of exosomal miRNAs in the formation of chemoresistance.
Data availability
The data sets analyzed during the current study are available from the corresponding author on reasonable request.
Acknowledgments
This work was supported by grants from the Natural Science Foundation of China (81702591) and the Natural Science Foundation of Jiangsu Province (BK20170294).
Author contributions
All authors contributed to data analysis, drafting and revising the article, gave final approval of the version to be published, and agree to be accountable for all aspects of the work.
Disclosure
The authors report no conflicts of interest in this work.
References
1. DeSantis CE, Ma J, Goding Sauer A, Newman LA, Jemal A. Breast cancer statistics, 2017, racial disparity in mortality by state. CA Cancer J Clin. 2017;67(6):439–448. doi:10.3322/caac.21412
2. Gottesman MM. Mechanisms of cancer drug resistance. Annu Rev Med. 2002;53:615–627. doi:10.1146/annurev.med.53.082901.103929
3. Tkach M, Thery C. Communication by extracellular vesicles: where we are and where we need to go. Cell. 2016;164(6):1226–1232. doi:10.1016/j.cell.2016.01.043
4. Chin AR, Wang SE. Cancer-derived extracellular vesicles: the “soil conditioner” in breast cancer metastasis? Cancer Metastasis Rev. 2016;35(4):669–676. doi:10.1007/s10555-016-9639-8
5. Chen WX, Zhong SL, Ji MH, et al. MicroRNAs delivered by extracellular vesicles: an emerging resistance mechanism for breast cancer. Tumour Biol. 2014;35(4):2883–2892. doi:10.1007/s13277-013-1417-4
6. Santos JC, Ribeiro ML, Sarian LO, Ortega MM, Derchain SF. Exosomes-mediate microRNAs transfer in breast cancer chemoresistance regulation. Am J Cancer Res. 2016;6(10):2129–2139.
7. Zhong S, Chen X, Wang D, et al. MicroRNA expression profiles of drug-resistance breast cancer cells and their exosomes. Oncotarget. 2016;7(15):19601–19609. doi:10.18632/oncotarget.7481
8. Li XJ, Ren ZJ, Tang JH, Yu Q. Exosomal MicroRNA MiR-1246 promotes cell proliferation, invasion and drug resistance by targeting CCNG2 in breast cancer. Cell Physiol Biochem. 2017;44(5):1741–1748. doi:10.1159/000485780
9. Wei Y, Lai X, Yu S, et al. Exosomal miR-221/222 enhances tamoxifen resistance in recipient ER-positive breast cancer cells. Breast Cancer Res Treat. 2014;147(2):423–431. doi:10.1007/s10549-014-3037-0
10. Chen WX, Cai YQ, Lv MM, et al. Exosomes from docetaxel-resistant breast cancer cells alter chemosensitivity by delivering microRNAs. Tumour Biol. 2014;35(10):9649–9659. doi:10.1007/s13277-014-2242-0
11. Wang X, Zhang H, Bai M, et al. Exosomes serve as nanoparticles to deliver Anti-miR-214 to reverse chemoresistance to cisplatin in gastric cancer. Mol Ther. 2018;26(3):774–783. doi:10.1016/j.ymthe.2018.01.001
12. Li WJ, Zhong SL, Wu YJ, et al. Systematic expression analysis of genes related to multidrug-resistance in isogenic docetaxel- and adriamycin-resistant breast cancer cell lines. Mol Biol Rep. 2013;40(11):6143–6150. doi:10.1007/s11033-013-2725-x
13. Corcoran C, Rani S, O’Brien K, et al. Docetaxel-resistance in prostate cancer: evaluating associated phenotypic changes and potential for resistance transfer via exosomes. PLoS One. 2012;7(12):e50999. doi:10.1371/journal.pone.0050999
14. Zhong S, Li W, Chen Z, Xu J, Zhao J. MiR-222 and miR-29a contribute to the drug-resistance of breast cancer cells. Gene. 2013;531(1):8–14. doi:10.1016/j.gene.2013.08.062
15. Li JH, Liu S, Zhou H, Qu LH, Yang JH. starBase v2.0: decoding miRNA-ceRNA, miRNA-ncRNA and protein-RNA interaction networks from large-scale CLIP-Seq data. Nucleic Acids Res. 2014;42(Database issue):D92–D97. doi:10.1093/nar/gkt1248
16. Huang DW, Sherman BT, Tan Q, et al. DAVID Bioinformatics Resources: expanded annotation database and novel algorithms to better extract biology from large gene lists. Nucleic Acids Res. 2007;35(Web Server issue):W169–W175. doi:10.1093/nar/gkm415
17. Kanehisa M, Araki M, Goto S, et al. KEGG for linking genomes to life and the environment. Nucleic Acids Res. 2008;36(Database issue):D480–D484. doi:10.1093/nar/gkm882
18. Ashburner M, Ball CA, Blake JA, et al. Gene ontology: tool for the unification of biology. The Gene Ontology Consortium. Nat Genet. 2000;25(1):25–29. doi:10.1038/75556
19. Saito R, Smoot ME, Ono K, et al. A travel guide to Cytoscape plugins. Nat Methods. 2012;9(11):1069–1076. doi:10.1038/nmeth.2212
20. Benito-Martin A, Peinado H. FunRich proteomics software analysis, let the fun begin! Proteomics. 2015;15(15):2555–2556. doi:10.1002/pmic.v15.15
21. Szklarczyk D, Franceschini A, Kuhn M, et al. The STRING database in 2011: functional interaction networks of proteins, globally integrated and scored. Nucleic Acids Res. 2011;39(Database issue):D561–D568. doi:10.1093/nar/gkq973
22. Sebolt-Leopold JS, Herrera R. Targeting the mitogen-activated protein kinase cascade to treat cancer. Nat Rev Cancer. 2004;4(12):937–947. doi:10.1038/nrc1503
23. Wang SE, Xiang B, Guix M, et al. Transforming growth factor beta engages TACE and ErbB3 to activate phosphatidylinositol-3 kinase/Akt in ErbB2-overexpressing breast cancer and desensitizes cells to trastuzumab. Mol Cell Biol. 2008;28(18):5605–5620. doi:10.1128/MCB.00787-08
24. Coomans de Brachene A, Demoulin JB. FOXO transcription factors in cancer development and therapy. Cell Mol Life Sci. 2016;73(6):1159–1172. doi:10.1007/s00018-015-2112-y
25. Loh YN, Hedditch EL, Baker LA, Jary E, Ward RL, Ford CE. The Wnt signalling pathway is upregulated in an in vitro model of acquired tamoxifen resistant breast cancer. BMC Cancer. 2013;13:174. doi:10.1186/1471-2407-13-174
26. Dey N, De P, Leyland-Jones B. PI3K-AKT-mTOR inhibitors in breast cancers: from tumor cell signaling to clinical trials. Pharmacol Ther. 2017;175:91–106. doi:10.1016/j.pharmthera.2017.02.037
27. Korkaya H, Liu S, Wicha MS. Breast cancer stem cells, cytokine networks, and the tumor microenvironment. J Clin Invest. 2011;121(10):3804–3809. doi:10.1172/JCI57873
28. Hanahan D, Weinberg RA. Hallmarks of cancer: the next generation. Cell. 2011;144(5):646–674. doi:10.1016/j.cell.2011.02.013
29. Safe S, Abbruzzese JL, Abdelrahim M, Hedrick E. Specificity protein transcription factors and cancer: opportunities for drug development. Cancer Prev Res (Phila). 2018;11:371–382. doi:10.1158/1940-6207.CAPR-17-0407
30. Lasham A, Mehta SY, Fitzgerald SJ, et al. A novel EGR-1 dependent mechanism for YB-1 modulation of paclitaxel response in a triple negative breast cancer cell line. Int J Cancer. 2016;139(5):1157–1170. doi:10.1002/ijc.30137
31. Elsheikh S, Green AR, Aleskandarany MA, et al. CCND1 amplification and cyclin D1 expression in breast cancer and their relation with proteomic subgroups and patient outcome. Breast Cancer Res Treat. 2008;109(2):325–335. doi:10.1007/s10549-007-9659-8
32. Wang G, Gormley M, Qiao J, et al. Cyclin D1-mediated microRNA expression signature predicts breast cancer outcome. Theranostics. 2018;8(8):2251–2263. doi:10.7150/thno.23877
33. Xu F, Zhang C, Cui J, Liu J, Li J, Jiang H. The prognostic value and potential drug target of phosphatase and tensin homolog in breast cancer patients: a meta-analysis. Medicine. 2017;96(36):e8000. doi:10.1097/MD.0000000000008000
 © 2019 The Author(s). This work is published and licensed by Dove Medical Press Limited. The
full terms of this license are available at https://www.dovepress.com/terms
and incorporate the Creative Commons Attribution
- Non Commercial (unported, 3.0) License.
By accessing the work you hereby accept the Terms. Non-commercial uses of the work are permitted
without any further permission from Dove Medical Press Limited, provided the work is properly
attributed. For permission for commercial use of this work, please see paragraphs 4.2 and 5 of our Terms.
© 2019 The Author(s). This work is published and licensed by Dove Medical Press Limited. The
full terms of this license are available at https://www.dovepress.com/terms
and incorporate the Creative Commons Attribution
- Non Commercial (unported, 3.0) License.
By accessing the work you hereby accept the Terms. Non-commercial uses of the work are permitted
without any further permission from Dove Medical Press Limited, provided the work is properly
attributed. For permission for commercial use of this work, please see paragraphs 4.2 and 5 of our Terms.