Back to Journals » International Journal of Nanomedicine » Volume 14
Biodistribution and sensitive tracking of immune cells with plasmonic gold nanostars
Authors Liu Y, Huang W ![]() , Xiong C, Huang Y
, Xiong C, Huang Y ![]() , Chen BJ, Racioppi L, Chao N, Vo-Dinh T
, Chen BJ, Racioppi L, Chao N, Vo-Dinh T ![]()
Received 7 January 2019
Accepted for publication 13 March 2019
Published 9 May 2019 Volume 2019:14 Pages 3403—3411
DOI https://doi.org/10.2147/IJN.S192189
Checked for plagiarism Yes
Review by Single anonymous peer review
Peer reviewer comments 2
Editor who approved publication: Dr Thomas Webster
Yang Liu,1,* Wei Huang,2,* Chuanfeng Xiong,2 Yuxian Huang,2 Benny J Chen,2,3 Luigi Racioppi,2,4 Nelson Chao,2,3 Tuan Vo-Dinh1,3,5–6
1Department of Biomedical Engineering, Duke University, Durham, NC 27708, USA; 2Department of Medicine, Duke University Medical Center, Durham, NC 27710, USA; 3Duke Cancer Institute, Duke University Medical Center, Durham, NC 27710, USA; 4Department of Molecular Medicine and Medical Biotechnology, University of Naples Federico II, Naples 80131, Italy; 5Fitzpatrick Institute for Photonics, Duke University, Durham, NC 27708, USA; 6Department of Chemistry, Duke University, Durham, NC 27708, USA
*These authors contributed equally to this work
Aim: To quantitatively and sensitively investigate the biodistribution of immune cells after systemic administration.
Methods: Immune cells were loaded with plasmonic gold nanostars (GNS) tracking probes. Inductively coupled plasma mass spectrometry (ICP-MS) was used for quantitative gold mass measurement and two-photon photoluminescence (TPL) was used for high-resolution sensitive optical imaging.
Results: GNS nanoparticles were loaded successfully into immune cells without negative effect on cellular vitality. Liver and spleen were identified to be the major organs for macrophage cells uptake after systematic administration. A small amount of macrophage cells were detected in the tumor site in our murine lymphoma animal model.
Conclusion: GNS has great potential as a biocompatible marker for quantitative tracking and high-resolution imaging of immune cells at the cellular level.
Keywords: GNS, ICP-MS, two-photon microscopy, immune cells, biodistribution
Introduction
Immune cell-based therapy has attracted increasing interest because of its therapeutic potential in drug delivery and immune regulation. By taking advantage of the immune cells’ intrinsic physiological functions, modified immune cells can migrate to different sites inside the body, and regulate immunity systemically and/or locally, thus providing new approaches for autoimmune and cancer therapies.1,2 In 2017, engineered T cell therapy has been approved by FDA for the treatment of children acute lymphoblastic leukemia and adult advanced lymphomas.3,4 For preclinical studies, neutrophil cells have been investigated to overcome the blood-brain barrier (BBB) for drug delivery to brain tumors.5
Recent research has revealed the great potential of myeloid cells as ideal candidates for cell-based drug delivery systems.6–8 Myeloid cells, including monocytes, dendritic cells, and macrophages, are wildly distributed in various tissues, and regulate immunity locally and/or systemically. These cells have the ability to phagocytize particles including nanoparticles, pass biological barriers, and carry therapeutics from circulation to inflammation sites and hypoxic tumor areas.9–13 Besides these characteristics, myeloid-derived suppressor cells (MDSC), a group of immature myeloid cells developed under pathological conditions, have been reported to have the capability to travel to tumor sites, differentiate into macrophage or dendritic cells according to the microenvironment, and regulates anti-tumor immunity.14–16 Recently, macrophage cells have been investigated to deliver drugs to inflammation and cancer sites.17,18 However, the practical utilization of myeloid cells for drug delivery still needs further investigations.
Sensitive and quantitative cell tracking methods are crucial to further investigate cell-based therapies’ underlying mechanism and improve their therapeutic efficacy with the ultimate goal to improve patients’ outcome.19,20 Various cell labeling methods have been developed in previous studies, including firefly luciferase for bioluminescence imaging, quantum dots for fluorescence imaging, iron oxide nanoparticles for magnetic resonance imaging (MRI) and 18-fluorobenzoate for positron emission tomography.19,21 Bioluminescence requires cells to be transfected with a reporter gene, which is challenging due to low transfection efficiency and the weak signal at the single-cell level.22 Fluorescence dyes have been used to label cells, but no quantitative biodistribution information can be obtained due to the low light penetration depth.23 MRI can perform 3D tracking, but the results are not quantitative.24 PET can perform quantitative 3D monitoring but the resolution is not high enough to achieve single-cell level.25 So far, no single labeling method can investigate both the quantitative whole-body biodistribution and sensitive imaging down to single-cell level.
Our group has developed a novel method without using the toxic surfactant to synthesize star-shaped gold nanoparticles, referred to as gold nanostars (GNS), which have superior high two-photon photoluminescence (TPL) with tip-enhanced plasmonics for sensitive optical imaging.26 It has been reported that the signal for GNS is up to 4 orders of magnitude higher than that for traditional organic dyes or gold nanospheres.27 Furthermore, GNS gold mass can also be measured using mass spectrometry method, thus providing a quantitative method for in vivo biodistribution study. The TAT peptide derived from the transactivator of transcription (TAT) of the human immunodeficiency virus has been reported to increase nanoparticles’ cell uptake.28 In this study, we applied TAT-peptide functionalized GNS nanoparticles as a new tracking method to investigate immune cells’ fate after systemic administration with a murine lymphoma animal model. Experiment results show that, due to the extremely intense two-photon photoluminescence signal of GNS, our immune cell tracking strategy with GNS enables sensitive imaging down to the single-cell level as well as quantitative biodistribution study with ICP-MS, which is superior to the tracking method with iron oxide nanoparticles and MRI imaging.
Materials & methods
Nanoparticle synthesis and characterization
GNS nanoparticles were synthesized following the method reported by our lab before.29 Chemicals were purchased from Sigma-Aldrich (St. Louis, MO, USA). In brief, 12 nm gold nanospheres obtained by reducing HAuCl4 with sodium citrate were used as seeds for GNS synthesis. 0.4 ml synthesized gold nanospheres solution was added to 40 ml of water solution with 1 mM of HCl and 0.25 mM of HAuCl4, immediately followed with the simultaneous addition of 1 ml of 0.8 mM AgNO3 and 1 ml of 0.02 M ascorbic acid under vigorous stirring. 200 μl of 2 mM PEG-SH (MW 6,000) were added and incubated overnight. The synthesized PEGylated GNS solution was condensed into 1 ml with centrifugation at 6000 rcf for 30 min. 200 μl of 10 mM TAT-peptide in ethanol was added to 1 ml condensed GNS solution and incubated for 24 hrs. Then the obtained GNS nanoparticles were purified using a centrifuge filter with the 100,000 Da molecular weight cut off three times for further experiments.
The synthesized GNS nanoparticles were imaged using transmission electron microscopy (TEM) under 160 kV (Tecnai G2 Twin, FEI, OR, USA). The VIS-NIR extinction spectrum was measured with Cary 6000i UV-Vis-NIR spectrometer (Agilent Technologies, Santa Clara, USA). Nanoparticle size distribution and number concentration were obtained by nanoparticle tracking analysis (NTA) method with Nanosight 500 (Malvern Panalytical, Malvern, UK). The gold mass was measured with 7900 ICP-MS (Agilent Technologies, Santa Clara, USA).
Immune cells generation and GNS loading
C57BL/6J mice were purchased from Jackson Laboratory (CA, USA). The bone marrow-derived myeloid cells, including bone marrow-derived dendritic cells (BMDC), MDSC, and bone marrow-derived macrophages (BMDM), were generated following modified protocols as previously published.30–34 In brief, cells were separated from bone marrows followed by red blood cell depletion. For MDSC, cells were cultured in 5 ml DMEM (Gibco, MA, USA) supplied with 10% FBS, 2 mM L-glutamine, 1.5 g/L sodium bicarbonate, 10 mM HEPES, 1.0 mM sodium pyruvate (all from Gibco, MA, USA), 10% fetal bovine serum (Hyclone, MA, USA), 40 ng/ml recombinant mouse GM-CSF and 40 ng/ml recombinant mouse IL-6 (Biolegend, CA, USA), with 50% E.G7 supernatant. The floating cells were collected on Day 4. For DC, cells were cultured in 5 ml DMEM (Gibco, MA, USA) supplied with 10% FBS, 2 mM L-glutamine, 1.5 g/L sodium bicarbonate, 10 mM HEPES, 1.0 mM sodium pyruvate (all from Gibco, MA, USA), 10% fetal bovine serum (Hyclone, MA, USA), 10 ng/ml recombinant mouse GM-CSF and 10 ng/ml recombinant mouse IL-4 (Biolegend, CA, USA). Culture media was half-changed on Day 3, and the floating cells were collected on Day 5. For macrophages, cells were seeded into ultra-low attachment plates (Corning, USA) in 5 ml DMEM (Gibco, MA, USA) supplied with 10% FBS, 2 mM L-glutamine, 1.5 g/L sodium bicarbonate, 10 mM HEPES, 1.0 mM sodium pyruvate (all from Gibco, MA, USA), 10% fetal bovine serum (Hyclone, MA, USA), and 35% L929 supernatant. Macrophages were collected on Day 5. For GNS loading, cell culture supernatants were removed and replaced by complete DMEM with GNS for different time points as indicated. The used GNS concentration is 0.1 nM except specifically mentioned. The GNS concentration was measured by using the Nanoparticle Tracking Analysis method with the Nanosight 500 instrument. Cells were then washed with PBS twice for further experiments. In order to quantify GNS nanoparticle number per cell, we first calculated gold mass per GNS nanoparticle based on the measurement of nanoparticle number using Nanoparticle Tracking Analysis method and gold mass using ICP-MS method. After that, with gold mass per cell measured from ICP-MS, the GNS number per cell can be calculated.
Cytospin
Cells were washed twice in plain PBS, resuspended at the concentration of 2×10⁴ cells/200μl in complete RPMI supplied with 50% FBS, and carefully added to the assembled cuvettes with mounted slides. The cells were spun down at 500 rpm for 5 min. The slides were detached from the cuvettes, dried in air for 30 min and followed by 4% paraformaldehyde (PFA) fixation for another 30 min at room temperature. The slides were then stained with DAPI mountant (ThermoFisher, MA, USA), mounted with cover slides, and stored at 4 °C until optical imaging.
Flow cytometry
Cells were washed and collected to flow tubes and spun down. For cell apoptosis, the cells were stained with PE-Annexin V and 7-AAD (BD Bioscience, CA, USA) as manufacture protocol instructed. For costimulatory factor staining, cells were stained with FITC anti-mouse CD80, PE anti-mouse CD274, PE-Cy5 anti-mouse CD40 (all from eBioscience, CA, USA), PE-Cy7 anti-mouse/human CD11b, APC anti-mouse CD86, and APC-Cy7 anti-mouse CD11c (all from BioLegend, CA, USA). The stained cells were incubated for 10 min in room temperature, washed with PBS, and analyzed using a BD FACSCanto flow cytometer (BD, NJ, USA). Data were analyzed using FlowJo (TreeStar, OR, USA).
Murine tumor model
E.G7 cells for murine lymphoma model were purchased from American Type Tissue Culture Collection (Rockville, MD, USA). Cells were cultured in RPMI 1640 (Gibco, MA, USA) supplied with 4.5 g/L glucose (Sigma-Aldrich, MO, USA), 2 mM L-glutamine, 1.5 g/L sodium bicarbonate, 10 mM HEPES, 1.0 mM sodium pyruvate (all from Gibco, MA, USA), 0.05 mM 2-mercaptoethanol, 0.4 mg/ml G418 (Sigma-Aldrich, MO, USA), and 10% fetal bovine serum (Hyclone, MA, USA) in humidified 37 °C CO2 incubator. 5×10⁵ E.G7 cells were subcutaneously injected to the flank of the mice. Tumor sizes were measured with calibrator every 3–4 days and calculated as Length×Width×Width /2. When the tumor size reached 0.5–1 cm3, 2×10⁶ of macrophage cells incubated with GNS were injected into mice through the tail vein. Mice were sacrificed at different time points after cell injection as indicated, or as tumor size reached 2 cm3. The tumors and vital organs of interest were removed using sterilized sectioning scissors and forceps from sacrificed animals. The tissue samples were embedded in paraffin and then sectioned for optical imaging, or digested with aqua regia for ICP-MS measurement. All the mice studies were approved by the Duke University Institutional Animal Care and Use Committee, and followed the guidelines from National Institute of Health and Duke University Institutional Animal Care and Use Committee.
Results
The synthesized GNS nanoprobe was characterized by transmission electron microscopy, Vis-NIR extinction spectroscopy and nanoparticle tracking analysis. The mean particle size of GNS nanoprobe is 65 nm and the plasmon peak is at 860 nm (Figure 1). All three types of primary immune cells (macrophage cells, dendritic cells, and MDSC) were successfully labeled with GNS and exhibited strong signal under TPL imaging (Figure 2). Cells with GNS were digested with aqua regia, and then ICP-MS was performed to quantify GNS number per cell. It was calculated that on average DC, MDSC and macrophage cell has 4,100±500, 2,700±600, 16,900±2,800 (2 h incubation) and 31,100±7,800, 18,600±2,100, 59,400±7,700 (16 h incubation) GNS nanoparticles, respectively.
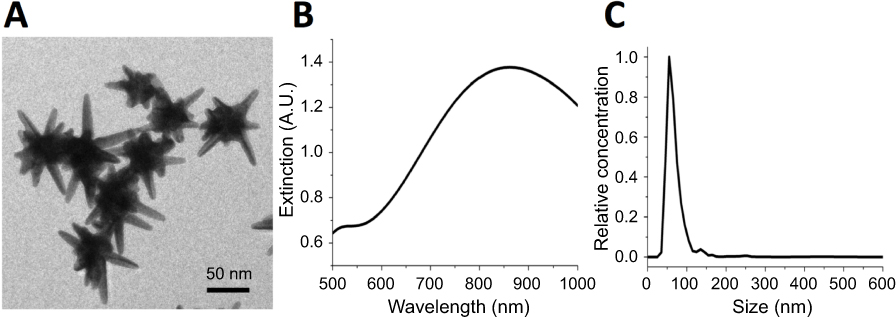 | Figure 1 Characterization of synthesized gold nanostars (GNS) probes. (A) Transmission electron microscopy (TEM) imaging of GNS nanoprobe. The scale bar is 50 nm (B) Vis-NIR extinction spectrum of 0.1 nM GNS solution in water. The plasmonic peak is at 860 nm. (C) GNS nanoparticle size distribution measured by nanoparticle tracking analysis (NTA). The mean particle hydrodynamic size is 65 nm. |
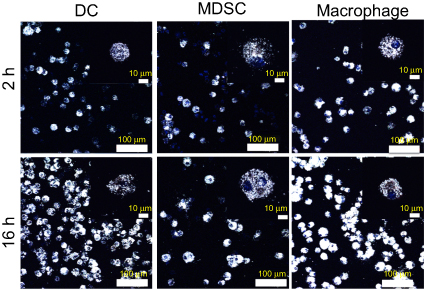 | Figure 2 Immune cells loading with GNS nanoprobes. TPL imaging for dendritic cells (DC), myeloid-derived suppressor cells (MDSC) and macrophage cells after 2 h or 16 h incubation with TAT-functionalized GNS. Blue, DAPI stained cell nucleus. White, GNS. Scale bar is 100 μm and 10 μm (zoom in). Abbreviations: GNS, gold nanostars; TPL, two-photon photoluminescence; TAT, transactivator of transcription. |
To understand if GNS induced cell apoptosis, we incubated different types of bone marrow-derived myeloid cells including MDSC, DC, and macrophage with GNS for 2 h or 16 h. Cells were then stained for Annexin V and 7-AAD to distinguish cell vitality. After both 2 h and 16 h incubation with GNS, the percentages of Annexin V- 7-AAD live cells were comparable or slightly increased compared to control cells in all cell types (Figure 3). This result suggested that GNS incubation would not have a negative effect on cell vitality.
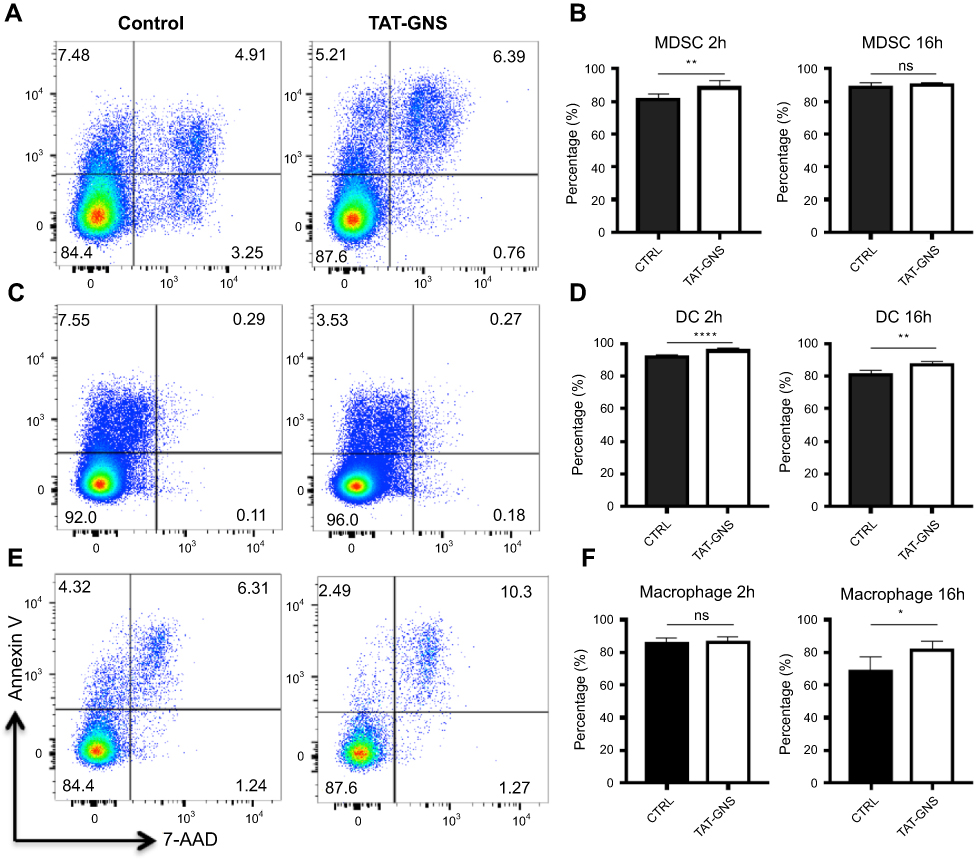 | Figure 3 Cell vitality tests after GNS loading. MDSCs, DCs, and macrophages were incubated with or without TAT-GNS for 2 h or 16 h, respectively. Cells were then washed, stained for vitality markers, and detected by flow cytometry. (A, C, E) Representative plots for vitality staining of MDSC, DC, macrophages, respectively, after 2 h culture. (B, D, F) Quantification of AnnexinV- 7AAD- live cells for MDSC, DC, macrophages, respectively, after 2 h or 16 h culture. n=5. * p<0.05; ** p<0.01; **** p<0.0001. Abbreviations: GNS, gold nanostars; MDSC, myeloid-derived suppressor cells; TAT, transactivator of transcription; DC, dendritic cells; ns, no significance. |
We choose macrophage cells for the following in vivo biodistribution studies because they play crucial roles in inflammation and tumor microenvironment. Besides, macrophage also shows the highest GNS loading capacity at the single cell level among three immune cells tested. After incubation with cell culture media containing 0.1 nM TAT-functionalized GNS for 16 h, 2×10⁶ macrophage cells were systematically administrated by intravenous injection through the tail vein into E.G7 tumor-bearing mice.
Quantitative biodistribution of macrophage cells at three different time points (4 h, 24 h, and 120 h) after IV injection is shown in Figure 4. It can be seen that liver, spleen, and lung are the three major organs for macrophage cells uptake. They initially accumulate in liver (46.5% ID/g), spleen (151.2% ID/g) and lung (111.5% ID/g) at the 4 h time point. After that, the liver and spleen uptakes increase to 90.7%ID/g and 237.3%ID/g while the lung uptake decreases to 41.1%ID/g at the 24 h time point. The lung uptake further decreased to 9.0% ID/g at the 120 h time point. The uptake in bone did not change significantly in the initial 24 hrs but increases from 3.8% ID/g to 9.7% ID/g between 24 h and 120 h, indicating the tendency for macrophages to home the bone marrow after systematic administration. The tumor had minimal macrophage cells uptake (0.2, 0.3 and 0.2% ID/g) at all three time points.
 | Figure 4 Macrophage cells biodistribution after systemic administration. Quantitative biodistribution of GNS-labeled macrophage cells 4 h, 24 h, and 120 h after tail vein injection and analyzed by ICP-MS method. Error bars shows standard deviation (n=4). Liver, spleen, and lung are three major organs with macrophage cells uptake. The tumor has minimal macrophage cells accumulation. % ID/g is defined as the percentage injected dose per gram tissue.Abbreviations: ICP-MS, inductively coupled plasma mass spectrometry; GNS, gold nanostars. |
As shown in Figure 5, the high-resolution TPL imaging confirmed that liver, spleen, and lung had high macrophage cells accumulation. The macrophage cell number in the lung can also be found to decrease after 4h. Few macrophage cells could be found inside the tumor tissue. The TPL high-resolution imaging results are consistent with quantitative biodistribution obtained from ICP-MS. The macrophage cell with a large number of GNS uptake shows an intensively bright nanoparticle cluster and we can identify macrophage cells sensitively in the tissue. Experiment results showed that a single macrophage cell loaded with GNS could be imagined, which demonstrated the sensitive cell tracking capability of GNS under TPL.
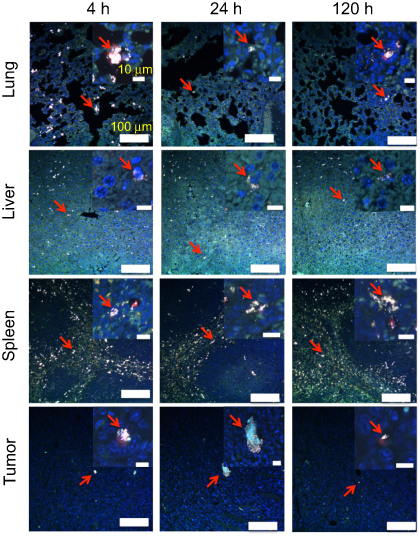 | Figure 5 Macrophage cell tracking with GNS. TPL imaging of DAPI stained tissue section 4 h, 24 h or 120 h after the systematic administration of GNS-loaded macrophage cells into mice with E.G7 tumor. The red arrow shows GNS-loaded macrophage cells. GNS nanoparticles are shown as white spots under TPL. Scale bar is 100 μm and 10 μm (zoom in). Abbreviations: GNS, gold nanostars; TPL, two-photon photoluminescence. |
Discussion
In this study, we have successfully loaded immune cells (DC, MDSC, and macrophage) with GNS and performed quantitative biodistribution study of macrophage cells after systematic administration through tail vein injection. Based on the quantitative ICP-MS analysis, the loaded GNS number increased between 2 h and 16 h incubation for all three immune cells. The synthesized GNS’ two-photon action cross sections (TPACS) was reported to be 1.1×10⁴ higher than that of Rhodamine B and more than 1 million Göeppert-Mayer (GM) units.26 In addition, another study has compared TPACS between GNS and other gold nanoparticles. The TPACS were reported to be 83 (nanosphere), 500 (nanocube), 1.5×10³ (nanotriangle), 4.2×10⁴ (nanorod) and 4.0×10⁶ (nanostar).27 Therefore, GNS can be used as a sensitive tracking agent. High-resolution TPL imaging confirmed GNS could be loaded into immune cells after 2 h incubation and the loaded GNS number increased with incubation time. Macrophages had the highest particle uptake in all three immune cells, reached up to 59,400 GNS per cell at 16 h, followed by DC, while MDSC had the lowest particle uptake at the single-cell level. This might be due to different cell size, given that macrophages have the largest size on average. Even though DC and MDSC have similar cell sizes, the GNS particle uptake is significantly lower in MDSC than that in DC. This may be related to the immature status of MDSCs, which limits the function of phagocytosis and the subsequent antigen-presenting capability. Gold nanoparticles have been reported to be biocompatible in previous studies.35,36 In our experiment, we used flow cytometry for cell vitality investigation to demonstrate that GNS loading did not result in a negative effect on the vitality of all three tested immune cells after 2 h and 16 h. Our results are consistent with those reported in a previous study.37 Considering the nanoparticle-loading capacity, in vitro generated macrophages would be a promising candidate among different immune cells for drug delivery.
One crucial problem for cell-based immune therapy is how to quantitatively track the cellular biodistribution after administration. The biodistribution and target organ uptake determine therapeutic effectiveness and potential toxicity. In our study, we investigated the in vivo biodistribution of the systematically administrated macrophage cells by using GNS as the tracer. After tail vein injection, the macrophage cells were found to accumulate mainly in the liver, spleen, and lung. A previous study investigated macrophage biodistribution after intravenous injection of Bi2Se3 nanosheets and it was reported that liver and spleen are two major organs with macrophage uptake one day after systematical administration, which is consistent with our finding in this study.38 This phenomenon may be due to the filter effect of liver and spleens and the perivascular distribution tendency of myeloid cells after tail vein injection. Interestingly, the high GNS uptake in the lung was transient around 4 h after systemic administration and then decreased to a low level at 120 h. The transient accumulation of macrophage cells in the lung was also reported in a previous study tracking macrophages migration in inflammation mice model.24 On the contrary, the macrophages gradually homed to the bones between 4 h to 120 h. The transient accumulation of macrophage in the lung was also reported in a previous study tracking macrophages migration in inflammation mice model.24 Macrophages migration towards tissues are driven by cytokines and chemokines secreted by extracellular matrix especially for the inflammatory sites.39–41 Bone marrow and the epithelial cells of vessels inside the bones can secret some of these chemotactic molecules and the homing of in vitro generated bone marrow derived macrophages to the bones has been confirmed in animal experiments.42,43 Compared to the previous experiments, our study provided a quantitative approach to show the homing of macrophage to the bones over time. This phenomenon may provide future potential for drug delivery for bone disease treatment.
Several previous studies applied activated macrophage cells or DC for drug delivery to inflammatory sites, and successfully detected the labeled cells migrated to the target sites using various cell-labeling and detecting methods.6,7,13,24,44,45 In other studies, macrophages were used as bio-carriers for nanoparticles in cancer models including lung cancer, glioma, breast cancer, and colon cancer.11,12,46 In our study, only a small number of IV administrated macrophages accumulated in the E.G7 lymphoma sites. The number of labeled cells detected in tumor sites was lower than expected because macrophage cells were reported to migrate freely in circulation and extensively accumulate/infiltrate into tumors.47,48 The homing tendency of macrophages to migrate towards inflammation sites were driven by chemataxis and diapedesis.9,10,49,50 In our study, even though macrophage cells were detectable in lymphomas by both ICP-MS and TPL, the cell density and percentage inside the tumors were minimal. This might be due to the relatively low inflammatory environment in the E.G7 lymphoma tumors used in this study, compared to the inflammatory tumors that are rich in vascularization and inflammatory cytokine secretions. Yet still, we successfully used GNS as a new sensitive tracking method to quantitatively investigate biodistribution of macrophage cells after IV injection and our result showed the relatively low migration ability of macrophage cells to non-inflammatory tumors. Macrophage cells have the advantages of high particle uptake and infiltration capacity, yet the efficiency is still low as the carrier for in vivo delivery to non-inflammatory tumors. Our experiment results indicate the challenge of cell-based therapies for immune diseases and cancers that have limited inflammatory reaction, and the underlying potential risk of off-target side effect in lung, liver, and spleen.
In addition to histopathology examination with TPL imaging and ICP-MS, GNS can also be functionalized with Gd for MRI imaging or 64Cu for PET imaging to perform non-invasive dynamic imaging.51,52 Sensitive and quantitative cell tracking with GNS makes it possible to investigate detailed immune cells’ in vivo distribution after the administration, which is crucial to optimize cell dose, administration schedule aimed to improve the therapeutic effect of cell-based immunotherapy. Therefore, the multifunctional capabilities of GNS nanoprobe with non-toxicity nature make it a promising nanoplatform for future biomedical applications.
Conclusion
In this study, we used TAT-peptide functionalized GNS nanoparticles to label immune cells for quantitative biodistribution and high-resolution imaging studies. Three immune cells were successfully loaded with GNS nanoparticles without negatively affecting their cellular vitality. In vivo studies with macrophage cells were performed with a murine animal model. Liver and spleen were found to have the highest uptake after the systemic administration. Experiment results demonstrated that GNS nanoparticles could be used as a sensitive labeling method for future cell tracking studies.
Acknowledgments
The authors would like to thank Duke University Faculty Exploratory Funds for support to this study.
Disclosure
The authors report no conflicts of interest in this work.
References
1. Seth A, Park HS, Hong KS. Current perspective on in vivo molecular imaging of immune cells. Molecules. 2017;22(6):881. doi:10.3390/molecules22060881
2. Meir R, Motiei M, Popovtzer R. Gold nanoparticles for in vivo cell tracking. Nanomedicine (Lond). 2014;9(13):2059–2069. doi:10.2217/nnm.14.129
3. Arabi F, Torabi-Rahvar M, Shariati A, et al. Antigenic targets of CAR-T cell therapy. A retrospective view on clinical trials. Exp Cell Res. 2018;369(1):1–10. doi:10.1016/j.yexcr.2018.05.009
4. Danhof S, Hudecek M, Smith EL. CARs and other T cell therapies for MM: the clinical experience. Best Pract Res Clin Haematol. 2018;31(2):147–157. doi:10.1016/j.beha.2018.03.002
5. Xue J, Zhao Z, Zhang L, et al. Neutrophil-mediated anticancer drug delivery for suppression of postoperative malignant glioma recurrence. Nat Nanotech. 2017;12(7):692–700. doi:10.1038/nnano.2017.54
6. Choi J, Kim HY, Ju EJ, et al. Use of macrophages to deliver therapeutic and imaging contrast agents to tumors. Biomaterials. 2012;33(16):4195–4203. doi:10.1016/j.biomaterials.2012.02.022
7. Batrakova EV, Gendelman HE, Kabanov AV. Cell-mediated drug delivery. Expert Opin Drug Deliv. 2011;8(4):415–433. doi:10.1517/17425247.2011.559457
8. Su Y, Xie Z, Kim GB, Dong C, Yang J. Design strategies and applications of circulating cell-mediated drug delivery systems. ACS Biomater Sci Eng. 2015;1(4):201–217. doi:10.1021/ab500179h
9. Mazurets AF, Kubyshkin VF, Dziuba MV. The cytochemical characteristics of the blood polymorphonuclear leukocytes in dilated cardiomyopathy and an inflammatory myocardial lesion. Lik Sprava. 1994;9:109–112.
10. Nourshargh S, Alon R. Leukocyte migration into inflamed tissues. Immunity. 2014;41(5):694–707. doi:10.1016/j.immuni.2014.10.008
11. Agrahari V, Agrahari V, Mitra AK. Next generation drug delivery: circulatory cells-mediated nanotherapeutic approaches. Expert Opin Drug Deliv. 2017;14(3):285–289. doi:10.1080/17425247.2017.1254614
12. Choi MR, Stanton-Maxey KJ, Stanley JK, et al. A cellular trojan horse for delivery of therapeutic nanoparticles into tumors. Nano Lett. 2007;7(12):3759–3765. doi:10.1021/nl072209h
13. Kim EJ, Bhuniya S, Lee H, et al. In vivo tracking of phagocytic immune cells using a dual imaging probe with gadolinium-enhanced MRI and near-infrared fluorescence. ACS Appl Mater Interfaces. 2016;8(16):10266–10273. doi:10.1021/acsami.6b03344
14. Gabrilovich DI, Nagaraj S. Myeloid-derived suppressor cells as regulators of the immune system. Nat Rev Immunol. 2009;9(3):162–174. doi:10.1038/nri2506
15. Umansky V, Blattner C, Gebhardt C, Utikal J. The role of myeloid-derived suppressor cells (MDSC) in cancer progression. Vaccines (Basel). 2016;4(4):36. doi:10.3390/vaccines4040036
16. Wynn TA. Myeloid-cell differentiation redefined in cancer. Nat Immunol. 2013;14(3):197–199. doi:10.1038/ni.2539
17. Anselmo AC, Mitragotri S. Cell-mediated delivery of nanoparticles: taking advantage of circulatory cells to target nanoparticles. J Control Release. 2014;190:531–541. doi:10.1016/j.jconrel.2014.03.050
18. Hirschberg H, Madsen SJ. Cell mediated photothermal therapy of brain tumors. J Neuroimmune Pharmacol. 2017;12(1):99–106. doi:10.1007/s11481-016-9690-9
19. Lee HW, Gangadaran P, Kalimuthu S, Ahn B-C. Advances in molecular imaging strategies for in vivo tracking of immune cells. Biomed Res Int. 2016;2016:1946585. doi:10.1155/2016/1946585
20. Liu Z, Li Z. Molecular imaging in tracking tumor-specific cytotoxic T lymphocytes (CTLs). Theranostics. 2014;4(10):990–1001. doi:10.7150/thno.9268
21. Medříková Z, Novohradsky V, Zajac J, et al. Enhancing tumor cell response to chemotherapy through the targeted deliver of platinum drugs mediated by highly stable, multifunctional carboxymethylcellulose-coated magnetic nanoparticles. Chemistry. 2016;22(28):9750–9759. doi:10.1002/chem.201600949
22. Chewning JH, Dugger KJ, Chaudhuri TR, Zinn KR, Weaver CT. Bioluminescence-based visualization of CD4 T cell dynamics using a T lineage-specific luciferase transgenic model. BMC Immunol. 2009;10:44. doi:10.1186/1471-2172-10-44
23. Tavri S, Jha P, Meier R, et al. Optical imaging of cellular immunotherapy against prostate cancer. Mol Imaging. 2009;8(1):15–26.
24. Kang S, Lee HW, Jeon YH, et al. Combined fluorescence and magnetic resonance imaging of primary macrophage migration to sites of acute inflammation using near-infrared fluorescent magnetic nanoparticles. Mol Imaging Biol. 2015;17(5):643–651. doi:10.1007/s11307-015-0830-z
25. Griessinger CM, Kehlbach R, Bukala D, et al. In vivo tracking of Th1 cells by PET reveals quantitative and temporal distribution and specific homing in lymphatic tissue. J Nucl Med. 2014;55(2):301–307. doi:10.2967/jnumed.113.126318
26. Yuan H, Khoury CG, Hwang H, Wilson CM, Grant GA, Vo-Dinh T. Gold nanostars: surfactant-free synthesis, 3D modeling, and two-photon photoluminescence imaging. Nanotechnology. 2012;23(7):075102. doi:10.1088/0957-4484/23/7/075102
27. Gao NY, Chen Y, Li L, et al. Shape-dependent two-photon photoluminescence of single gold nanoparticles. J Phys Chem C. 2012;118(25):13904–13911. doi:10.1021/jp502038v
28. Yuan H, Fales AM, Vo-Dinh T. TAT peptide-functionalized gold nanostars: enhanced intracellular delivery and efficient NIR photothermal therapy using ultralow irradiance. J Am Chem Soc. 2012;134(28):11358–11361. doi:10.1021/ja304180y
29. Liu Y, Ashton JR, Moding EJ, et al. A plasmonic gold nanostar theranostic probe for in vivo tumor imaging and photothermal therapy. Theranostics. 2015;5(9):946–960. doi:10.7150/thno.11974
30. Drujont L, Carretero-Lglesia L, Bouchet-Delbos L, et al. Evaluation of the therapeutic potential of bone marrow-derived myeloid suppressor cell (MDSC) adoptive transfer in mouse models of autoimmunity and allograft rejection. PLoS One. 2014;9(6):e100013. doi:10.1371/journal.pone.0100013
31. Trouplin V, Boucherit N, Gorvel L, et al. Bone marrow-derived macrophage production. J Vis Exp. 2013;22(81):e50966.
32. Weischenfeldt J, Porse B. Bone marrow-derived macrophages (BMM): isolation and applications. CSH Protoc. 2008;2008:5080. doi:10.1101/pdb.prot4939
33. Xu Y, Zhan Y, Lew AM, Naik SH, Kershaw MH. Differential development of murine dendritic cells by GM-CSF versus Flt3 ligand has implications for inflammation and trafficking. J Immunol. 2007;179(11):7577–7584.
34. Youn JI, Nagaraj S, Collazo M, Gabrilovich DI. Subsets of myeloid-derived suppressor cells in tumor-bearing mice. J Immunol. 2008;181(8):5791–5802.
35. Gad SC, Sharp KL, Montgomery C, Payne JD, Goodrich GP. Evaluation of the toxicity of intravenous delivery of auroshell particles (gold-silica nanoshells). Int J Toxicol. 2012;31(6):584–594. doi:10.1177/1091581812465969
36. Dam DHM, Culver KS, Kandela I, et al. Biodistribution and in vivo toxicity of aptamer-loaded gold nanostars. Nanomed. 2015;11(3):671–679. doi:10.1016/j.nano.2014.10.005
37. Betzer O, Meir R, Dreifuss T, et al. In vitro optimization of nanoparticle-cell labeling protocols for in-vivo cell tracking applications. Sci Rep. 2015;5:15400. doi:10.1038/srep15400
38. Li Z, Shao J, Luo Q, et al. Cell-borne 2D nanomaterials for efficient cancer targeting and photothermal therapy. Biomaterials. 2017;133:37–48. doi:10.1016/j.biomaterials.2017.04.012
39. Vogel DY, Heijnen PD, Breur M, et al. Macrophages migrate in an activation-dependent manner to chemokines involved in neuroinflammation. J Neuroinflammation. 2014;11:23. doi:10.1186/s12974-014-0139-x
40. Wang S, Voisin MB, Larbi KY, et al. Venular basement membranes contain specific matrix protein low expression regions that act as exit points for emigrating neutrophils. J Exp Med. 2006;203(6):1519–1532. doi:10.1084/jem.20051210
41. Korpos E, Wu C, Song J, Hallmann R, Sorokin L. Role of the extracellular matrix in lymphocyte migration. Cell Tissue Res. 2010;339(1):47–57. doi:10.1007/s00441-009-0853-3
42. McGonigle TA, Dwyer AR, Greenland EL, et al. Reticulon-1 and reduced migration toward chemoattractants by macrophages differentiated from the bone marrow of ultraviolet-irradiated and ultraviolet-chimeric mice. J Immunol. 2018;200(1):260–270. doi:10.4049/jimmunol.1700760
43. Cui Y, Fu S, Hou T, et al. Endothelial progenitor cells enhance the migration and osteoclastic differentiation of bone marrow-derived macrophages in vitro and in a mouse femure fracture model through Talin-1. Cell Physiol Biochem. 2018;49(2):555–564. doi:10.1159/000492993
44. Selt M, Tennstaedt A, Beyrau A, et al. In vivo non-invasive tracking of macrophage recruitment to experimental stroke. PLoS One. 2016;11(6):e0156626. doi:10.1371/journal.pone.0156626
45. Singh A, Talekar M, Raikar A, Amiji M. Macrophage-targeted delivery systems for nucleic acid therapy of inflammatory diseases. J Control Release. 2014;190:515–530. doi:10.1016/j.jconrel.2014.04.021
46. Xie Z, Su Y, Kim GB, et al. Immune cell-mediated biodegradable theranostic nanoparticles for melanoma targeting and drug delivery. Small. 2017;13(10):1603121. doi:10.1002/smll.201603121
47. Alizadeh D, Zhang L, Hwang J, et al. Tumor-associated macrophages are predominant carriers of cyclodextrin-based nanoparticles into gliomas. Nanomedicine. 2010;6(2):382–390. doi:10.1016/j.nano.2009.10.001
48. Lewis CE, Leek R, Harris A, McGee JO. Cytokine regulation of angiogenesis in breast cancer – the role of tumor-associated macrophages. J leuk Bio. 1995;57(5):747–751. doi:10.1002/jlb.1995.57.issue-5
49. Filippi MD. Mechanism of diapedesis: importance of the transcellular route. Adv Immunol. 2016;129:25–53. doi:10.1016/bs.ai.2015.09.001
50. Gerhardt T, Ley K. Monocyte trafficking across the vessel wall. Cardiovasc Res. 2015;107(3):321–330. doi:10.1093/cvr/cvv147
51. Liu Y, Chang Z, Yuan H, Fales AM, Vo-Dinh T. Quintuple-modality (SERS-MRI-CT-TPL-PTT) plasmonic nanoprobe for theranostics. Nanoscale. 2013;5(24):12126–12131. doi:10.1039/c3nr03762b
52. Liu Y, Yuan H, Kersey FR, Register JK, Parrott MC, Vo-Dinh T. Plasmonic gold nanostars for multi-modality sensing and diagnostics. Sensors. 2015;15(2):3706–3720. doi:10.3390/s150203706
 © 2019 The Author(s). This work is published and licensed by Dove Medical Press Limited. The
full terms of this license are available at https://www.dovepress.com/terms
and incorporate the Creative Commons Attribution
- Non Commercial (unported, 3.0) License.
By accessing the work you hereby accept the Terms. Non-commercial uses of the work are permitted
without any further permission from Dove Medical Press Limited, provided the work is properly
attributed. For permission for commercial use of this work, please see paragraphs 4.2 and 5 of our Terms.
© 2019 The Author(s). This work is published and licensed by Dove Medical Press Limited. The
full terms of this license are available at https://www.dovepress.com/terms
and incorporate the Creative Commons Attribution
- Non Commercial (unported, 3.0) License.
By accessing the work you hereby accept the Terms. Non-commercial uses of the work are permitted
without any further permission from Dove Medical Press Limited, provided the work is properly
attributed. For permission for commercial use of this work, please see paragraphs 4.2 and 5 of our Terms.