")
Back to Journals » Clinical and Experimental Gastroenterology » Volume 10
Bile salt receptor TGR5 is highly expressed in esophageal adenocarcinoma and precancerous lesions with significantly worse overall survival and gender differences
Authors Pang CH, LaLonde A, Godfrey TE, Que J, Sun J, Wu TT, Zhou ZR
Received 21 July 2016
Accepted for publication 3 October 2016
Published 7 February 2017 Volume 2017:10 Pages 29—37
DOI https://doi.org/10.2147/CEG.S117842
Checked for plagiarism Yes
Review by Single anonymous peer review
Peer reviewer comments 2
Editor who approved publication: Professor Andreas M. Kaiser
Chunhong Pang,1,2 Amy LaLonde,3 Tony E Godfrey,4 Jianwen Que,5,6 Jun Sun,7 Tong Tong Wu,3 Zhongren Zhou2
1Department of Pathology, China-Japan Friendship Hospital, 2Department of Pathology and Laboratory Medicine, 3Department of Biostatistics and Computational Biology, University of Rochester, Rochester, NY, 4Department of Surgery, Boston University Medical Center, Boston, MA, 5Center for Human Development, 6Division of Digestive and Liver Diseases, Columbia University, New York, NY, 7Division of Gastroenterology and Hepatology, University of Illinois College of Medicine, Chicago, IL, USA
Abstract: Bile acid reflux in the esophagus plays an important role in the carcinogenesis of esophageal adenocarcinoma (EAC). The G-protein coupled bile acid receptor (TGR5) has been associated with the development of gastrointestinal cancer. However, little is known regarding the role of TGR5 in esophageal carcinoma and precancerous lesions. We analyzed genomic DNA from 116 EACs for copy number aberrations via Affymetrix SNP6.0 microarrays. The TGR5 gene locus was amplified in 12.7% (14/116) of the EACs. The TGR5 protein expression was also assessed using immunohistochemistry from tissue microarrays, including Barrett’s esophagus (BE), low- (LGD) and high-grade dysplasia (HGD), columnar cell metaplasia (CM), squamous epithelium (SE), EAC and squamous cell carcinoma. The TGR5 protein was highly expressed in 71% of EAC (75/106), 100% of HGD (11/11), 72% of LGD (13/18), 66% of BE (23/35), 84% of CM (52/62), and 36% of SE (30/83). The patients with high expression of TGR5 exhibited significantly worse overall survival compared to the patients with nonhigh expression. TGR5 high expression was significantly increased in the males compared to the females in all cases with an odds ratio of 1.9 times. The vitamin D receptor (VDR) was significantly correlated with TGR5 expression. Our findings indicated that TGR5 may play an important role in the development and prognosis of EAC through a bile acid ligand. Gender differences in TGR5 and VDR expression may explain why males have a higher incidence of EAC compared to females.
Keywords: esophageal adenocarcinoma, Barrett’s esophagus, TGR5, bile acid receptor, amplification
Introduction
The incidence of adenocarcinoma of the distal esophagus and gastroesophageal junction has substantially increased in Western populations in the previous decades.1 In the absence of major improvements in treatment during these years, the number of deaths has also rapidly increased. Studies have suggested that esophageal adenocarcinoma (EAC) develops sequentially from gastroesophageal reflux (GERD), Barrett’s esophagus (BE), low-grade dysplasia (LGD), and high-grade dysplasia (HGD) to EAC. The progression from BE to EAC is attributed to a series of genetic and epigenetic events.2 Bile acid, acid reflux, and inflammation from GERD play important roles in the carcinogenesis of adenocarcinoma.3,4
The G-protein coupled bile acid receptor Gpbar1 (TGR5) is a bile acid receptor and a member of the G-protein-coupled receptor (GPCR) family with seven transmembrane domains.5 It has been described as a cell membrane GPCR and membrane-bile acid receptor6 or TGR5.7 TGR5 gene expression is widely distributed in the endocrine glands, adipocytes, muscles, immune organs, spinal cord, and the enteric nervous system.5 It is important in bile acid-regulated lipid metabolism, energy homeostasis, and glucose metabolism.8–10 TGR5 has recently been reported to have potential links between bile acids (BAs) and cancers.5,8,11,12 TGR5 has been implicated in the activation of carcinogenic pathways in gastric carcinoma cell lines.13 TGR5 was also highly expressed in gastric intestinal-type adenocarcinomas and has been associated with decreased patient survival in gastric adenocarcinomas.8 In colorectal adenocarcinoma and pancreatic ductal adenocarcinoma, TGR5 was also involved in colorectal cancer or pancreatic ductal adenocarcinoma tumorigenesis by blocking the activation of epidermal growth factor receptor (EGFR), a mitogen-activated protein kinase.14 In the liver, TGR5 has been demonstrated to be overexpressed in human cholangiocarcinomas and may promote tumor development.15 Controversially, another report demonstrated that TGR5 was a suppressor of human liver carcinogenesis.16
The involvement of BAs in the progression from BE to adenocarcinoma is well established.17–20 However, few studies have investigated the implication of bile acid receptors in the development of BE disease and adenocarcinoma.11,21,22–24 One in vitro study has indicated an association between TGR5 and the progression of esophageal carcinoma.11 The authors demonstrated that bile acid induced TGR5 expression in EAC FLO cells and the BE BAR-T cell line. However, the distribution of TGR5 in EAC and precancerous lesions has not been investigated. In addition, the associations between TGR5 expression and patient prognosis and clinicopathologic features are unknown.
The vitamin D receptor (VDR) is a nuclear receptor that controls the most known role of 1,25 (OH)2D3, the hormonal form of vitamin D; it is also a bile acid receptor. Increasing evidence indicates that the VDR plays an essential role in innate immunity, inflammation, and cancer.21–23 VDR polymorphisms are reported to influence the development of various types of cancers, such as breast, liver, prostate, brain, and colon.24,26 In our recent study, VDR protein was highly expressed in EAC and precancerous lesions.27 However, the relationship between the VDR and TGR5 expression in EAC and precancerous lesions is not clear.
Our study aimed to investigate TGR5 amplification and expression, including 1) TGR5 amplification via high resolution DNA microarray; 2) the distribution of TGR5 expression in EAC, LGD and HGD, BE, columnar cell metaplasia (CM), and squamous epithelium (SE), 3) the relationships between TGR5 high expression and clinicopathologic characteristics, including gender, age, differentiation, and tumor stage in EAC; and 4) the relationship between TGR5 expression and the VDR in EAC and precancerous lesions.
Materials and methods
Construction of tissue microarray
Tissue microarrays, which included 35 cases of BE, 62 cases of columnar CM, 83 cases of SE, 18 cases of LGD, 11 cases of HGD, and 106 cases of EAC, were constructed from the representative areas of formalin-fixed specimens collected between 1997 and 2005 at the Department of Pathology and Laboratory Medicine, University of Rochester Medical Center/Strong Memorial Hospital, Rochester, New York. Five-micron sections were cut from the tissue microarrays and were stained with H&E to confirm the presence of the expected tissue histology within each tissue core. Additional sections were cut for immunohistochemistry. In some cases, tissue cores in the tissue microarrays were dislodged from the slides during processing and were excluded from the study.
Patients for tissue microarrays
All 106 patients with EAC who provided samples for the tissue microarray construction were treated with esophagectomy at Strong Memorial Hospital/University of Rochester between 1997 and 2005. These patients included 96 males (90%) and 10 females (10%). The patient ages ranged from 34 to 85 years with a mean of 65 years. The follow-up period following esophagectomy ranged from 0.3 to 142 months with a mean of 39 months.
Patients for Affymetrix SNP 6.0 analysis
Tumors were obtained from 116 patients who had undergone esophagectomy at the University of Pittsburgh Medical Center, Pittsburgh, PA, USA, between 2002 and 2008 with a median follow-up of 26.8 months. The patient ages ranged from 43 to 88 years, and the cohort consisted of 95 males and 21 females. The final pathologic stages comprised stage I (28), stage II (31), stage III (49), and stage IV (7). All tumor specimens were evaluated by a pathologist and were determined to be >70% tumor cell representation. The patients who received neoadjuvant therapy (1) and suffered perioperative deaths (3) were not included in the survival analyses. All the tissues from patients were consented for tissue banking and research.
Affymetrix SNP 6.0 analysis
Genomic DNA was isolated using the QiaAmp DNA mini kit (Qiagen, Valencia, CA, USA); 600 ng was used for labeling and array hybridization at the SUNY Upstate Medical University microarray core facility (Syracuse, NY, USA) using kits and protocols provided by Affymetrix (Santa Clara, CA, USA). The array data quality was assessed using Affymetrix Genotyping Console 3.0, and all further data analyses were performed using Nexus 5.0 Copy Number Analysis software (Biodiscovery, Inc., El Segundo, CA, USA). The microarray data for this cohort have been submitted to the Gene Expression Omnibus (GSE36460) and are publically available at http://www.ncbi.nlm.nih.gov/geo/query/acc.cgi?acc=GSE36460.
Immunohistochemistry
Immunohistochemistry was conducted according to previously described methods with modifications.28,29 Tissue sections from the tissue microarray were deparaffinized, rehydrated through graded alcohols, and washed with phosphate buffered saline. Antigen retrieval for TGR5 and VDR was performed by heating sections in 10 mM citrate (pH 6.0) boiling buffer for 15 minutes. The tissues were permeabilized with 0.3% triton-X for 1 hour at room temperature. After the endogenous peroxidase activity was quenched and the nonspecific binding was blocked, the sections were incubated with mouse monoclonal anti-TGR5 and anti-VDR (Santa Cruz, CA, USA) at 4°C overnight. Biotinylated secondary antibody (Jackson Immuno Research Laboratories, Inc.) was incubated for 1 hour. After washing, the sections were incubated with avidin–biotin–peroxidase complex (Vector Laboratories) for 1 hour at room temperature. For color-reaction development, the slides were immersed in Vector NovaRed substrate (Vector Laboratories) for 2 minutes and counterstained with Flex Hematoxylin for 2 minutes. A negative control was performed by replacing anti-TGR5 and anti-VDR antibodies with normal serum.
Immunohistochemistry scoring
All sections were independently reviewed by Z.Z. and C.P., who were blinded to all clinical and pathologic information. Discordant cases were reviewed by both Z.Z. and C.P., and a final consensus was reached. For the TGR5 immunohistochemical stain, the percentage (0%–100%) of positive cells was determined. The intensity of TGR5 staining was graded as 0, 1+, 2+, or 3+ (Figure 1 A–D); 0 was defined as no stain or weak stain in <10% of the cells; 1 was defined as a weak stain in ≥10% of the tumor cells; 2 was defined as a moderate stain in ≥10% of the cells; and 3 was defined as a strong stain in ≥10% of the cells. TGR5 high expression was defined as an intensity of 2 or 3 in ≥10% of the cells.
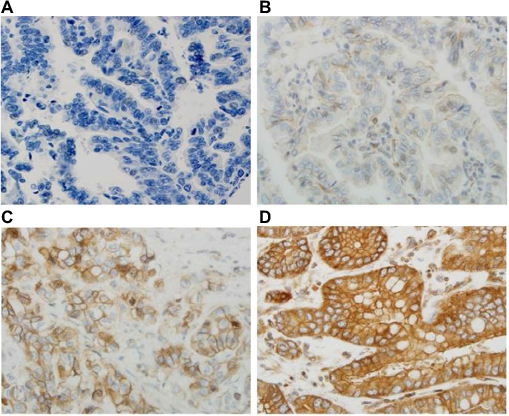 | Figure 1 Immunohistochemical score of TGR5 in EAC. Notes: TGR5 expression is located in the cell membrane and cytoplasm. (A) No TGR5 expression in EAC glands (score 0); (B) TGR5 weakly positive cells evenly distributed in EAC glands (score 1+); (C) TGR5 moderately positive cells evenly distributed in EAC glands (score 2+); and (D) TGR5 strongly positive cells evenly distributed in the membrane and cytoplasm of EAC glands (score 3+). Magnification 400x. Abbreviations: EAC, esophageal adenocarcinoma; TGR5, the G-protein coupled bile acid receptor. |
Statistical analysis
Summary data are expressed as the means (standard deviation). All statistical tests are two-sided unless otherwise noted. P-values of <0.05 are considered statistically significant. A Kaplan–Meier survival estimator with a log-rank test was used to compare the patient survival rates between the TGR5 high-expression/amplification group and the TGR5 nonhigh expression/nonamplification group. To assess the associations between the clinicopathologic characteristics and TGR5 expression, Students t-tests, Pearson’s chi-square tests, and Fisher’s exact tests were utilized as appropriate. A univariate logistic model with the diagnostic group as the sole explanatory variable of TGR5 high-expression is fit, and contrast tests are used to compare the TGR5 positivity rates between the diagnostic groups: adenocarcinoma, high and LGD, BE, columnar CM and SE. Statistical analyses were performed using SAS version 9.3 (SAS Institute, Inc., Cary, NC, USA).
Ethics statement
This project was granted by Research Subjects Review Board at the University of Rochester with approval number RSRB40320 and granted by the Institutional Review Board at University of Pittsburgh with approval number UPCI#98-122. The tissue was collected by Dr Zhou at the University of Rochester and the tissue from the University of Pittsburgh Tissue Banking was collected by Drs Arjun Pennathur and James D Luketich at the University of Pittsburgh for EAC tissues. All patients consented for tissue banking and research.
Results
High expression of TGR5 in EAC and precancerous lesions
TGR5 was highly expressed in 71% (75/106) of EAC, 100% (11/11) of HGD, 72% (13/18) of LGD, 66% (23/35) of BE, 84% (52/62) of CM, and 36% (30/83) of SE (Figure 2A–E and Table 1). Statistically, the rate of TGR5 high expression was significantly increased in EAC, LGD, BE, and CM compared to SE (p<0.05; Table 2). TGR5 in SE exhibited a moderate high expression (score 2+) in most cases (Figure 2A). In addition, the rate of TGR5 high expression in CM was increased compared to BE. However, if the small number of cases were considered with a Bonferroni correction, significant differences was only identified between EAC versus SE (p<0.0001) and CM versus SE (p<0.0001).
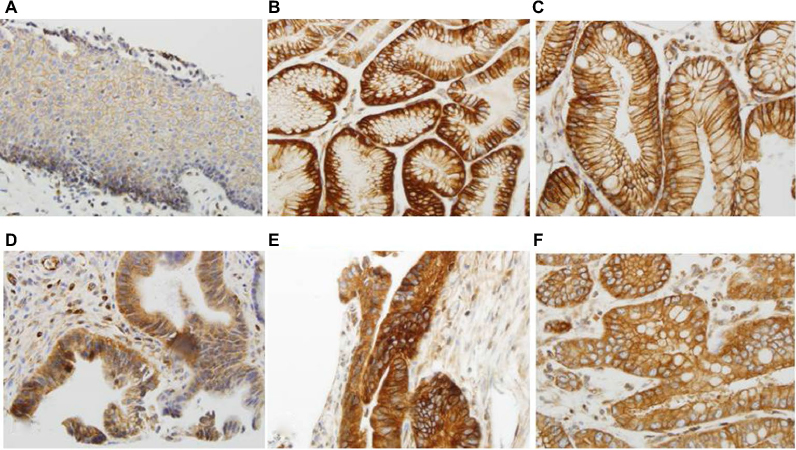 | Figure 2 High expression of TGR5 in various histologic subtypes assessed via immunohistochemical studies. Notes: (A) TGR5 positive cells (score 2+ in most cells) predominately distributed in the basal layer of normal esophageal squamous epithelium; (B) TGR5 strongly positive cells evenly distributed in the glands of columnar cell metaplasia; (C) TGR5 strongly positive cells evenly distributed in the glands of Barrett’s esophagus; (D) TGR5 strongly positive cells evenly distributed in low-grade dysplasia glands; (E) TGR5 strongly positive cells evenly distributed in high-grade dysplasia glands; (F) TGR5 strongly positive cells evenly distributed in EAC glands. Magnification (A) 200x and (B–F) 400x. Abbreviations: EAC, esophageal adenocarcinoma; TGR5, the G-protein coupled bile acid receptor. |
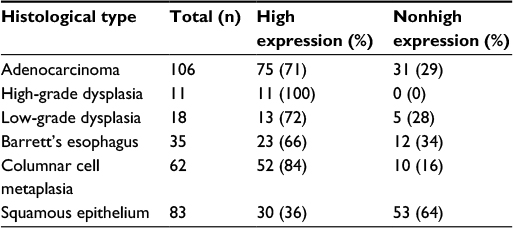 | Table 1 Rates of TGR5 high expression in EAC and precancerous lesions Abbreviations: EAC, esophageal adenocarcinoma; TGR5, the G-protein coupled bile acid receptor. |
 | Table 2 Comparison of TGR5 high-expression rates between various esophageal lesions Notes: *Significant difference without using the Bonferroni correction; **significant difference using the Bonferroni correction with α=0.05/15=0.0033. Abbreviation: TGR5, the G-protein coupled bile acid receptor. |
Survival rate in EAC cases
A Kaplan–Meier analysis was used to calculate the survival curves of the TGR5 high and nonhigh expression groups. A log-rank test was used to compare the effect of TGR5 expression on the survival rates of the patients with EAC. The median survival time in the TGR5 high-expression group, determined by immunostain, was 19 months with a mean survival time of 38 months (censoring rate=19%). The TGR5 nonhigh expression group had a median survival time of 32 months with a mean survival time of 46 months (censoring rate=35%). The log-rank test indicated that the survival time for the TGR5 high-expression group was statistically shorter compared to the TGR5 nonhigh expression group (p=0.0432, Figure 3). Note that the mean survival times of the TGR5 high-expression groups were underestimated because of censoring within the data and missing data.
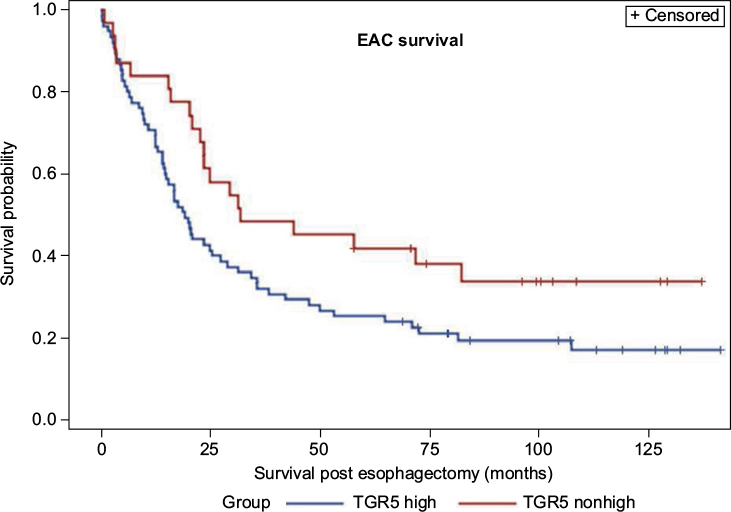 | Figure 3 Association between TGR5 high expression and overall survival of esophageal adenocarcinoma patients. Notes: TGR5 high-expression patients (mean survival: 36 months) exhibited a worse prognosis compared to patients with TGR5 low or no expression (mean survival: 48 months) (p=0.432). Abbreviations: EAC, esophageal adenocarcinoma; TGR5, the G-protein coupled bile acid receptor. |
Association of high TGR5 expression with clinicopathologic characteristics of EAC
The TGR5 high expression and the clinicopathologic features in EAC were analyzed. In contrast to the significant association between the survival time and TGR5 high expression previously described (p=0.0432), none of the other clinicopathologic characteristics, including age, gender, TNM staging, or differentiation, were significantly associated with TGR5 high expression (Table 3).
 | Table 3 Examination of the relationship between TGR5 high expression and clinicopathologic characteristics in esophageal adenocarcinoma Abbreviations: SD, standard deviation; GEJ, gastroesophageal junction; TGR5, the G-protein coupled bile acid receptor. |
Association between high TGR5 expression and high VDR expression
We further compared the expression level of TGR5 with VDR data from our recently published study.27 The correlation between TGR5 high expression and VDR high expression was analyzed across all cases and within each diagnostic group. There was a significantly positive correlation between VDR and TGR5 high expression across all groups (p=0.0001) using a Pearson correlation coefficient test (Table 4).
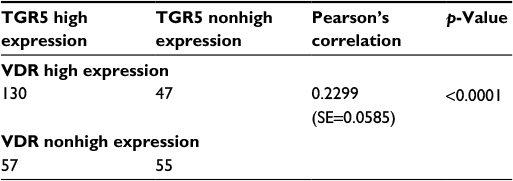 | Table 4 Overall association between high TGR5 expression and high VDR expression in esophageal adenocarcinoma and precancerous lesions Abbreviations: SE, standard error; TGR5, the G-protein coupled bile acid receptor; VDR, vitamin D receptor. |
Association between TGR5 high expression and gender
Males have a high incidence of EAC.1 We analyzed the association of TGR5 high expression and gender in all groups including EAC and precancerous lesions. We identified a significant overall association between TGR5 high expression and gender (p=0.0464). The odds of TGR5 high expression were 1.9 times higher in the males (67%) compared to the females (51%). However, there was no significant association between TGR5 high expression and precancerous lesions in EAC group only (Table 3).
Defining the TGR5 amplicon in EAC with high density microarrays
Using high density copy number microarrays, we analyzed 116 EAC specimens and identified TRG 5 amplification in 12.7% (14/116) of the cases. TGR5 lies in a 1.7 Mb minimal amplicon at 2q35, which contains 85 genes (Figure 4A). In this cohort, no significant association was identified between TGR5 amplification and overall survival (p=0.33) (Figure 4B) or disease-free survival (p=0.45).
 | Figure 4 TGR5 amplification and overall survival. Notes: (A) Frequency histogram indicates amplification of the TGR5 locus at chromosome 2q35 in 116 esophageal adenocarcinoma samples, using high density copy number DNA microarrays. This locus is amplified in 14/116 (12.7%) cases in this patient cohort. (B) There is no significant association between TGR5 amplification and overall survival (p=0.33). Abbreviation: TGR5, the G-protein coupled bile acid receptor. |
Discussion
In our study, for the first time, we used immunohistochemistry to demonstrate the expression of the TGR5 protein in EAC and precancerous lesions. We demonstrated that TGR5 expression was significantly increased in glandular lesions compared to SE. The patients with TGR5 high expression exhibited significantly worse overall survival compared to the patients with nonhigh expression. TGR5 expression was significantly increased in males compared to females in all cases with an odds ratio of 1.9 times.
The TGR5 receptor is the first known GPCR specific for BAs. Maruyam et al6 cloned the TGR5 receptor in human embryonic kidney HEK 293 cells and characterized the variations in the binding affinities of individual BAs to TGR5. These findings were confirmed by studies in Chinese Hamster ovarian cells by Kawamata et al.7 Recently, Hong et al demonstrated that the TGR5 messenger RNA (mRNA) and protein were expressed in an EAC cell line and BE cell line as well as human esophageal tissues.11 TGR5 mRNA and protein levels are significantly higher in EAC tissues than in normal esophageal mucosa or BE.11 Our immunohistochemical findings further confirmed that TGR5 was highly expressed in EAC and precancerous lesions based on tissue microarrays. However, the distribution of TGR5 high expression in our study is different from that in previous study. We found that it is not significantly different from CM, BE, LGD, HGD, and EAC. In gastric adenocarcinoma, TGR5 overexpression was found in 52% of the intestinal subtype and 25% of the diffuse subtype of gastric adenocarcinoma.8 TGR5 was also expressed in normal mucosa (39.8%) and intestinal metaplasia (46.3%). Our findings indicated that the rate of TGR5 high expression was substantially increased in EAC (71%) compared to gastric adenocarcinoma. A similar increased expression of TGR5 was identified in precancerous lesions, such as columnar CM (84%) and BE (66%).
BAs play an important role in the carcinogenesis of EAC.3,4,17,30 Multiple bile acid receptors, such as farnesoid X receptor (FXR), VDR, and TGR5, have been detected in EAC and precancerous lesions.31–34 Gottardi et al demonstrated that the FXR protein was only expressed in nuclei in EAC and BE.31 We demonstrated that VDR expression was significantly increased in 95% of BE and 100% of LGD compared to 79% of EAC.27 In the current study, we reported that TGR5 exhibited high expression in CM, BE, LGD, and HGD and lower expression in EAC. The distribution pattern of TGR5 expression is significantly associated with VDR in EAC and precancerous lesions. This finding implies that bile acid may be involved in the early stage of carcinogenesis through both VDR and TGR5 receptors. However, Hong et al found that TGR5 mRNA and protein levels were significantly higher in EAC tissues than in normal esophageal mucosa or BE,11 but TGR5 expression is not significantly different from intestinal metaplasia and gastric adenocarcinoma reported in the same group.8 The effect of TGR5 needs to be further studied in different cancers.
The mechanism of TGR5 on carcinogenesis actually remains controversial. In the liver, TGR5 activation substantially inhibited the proliferation and migration of human liver cancer cells. TGR5 activation antagonizes the signal transducer and activator of transcription 3 (STAT3) pathway by suppressing STAT3 phosphorylation, which suggests that TGR5 is a novel liver tumor suppressor.16 In the stomach, activation of TGR5 antagonizes gastric cancer proliferation and migration in part by inhibiting STAT3 signaling35 and inhibits the gastric inflammation in part by antagonizing NK-kappaB signaling.36 In the stomach and esophagus, Cao et al demonstrated that BAs significantly increased cell proliferation, including NOX5-S expression, H2O2 production, and thymidine incorporation, in EAC, BE cell lines, and gastric adenocarcinoma.8,11 Knockdown of TGR5 substantially inhibited the bile acid-induced increase in the cell proliferation effect. The overexpression of TGR5 significantly enhanced the bile acid effects in EAC cell lines through the Gqα protein and in gastric adenocarcinoma through both Gqα protein and Gαi-3.8,11 In addition, unconjugated BAs induce cAMP response element-binding protein and AP-1-dependent COX-2 expression in BE and EAC through respiratory oxygen species (ROS)-mediated activation of phosphoinositide 3-kinase/AKT and extracellular signal-regulated kinases (ERK)1/237 and deoxycholate acid (DCA) also induce caudal-related homeobox transcription factor 2 (CDX2) upregulation through inhibiting the Notch signaling pathway and transactivation of EGFR.19,30 Using AGS human gastric adenocarcinoma cells, DCA-induced EGFR-ERK1/2 activation was blocked by siRNA silencing of TGR5.13 In colorectal cancer and pancreatic ductal adenocarcinoma cell lines, RNA interference-mediated silencing of TGR5 inhibited DCA-induced EGFR, mitogen-activated protein kinase (MARK), and STAT3 signaling, blunted cyclin D1 expression and cell-cycle progression,14 which support that TGR5 may play an important role in gastrointestinal carcinogenesis. In the current study, we demonstrated the high expression of TGR5 in the EAC and precancerous lesions and the association of TGR5 with decreased survival, which further supports that the TGR5 high expression may be related to carcinogenesis and worse prognosis of EAC.
In gastric adenocarcinoma, moderate and strong expression of TGR5 was identified in both intestinal and diffuse gastric adenocarcinoma, which was associated with a worse prognosis.8 In our study, the high expression of TGR5 is associated with a worse prognosis in EAC (median survival: 38 vs 46 months, respectively). However, the amplification of the TGR5 gene in EAC was not associated with overall survival or disease-free survival. We found that the percentage of the TGR5 DNA amplification (12%) in EAC is significantly lower compared to TGR5 high expression (71%). It implies that TGR5 high expression does not directly depend on the amplification of TGR5 DNA. The detailed mechanism requires further investigation. The amplification of the VDR gene in EAC detected by high resolution DNA microarray demonstrated the association with a worse prognosis; however, the high expression of VDR protein did not exhibit the association. These findings imply that the effect of bile acid is not only associated with the early carcinogenesis of EAC but also the prognosis of EAC through various receptors. However, we did not find that TGR5 high expression was associated with clinicopathologic features such as the differentiation or staging, which is similar to the previous study in gastric adenocarcinoma. There was no statistically significant difference in tumor stage, chemotherapy, and radiation therapy between negative to weak and moderate to strong TGR5 staining gastric adenocarcinoma.8 The mechanism of the association of TGR5 with the worse prognosis is complicated and unclear. In EAC, the bile acid taurodeoxycholic acid-induced increase in cell proliferation may depend on activation of the TGR5 receptor through Gqα protein and NOX5-S.11 In addition, activation of TGR5 by bile acid also is related with DCA-induced EGFR, MARK, and STAT3 signaling and cell-cycle progression in gastric, colorectal, and pancreatic ductal adenocarcinoma.13,14 These signal pathways through activation of TGR5 may play a role in worse prognosis. Further studies with animal models and clinical trials for TGR5 agonists and antagonists may help to understand the mechanism of TGR5 association of worse prognosis.
The major risks of EAC are associated with age, Caucasian, obesity, and male patients. The ratio of males to females is approximately 7 to 1.1 Based on our data, TGR5 exhibited a significantly different gender distribution between males and females (67% vs 51%, respectively). The expression of VDR also exhibited a significantly different distribution between males and females (82% vs 50%, respectively, in EAC and 92% vs 57%, respectively, in columnar CM). The distribution of bile acid receptors was significantly increased in male patients with EAC and precancerous lesions. These findings may explain, in part, why males have a higher incidence of EAC compared to females. The underlying mechanism of bile acid receptors and gender differences requires further investigation.
In conclusion, we report that the high expression of TGR5 is associated with worse survival in EAC. Gender differences in TGR5 and VDR expression may explain, in part, why males have a high incidence of EAC compared to females. Our findings indicate that bile acid receptors may play an important role in the early development and prognosis of EAC.
Acknowledgments
This project is supported by a private donation from Mr Matt Bell. This research also was supported by R01 grant (R01-DK100342, PI-J. Que) and NYSTEM (C029555, PI-J. Que).
We would like to thank Dr Jorge Yao for construction of the tissue microarray, Qi Yang and Loralee A. McMahon at the University of Rochester for immunohistochemistry, and Drs Arjun Pennathur and James D Luketich at the University of Pittsburgh for EAC tissues.
Disclosure
The authors report no conflicts of interest in this work.
References
Corley DA, Kubo A, Levin TR, et al. Race, ethnicity, sex and temporal differences in Barrett’s oesophagus diagnosis: a large community-based study, 1994–2006. Gut. 2009;58(2):182–188. | ||
Chen X, Yang CS. Esophageal adenocarcinoma: a review and perspectives on the mechanism of carcinogenesis and chemoprevention. Carcinogenesis. 2001;22(8):1119–1129. | ||
Fang Y, Chen X, Bajpai M, et al. Cellular origins and molecular mechanisms of Barrett’s esophagus and esophageal adenocarcinoma. Ann N Y Acad Sci. 2013;1300:187–199. | ||
Quante M, Bhagat G, Abrams JA, et al. Bile acid and inflammation activate gastric cardia stem cells in a mouse model of Barrett-like metaplasia. Cancer Cell. 2012;21(1):36–51. | ||
Duboc H, Tache Y, Hofmann AF. The bile acid TGR5 membrane receptor: from basic research to clinical application. Dig Liver Dis. 2014;46(4):302–312. | ||
Maruyama T, Miyamoto Y, Nakamura T, et al. Identification of membrane-type receptor for bile acids (M-BAR). Biochem Biophys Res Commun. 2002;298(5):714–719. | ||
Kawamata Y, Fujii R, Hosoya M, et al. A G protein-coupled receptor responsive to bile acids. J Biol Chem. 2003;278(11):9435–9440. | ||
Cao W, Tian W, Hong J, et al. Expression of bile acid receptor TGR5 in gastric adenocarcinoma. Am J Physiol Gastrointest Liver Physiol. 2013;304(4):G322–G327. | ||
Houten SM, Watanabe M, Auwerx J. Endocrine functions of bile acids. EMBO J. 2006;25(7):1419–1425. | ||
Katsuma S, Hirasawa A, Tsujimoto G. Bile acids promote glucagon-like peptide-1 secretion through TGR5 in a murine enteroendocrine cell line STC-1. Biochem Biophys Res Commun. 2005;329(1):386–390. | ||
Hong J, Behar J, Wands J, et al. Role of a novel bile acid receptor TGR5 in the development of oesophageal adenocarcinoma. Gut. 2010;59(2):170–180. | ||
Pean N, Doignon I, Tordjmann T. Bile acids and liver carcinogenesis: TGR5 as a novel piece in the puzzle? Clin Res Hepatol Gastroenterol. 2013;37(3):226–229. | ||
Yasuda H, Hirata S, Inoue K, Mashima H, Ohnishi H, Yoshiba M. Involvement of membrane-type bile acid receptor M-BAR/TGR5 in bile acid-induced activation of epidermal growth factor receptor and mitogen-activated protein kinases in gastric carcinoma cells. Biochem Biophys Rese Commun. 2007;354(1):154–159. | ||
Nagathihalli NS, Beesetty Y, Lee W, Washington MK, Chen X, Lockhart AC, Merchant NB. Novel mechanistic insights into ectodomain shedding of EGFR ligands amphiregulin and TGF-alpha: impact on gastrointestinal cancers driven by secondary bile acids. Cancer Res. 2014;74(7):2062–2072. | ||
Keitel V, Haussinger D. TGR5 in cholangiocytes. Curr Opin Gastroenterol. 2013;29(3):299–304. | ||
Chen WD, Yu D, Forman BM, Huang W, Wang YD. Deficiency of G-protein-coupled bile acid receptor Gpbar1 (TGR5) enhances chemically induced liver carcinogenesis. Hepatology. 2013;57(2):656–666. | ||
Matsuzaki J, Suzuki H, Tsugawa H, et al. Bile acids increase levels of microRNAs 221 and 222, leading to degradation of CDX2 during esophageal carcinogenesis. Gastroenterology. 2013;145(6):1300–1311. | ||
Tamagawa Y, Ishimura N, Uno G, et al. Notch signaling pathway and Cdx2 expression in the development of Barrett’s esophagus. Lab Invest. 2012;92(6):896–909. | ||
Morrow DJ, Avissar NE, Toia L, et al. Pathogenesis of Barrett’s esophagus: bile acids inhibit the Notch signaling pathway with induction of CDX2 gene expression in human esophageal cells. Surgery. 2009;146(4):714–721; discussion 721–712. | ||
Hu Y, Jones C, Gellersen O, Williams VA, Watson TJ, Peters JH. Pathogenesis of Barrett esophagus: deoxycholic acid up-regulates goblet-specific gene MUC2 in concert with CDX2 in human esophageal cells. Arch Surg. 2007;142(6):540–544; discussion 544–545. | ||
Campbell FC, Xu H, El-Tanani M, Crowe P, Bingham V. The yin and yang of vitamin D receptor (VDR) signaling in neoplastic progression: operational networks and tissue-specific growth control. Biochem Pharmacol. 2010;79(1):1–9. | ||
Lu R, Wu S, Xia Y, Sun J. The vitamin D receptor, inflammatory bowel diseases, and colon cancer. Curr Colorectal Cancer Rep. 2012;8(1):57–65. | ||
Sun J, Mustafi R, Cerda S, Chumsangsri A, Xia YR, Li YC, Bissonnette M. Lithocholic acid down-regulation of NF-kappaB activity through vitamin D receptor in colonic cancer cells. J Steroid Biochem Mol Biol. 2008;111(1–2):37–40. | ||
Raimondi S, Johansson H, Maisonneuve P, Gandini S. Review and meta-analysis on vitamin D receptor polymorphisms and cancer risk. Carcinogenesis. 2009;30(7):1170–1180. | ||
Bouillon R, Carmeliet G, Verlinden L, et al. Vitamin D and human health: lessons from vitamin D receptor null mice. Endocr Rev. 2008;29(6):726–776. | ||
Mishra DK, Wu Y, Sarkissyan M, et al. Vitamin D receptor gene polymorphisms and prognosis of breast cancer among African-American and Hispanic women. PLoS One. 2013;8(3):e57967. | ||
Zhou Z, Xia Y, Bandla S, et al. Vitamin D receptor is highly expressed in precancerous lesions and esophageal adenocarcinoma with significant sex difference. Hum Pathol. 2014;45(8):1744–1751. | ||
Hu Y, Bandla S, Godfrey TE, et al. HER2 amplification, overexpression and score criteria in esophageal adenocarcinoma. Mod Pathol. 2011;24(7):899–907. | ||
Zhou Z, Bandla S, Ye J, et al. Cyclin E involved in early stage carcinogenesis of esophageal adenocarcinoma by SNP DNA microarray and immunohistochemical studies. BMC Gastroenterol. 2014;14:78. | ||
Avissar NE, Toia L, Hu Y, et al. Bile acid alone, or in combination with acid, induces CDX2 expression through activation of the epidermal growth factor receptor (EGFR). J Gastrointest Surg. 2009;13(2):212–222. | ||
De Gottardi A, Dumonceau JM, Bruttin F, et al. Expression of the bile acid receptor FXR in Barrett’s esophagus and enhancement of apoptosis by guggulsterone in vitro. Mol Cancer. 2006;5:48. | ||
Trowbridge R, Mittal SK, Sharma P, Hunter WJ, Agrawal DK. Vitamin D receptor expression in the mucosal tissue at the gastroesophageal junction. Exp Mol Pathol. 2012;93(2):246–249. | ||
Trowbridge R, Sharma P, Hunter WJ, Agrawal DK. Vitamin D receptor expression and neoadjuvant therapy in esophageal adenocarcinoma. Exp Mol Pathol. 2012;93(1):147–153. | ||
Chang CK, Mulholland HG, Cantwell MM, et al. Vitamin d receptor gene variants and esophageal adenocarcinoma risk: a population-based case-control study. J Gastrointest Cancer. 2012;43(3):512–517. | ||
Guo C, Su J, Li Z, et al. The G-protein-coupled bile acid receptor Gpbar1 (TGR5) suppresses gastric cancer cell proliferation and migration through antagonizing STAT3 signaling pathway. Oncotarget. 27 2015;6(33):34402–34413. | ||
Guo C, Qi H, Yu Y, et al. The G-Protein-Coupled Bile Acid Receptor Gpbar1 (TGR5) inhibits gastric inflammation through antagonizing NF-kappaB signaling pathway. Front Pharmacol. 2015;6:287. | ||
Song S, Guha S, Liu K, Buttar NS, Bresalier RS. COX-2 induction by unconjugated bile acids involves reactive oxygen species-mediated signalling pathways in Barrett’s oesophagus and oesophageal adenocarcinoma. Gut. 2007;56(11):1512–1521. |
 © 2017 The Author(s). This work is published and licensed by Dove Medical Press Limited. The full terms of this license are available at https://www.dovepress.com/terms.php and incorporate the Creative Commons Attribution - Non Commercial (unported, v3.0) License.
By accessing the work you hereby accept the Terms. Non-commercial uses of the work are permitted without any further permission from Dove Medical Press Limited, provided the work is properly attributed. For permission for commercial use of this work, please see paragraphs 4.2 and 5 of our Terms.
© 2017 The Author(s). This work is published and licensed by Dove Medical Press Limited. The full terms of this license are available at https://www.dovepress.com/terms.php and incorporate the Creative Commons Attribution - Non Commercial (unported, v3.0) License.
By accessing the work you hereby accept the Terms. Non-commercial uses of the work are permitted without any further permission from Dove Medical Press Limited, provided the work is properly attributed. For permission for commercial use of this work, please see paragraphs 4.2 and 5 of our Terms.