Back to Journals » Nature and Science of Sleep » Volume 11
Bilateral Theta Transcranial Alternating Current Stimulation (tACS) Modulates EEG Activity: When tACS Works Awake It Also Works Asleep
Authors D'Atri A ![]() , Scarpelli S
, Scarpelli S ![]() , Gorgoni M
, Gorgoni M ![]() , Alfonsi V
, Alfonsi V ![]() , Annarumma L
, Annarumma L ![]() , Giannini AM, Ferrara M
, Giannini AM, Ferrara M ![]() , Ferlazzo F, Rossini PM, De Gennaro L
, Ferlazzo F, Rossini PM, De Gennaro L ![]()
Received 5 September 2019
Accepted for publication 21 October 2019
Published 19 November 2019 Volume 2019:11 Pages 343—356
DOI https://doi.org/10.2147/NSS.S229925
Checked for plagiarism Yes
Review by Single anonymous peer review
Peer reviewer comments 2
Editor who approved publication: Dr Sutapa Mukherjee
Aurora D’Atri,1,2 Serena Scarpelli,1 Maurizio Gorgoni,1 Valentina Alfonsi,1 Ludovica Annarumma,1 Anna Maria Giannini,1 Michele Ferrara,3 Fabio Ferlazzo,1 Paolo Maria Rossini,4,5 Luigi De Gennaro1,2
1Department of Psychology, University of Rome “Sapienza”, Rome, Italy; 2Area of Neuroscience, IRCCS San Raffaele Pisana, Rome, Italy; 3Department of Biotechnological and Applied Clinical Sciences, University of L’Aquila, L’Aquila, Italy; 4Institute of Neurology, Catholic University of the Sacred Heart, Rome, Italy; 5Department Geriatrics, Neuroscience & Orthopaedics, Policlinic A. Gemelli Foundation-IRCCS, Rome, Italy
Correspondence: Luigi De Gennaro
Department of Psychology, University of Rome “Sapienza”, Via Dei Marsi, 78, Rome 00185, Italy,
Tel +39 06-49917647
Fax +39 06-49917711
Email [email protected]
Purpose: Recent studies demonstrate that 5-Hz bilateral transcranial alternating current stimulation (θ-tACS) on fronto-temporal areas affects resting EEG enhancing cortical synchronization, but it does not affect subjective sleepiness. This dissociation raises questions on the resemblance of this effect to the physiological falling asleep process. The current study aimed to evaluate the ability of fronto-temporal θ-tACS to promote sleep.
Subjects and methods: Twenty subjects (10 F/10 M; mean age: 24.60 ± 2.9 y) participated in a single-blind study consisting of two within-subject sessions (active/sham), one week apart in counterbalanced order. Stimulation effects on EEG were assessed during wake and post-stimulation nap. The final sample included participants who fell asleep in both sessions (n=17).
Results: Group analyses on the whole sample reported no θ-tACS effects on subjective sleepiness and sleep measures, while a different scenario came to light by analysing data of responders to the stimulation (ie, subjects actually showing the expected increase of theta activity in the wake EEG after the θ-tACS, n=7). Responders reported a significant increase in subjective sleepiness during wakefulness after the active stimulation as compared to the sham. Moreover, the sleep after the θ-tACS compared to sham in this sub-group showed: (1) greater slow-wave activity (SWA); (2) SWA time-course revealing increases much larger as closer to the sleep onset; (3) stimulation-induced changes in SWA during sleep topographically associated to those in theta activity during wake.
Conclusion: Subjects who show the expected changes during wake after the stimulation also had a consistent pattern of changes during sleep. The enhancement of cortical synchronization by θ-tACS during wakefulness actually corresponds to increased sleep pressure, but it occurs only in some individuals. Thus, θ-tACS can enhance sleep, although individual factors to be further investigated affect the actual responsiveness to this treatment.
Keywords: transcranial alternating current stimulation, sleep, EEG, slow-wave activity, sleep onset
Introduction
Studies using repetitive transcranial magnetic stimulation (rTMS) and oscillatory transcranial direct current stimulation (o-tDCS) indicated the possibility of non-invasively influencing brain activity in relation to sleep and arousal, via frequency-specific modulations of neuronal firing.1
Low-frequency stimulations (<1 Hz) during sleep by rTMS2 or o-tDCS3 are associated with enhancements of sleep-specific EEG rhythms or phasic events of NREM sleep,2,3 suggesting the possibility to affect sleep propensity. In other words, the modulation of the cortical components of the sleep control system by transcranial stimulation could trigger or facilitate (or inhibit) the sleep onset process.1,4 In this respect, it has been demonstrated that theta-burst stimulation (TBS) with TMS triggered delta waves in wakefulness, when supplied as an intermittent pattern (iTBS) of gamma-bursts (50 Hz) at the theta (5 Hz) frequency.5 This method, when applied in a continuous mode (cTBS), produced a significant decrease of stage-2 latency (ie, a more rapid sleep onset process), and a significant improvement of sleep efficiency.6 Along the same vein, Frase and colleagues7 found that a bi-frontal anodal tDCS during pre-sleep wakefulness enhanced high-frequency EEG activity, resulting in a reduction of total sleep time. Consistently, 0.75 Hz o-tDCS in wakefulness locally increased slow oscillations and more widely the theta EEG activity.8 In all these studies, however, self-reported sleepiness was not affected,6–9 suggesting that neurophysiological changes of sleep-like slow-frequency EEG activity do not necessarily affect subjective sleepiness ratings. In contrast, we found that a frontal anodal o-tDCS at 5 Hz significantly enhanced sleepiness and correlated with stimulation-induced variations of slow-wave activity (SWA) in a narrow scalp/brain region encircling the stimulated site.10
In one recent study, however, we used bilateral transcranial alternating current stimulation at 5 Hz (θ-tACS) on fronto-temporal areas.11 This stimulation induced significant increases, compared to the sham condition, of (A) the theta activity in temporo-parieto-occipital areas and (B) the alpha activity in centro-frontal areas. No effect on sleepiness was however significant. Therefore, θ-tACS modulated the theta and alpha EEG activity with a topography consistent with high sleep pressure, without affecting subjectively perceived sleepiness.
This dissociation between objective and subjective measures of sleep propensity raises a fundamental question regarding the nature of induced effects. In our opinion, there are two possible interpretations: (1) the modulation of resting EEG frequency is a form of temporary entrainment of specific rhythms, which does not directly affect sleep pressure; (2) these EEG changes are associated to a manipulation of sleep pressure, which is not necessarily paralleled by changes of subjective sleepiness.
With the aim of evaluating these two hypotheses, we replicated the θ-tACS protocol on fronto-temporal areas and directly assessed its ability to modulate the sleep pressure by asking the participants to have a nap at the end of the stimulation period (the protocol of the experiment is illustrated in Figure 1). Therefore, the primary goal and dependent measures were not the resting EEG rhythms, but the macro- (ie, sleep latency and amount of NREM sleep) and microstructural measures of sleep architecture (ie, EEG topography of NREM sleep). If the modulation of wake EEG activity in the direction of slower EEG frequency actually reflects an increase of sleep pressure, we would observe shorter sleep latency, longer time spent in slow-wave sleep, and an increased amount of SWA.
 |
 |  |  |  |  |  |
Materials And Methods
Participants
Twenty healthy subjects (10 males and 10 females; mean age 24.6 ± 2.9 years) participated in the study after providing written informed consent. All participants were medication-free. The exclusion criteria, assessed by a clinical interview, were: presence or history of neurological or psychiatric disorder, epilepsy, sleep disorders and the presence of intracranial metal implants. As a further criterion, subjects were selected on the basis of their habit to have a diurnal nap. Due to the failure of three subjects to fall asleep, the final sample consisted of 17 subjects (9 males and 8 females; mean age 24.3 ± 3.1 years).
The study was approved by the Institutional Ethics Committee of the IRCCS San Raffaele Pisana and of the Department of Psychology of the University of Rome Sapienza and was conducted in accordance with the Declaration of Helsinki.
Experimental Design
Since our aim was an exact replication of our previous θ-tACS protocol,11 all the aspects of the design were identical. Participants had to keep constant their wake-sleep cycle (7 hrs sleep per night). Their compliance has been controlled by a daily sleep log that they were asked to fulfil during the week preceding the experimental sessions. Intense physical training and the intake of any kind of stimulant or neuroactive drugs, including coffee, tea, and chocolate, were not allowed in the morning of the experimental sessions.
The protocol involved two experimental sessions at 1-week distance: a real stimulation condition (θ-tACS) and a sham condition. Subjects were blinded to the type of stimulation (ie, a single-blind protocol) and the order of the conditions was balanced across subjects.
The timeline of the experimental session is reported in Figure 1 and it is consistent for both the stimulation conditions (see, Figure 1). The arrival at the laboratory was scheduled at 12:00 hrs. The lunch took place at 12:30 hrs and then we proceeded with the montage of EEG and stimulation electrodes. The experimental session started at 14:00 hrs with the assessment of the self-reported measure of sleepiness. The EEG signals were acquired in an electrically shielded, soundproof, and a temperature-controlled room with constant dim light.
Five minutes of a resting eyes-closed EEG was recorded as a baseline. The stimulation (θ-tACS or sham) was then applied for 10 mins. During the stimulation, participants had to keep their eyes closed. Post-stimulation EEG (5 mins) was recorded as close to the end of the stimulation as possible, followed by the post-stimulation sleepiness measurement. Then, the stimulation electrodes were removed, and the subjects were asked to have a nap. Subjects had a maximum of 1 hr to fall asleep. Subjects were allowed to sleep for a maximum of 2 hrs, starting from the sleep onset, but they could get out of bed earlier if they woke up and felt could no longer sleep. The sleep onset was identified by a sleep scoring expert, who continuously monitored the EEG recordings, and it was defined by the first appearance of a K-complex or a sleep spindle lasting more than 0.5 s, as the most reliable boundary between wakefulness and sleep.12
Self-Reported Sleepiness
Subjective sleepiness was evaluated by the Karolinska Sleepiness Scale13 before the starting of the baseline EEG at rest and following the post-stimulation wake EEG recording at each experimental session. KSS measures sleepiness on a rating scale with nine points, from 1 (“Very alert”) up to 9 (“Very sleepy, fighting sleep”), and participants had to rate their sleepiness level considering how they felt during the previous 5 mins. Data from the two experimental sessions have been compared by repeated-measures ANOVA Time (Baseline vs Post-Stimulation) × Condition (θ-tACS vs Sham).
EEG Recordings
An elastic cap (Easycap, Falk Minow, Munich) with sintered Ag–AgCl electrodes mounted at Fz, Cz, Pz, Oz, F3, F4, F7, F8, Fc1, Fc2, Fc5, Fc6, Fp1, Fp2, C3, C4, Cp1, Cp2, Cp5, Cp6, P3, P4, P7, P8, O1, O2, T7 and T8 locations of the international 10–10 system were adopted for the EEG recordings. The ground electrode was placed at Fpz and the cortical EEG signals were referenced online to the averaged mastoids (A1 and A2). The electro-oculograms (EOGs) and the submental electromyograms (EMG) were also recorded for the offline artifacts detection and sleep scoring. Electrodes resistance was kept below 5 kΩ. BrainAmp MR plus system (Brain Products GmbH, Gilching) and Brain Vision Recorder (Version 1.10, Brain Products GmbH, Gilching) software were used to amplify and record the signals. The sampling rate was 250 Hz (0.1 μV steps resolution). A high-pass filter with a time constant of 1 s, a 70 Hz low pass filter, and a notch filter at 50 Hz (± 5 Hz) were applied on raw EEG data (phase shift-free Butterworth filters). EEG data were digitally stored on the hard disk for further offline analyses.
Electrical Stimulation
In the two stimulation conditions, the current was applied via two conductive-rubber circular electrodes with a diameter of 1.2 cm. The electrodes were placed in sponges saturated with high conductivity gel. The current was generated by a battery-operated stimulator system (BrainSTIM, EMS medical). The current was delivered on right and left fronto-temporal areas, by placing the two stimulation electrodes between F7 and T7, and between F8 and T8 of 10–10 system, respectively (see, Figure 1). In θ-tACS condition, participants underwent to 10 min with a sinusoidal alternating current with 5-Hz frequency (maximum current intensity: 0.6 mA) with 10 s ramp in/out. An identical stimulation setting was adopted in the sham condition, but the stimulator was turned off after 10 s (ie, to induce the same short-lasting tingling sensation that subjects usually refer at the beginning of the stimulation procedure). None of the participants reported phosphenes sensations or adverse effects of the stimulations, but a weak and short-lasting sensation of tingling in the skin under the stimulation electrodes. A post-experiment debriefing verified that participants had noticed no differences among the active and sham condition. The two stimulation electrodes were removed before the start of the nap.
Sleep Measures
According to the criteria proposed by Rechtschaffen and Kales,14 sleep stages were visually scored offline in 20-s epochs by an expert, strictly following the >75 μV amplitude criterion for slow-wave sleep (SWS) scoring.
The macrostructural features considered as dependent variables in the subsequent analyses were: (a) sleep latency (defined by the first appearance of a K-complex or a sleep spindle lasting more than 0.5 s); (b) REM latency, time elapsed from the sleep onset until the occurrence of the first epoch of REM sleep; (c) SWS latency, time elapsed from the sleep onset until the occurrence of the first epoch of stage 3 or stage 4 sleep; (d) total sleep time (TST), ie, the sum of stage 1, stage 2, SWS and REM durations; (e) total bedtime (TBT), time elapsed from the light-off until the final awakening; (f) percentage of sleep stages (time spent in a sleep stage/TST); (g) wakefulness after sleep onset (WASO), ie, the intra-sleep time (min) spent awake. The polysomnographic measures were submitted to t-tests for dependent samples, which compared Active vs Sham conditions. The Bonferroni corrections were applied to correct for multiple comparisons.
EEG Analysis
EEG signals were offline high-pass filtered with the time constant of 0.3 s and lowpass filtered at 30 Hz. Also, quantitative EEG analyses of sleep recordings replicated that used in the previous wake study11 with the only difference of segmentation of the beta activity in two frequency ranges [ie, sigma (12–15 Hz) and beta (16–24 Hz)].
Twenty-seconds epochs with ocular and/or muscle artifacts in the EEG recordings were excluded from the subsequent analyses. Power spectra for the 28 scalp locations were computed by a Fast Fourier Transform (FFT) routine (frequency range: 0.5–29.75 Hz; 0.25-Hz bin resolution) for the artifact-free 20-s epochs only (periodogram: 4 s) and then averaged across epochs.
Only epochs of NREM sleep (epochs of stages 2/3/4) within the first sleep cycle were considered for the analyses, due to the fact that the naps of 10 out 17 subjects did not reach REM stage in both the two experimental sessions.
Adjacent 0.25-Hz bins (0.50–25 Hz) were averaged to obtain the powers for the canonical EEG frequency bands: slow-wave activity (SWA, 0.50–4.75 Hz), theta (5.00–7.75 Hz), alpha (8.00–11.75 Hz), sigma (12.00–15.75 Hz), and beta (16.00–24.75 Hz). The EEG power values for each frequency band were log-transformed and considered as dependent measures for the statistical analyses.
EEG power spectra of naps in the Active and Sham conditions were compared by paired t-tests, separately for each frequency band and scalp location.
To correct for multiple comparisons, the Bonferroni correction was applied. Since its standard version is too conservative in the case of correlated outcome variables, the alpha level was adjusted by following the D/AP procedure, as discussed by Sankoh et al15 to take into account the mean correlation between the dependent variables.15–17 Considering the mean correlation between the variables (r=0.7228) and the number of comparisons (frequency bands × scalp derivations: 5×28 = 140), the alpha level was then adjusted to ≤0.013 for the analyses on the whole sample.
Results
Stimulation Effect On The Self-Reported Measure Of Sleepiness And Resting EEG
Results from the repeated measure ANOVA on the sleepiness level as assessed by KSS confirmed what have been found by.11 The analysis showed a robust main effect of Time (F=19.72, p=0.00045) in the direction of increased sleepiness after than before stimulation, no main effect of the Condition (F=0.35, p=0.5632) and an interaction between the two factors that was only close to, but did not reach, the statistical significance (F=3.267, p=0.0895). Also, the effects of the stimulation on the waking EEG power comparing Active and Sham conditions by paired t-tests on the post–pre-stimulation differences substantially replicated the effects of our previous study11 but with lesser extent. Compared to Sham, the Active condition showed higher theta power on the left parieto-temporal region (Cp5, P7) and higher alpha power on one central site (C4) after tACS (uncorrected p ≤ 0.05).
Macro-Structural And Topographical Changes During Sleep
Polysomnographic measures of the naps following the active and sham stimulation do not show any significant difference (Table 1). Above all, there is no difference with respect to sleep latency and the amount of SWS, which should be considered as indexes of sleep pressure.
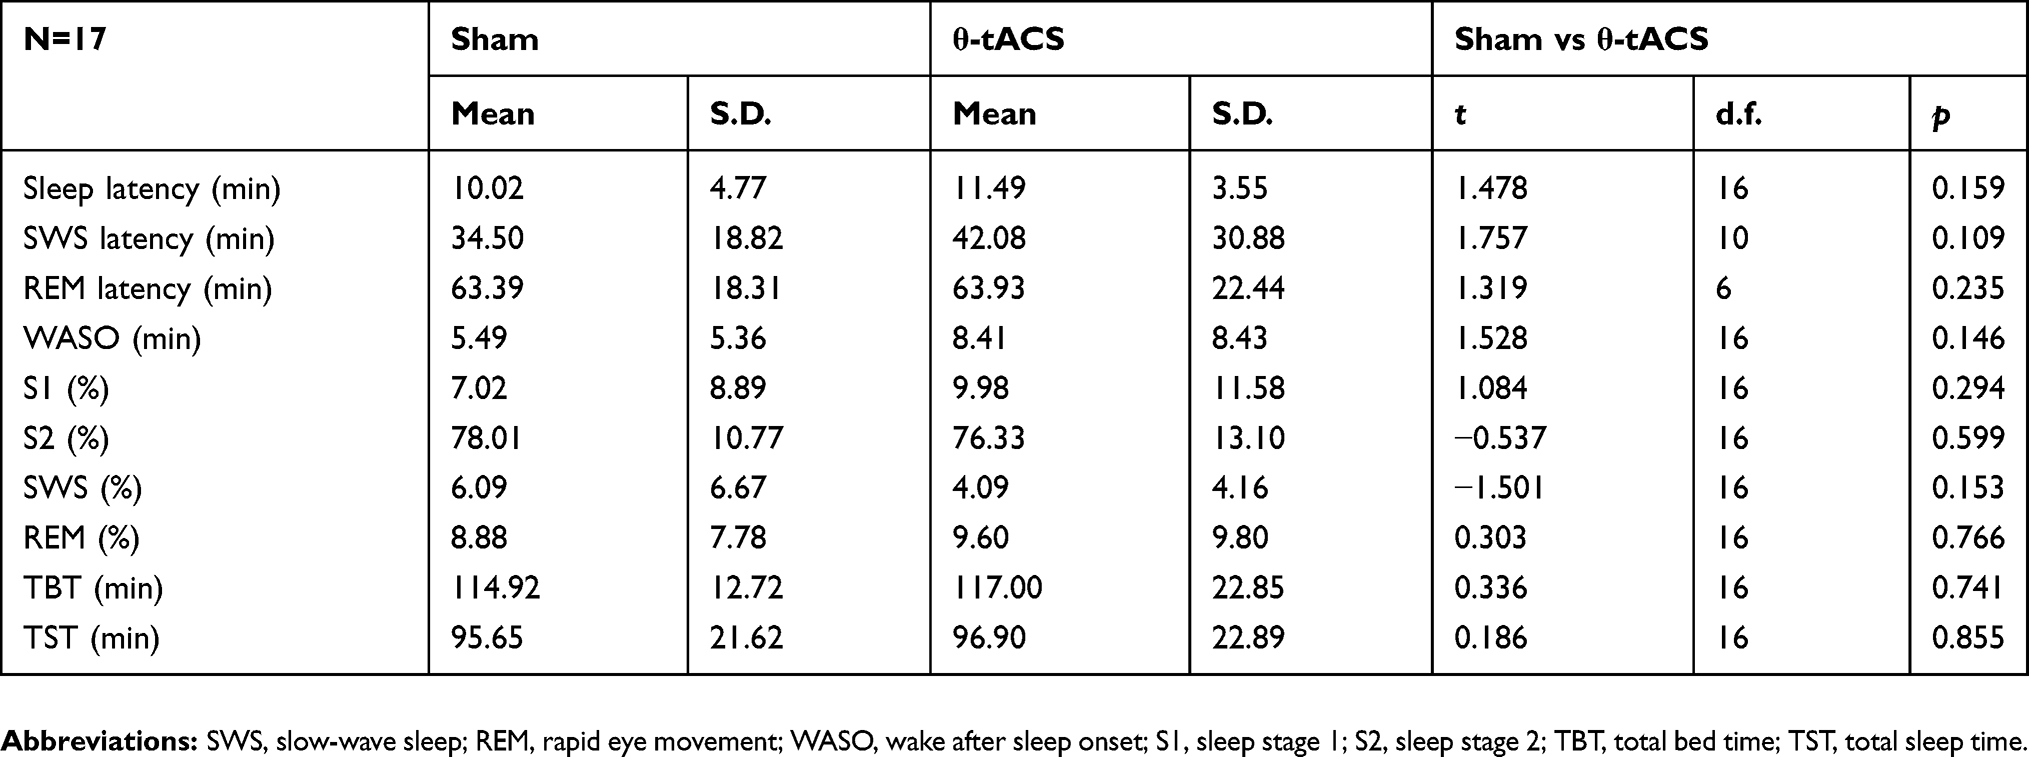 |
Table 1 Means And Standard Deviations (S.D.) Of Polysomnographic Variables In The Two Experimental Conditions |
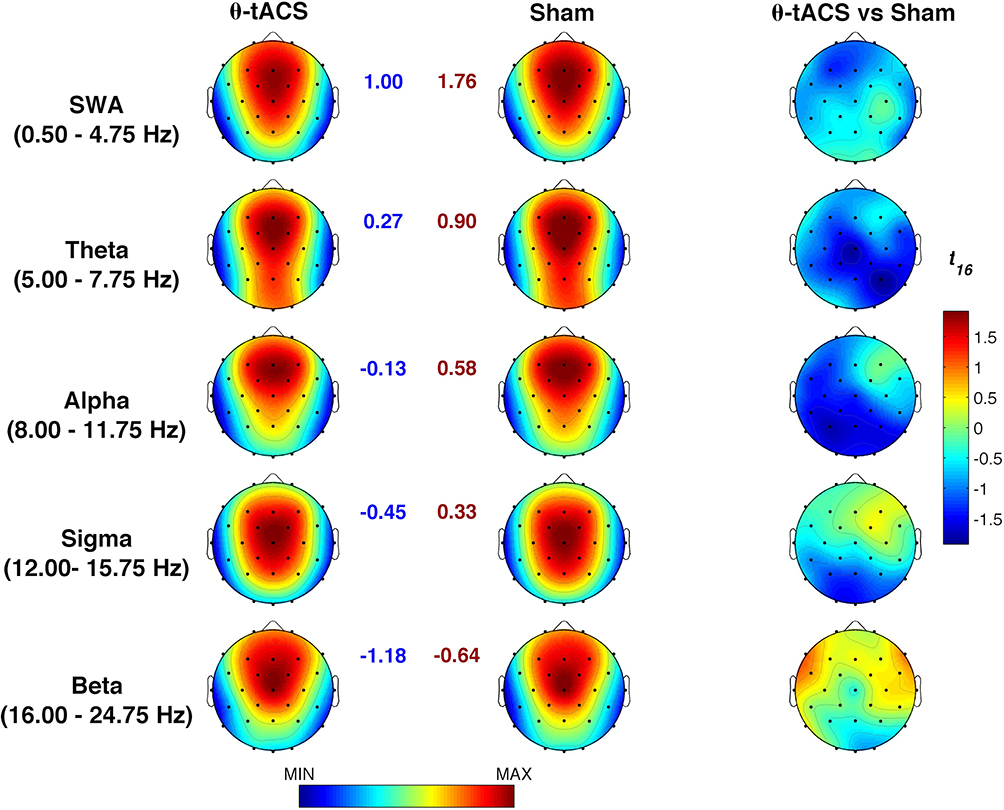
Similarly, EEG activity during the NREM period of the first sleep cycle does not point to any significant difference for any frequency band and scalp location (Figure 2). Regardless of the Bonferroni corrections, the p-values of these comparisons were always higher than 0.07.
 |
Figure 2 Effects of θ-tACS on sleep EEG activity. Topographic maps of the mean EEG power spectra (log-transformed) during the first NREM sleep cycle of the naps following the Active (θ-tACS, first column) and Sham (second column) stimulation and statistical maps of comparisons assessed by paired t-tests (θ-tACS vs sham, third column). Maps are plotted for the following frequency bands: slow-wave activity (SWA, 0.50–4.75 Hz), theta (5.00–7.75 Hz), alpha (8.00–11.75 Hz), sigma (12.00–15.75 Hz), and beta (16.00–24.75 Hz). Values are colour coded and plotted at the corresponding position on the planar projection of the scalp surface and are interpolated (biharmonic spline) between electrodes. The topographic maps (first and second columns) are scaled between minimal and maximal values of the spectral power considering the two experimental conditions within each frequency band. The minimum (blue number) and the maximum (red number) for each scale are also reported close to the corresponding maps. The statistical maps are scaled symmetrically according to the absolute maximal t-value across the statistical comparisons in all frequency bands. |
Time Course Of EEG Frequency Bands
If the modulation of wake EEG activity by tACS actually affects subsequent sleep by increasing sleep pressure, it is expected that this effect would have a larger influence on the build-up of SWA and, more in general, on EEG activity of the intervals of NREM sleep closer to the sleep onset. In other words, the effect of the tACS stimulation on the time course of EEG activity during the subsequent NREM sleep would be largest at the sleep onset and then progressively dissipate within the course of the first sleep cycle. Due to the variability in the duration of the NREM sleep during the first sleep cycle, we made the individual time courses comparable by aligning them as a function of the first spindle or K-complex, then dividing them into 20 segments.18,19 Also, in this case, no difference between Active vs Sham conditions was significant after the Bonferroni correction for multiple comparisons for any frequency band, scalp location, or time interval (Figure 3). Besides representing an indicator of the quality of measurements, such an extensive and systematic lack of differences, supports the presence of within-individual stability in human sleep also during daytime naps,20 taking into consideration that the recordings were performed 1 week apart.
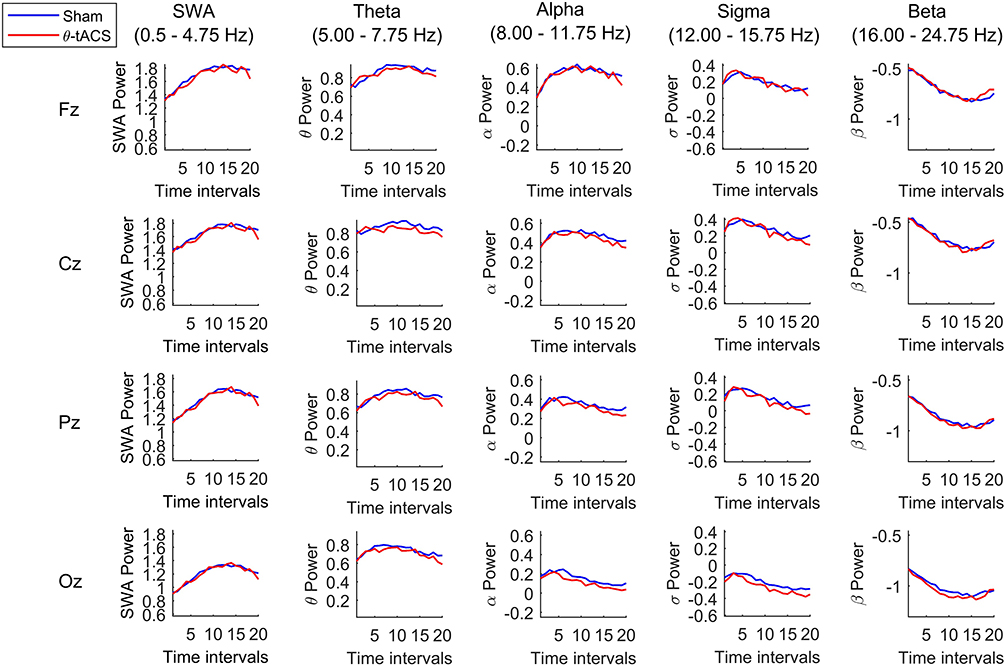 |
Figure 3 Time-course of EEG activity during the first NREM sleep cycle after sham and θ-tACS. The time-course of the spectral power in each frequency band during the first NREM sleep cycle of the naps following the Active (red line) and the Sham (blue line) for Fz, Cz, Pz, Oz representative cortical sites. The values were obtained by dividing the individual time period from the sleep onset to the first REM sleep (or the final awakening in absence of REM sleep) into 20 equal intervals and calculating the spectral power at each scalp location for each interval. Data were calculated for each subject, then averaged across subjects and the log-transformed values were plotted at the corresponding position on the planar projection of the scalp surface. |
Sleep Differences In Responders
Due to the lack of any difference between the two experimental conditions in macrostructural and topographical measures of sleep, we evaluated whether the stimulation had influenced the subsequent sleep in those subjects who had an actual modulation of resting-EEG activity as a consequence of our stimulation (responders).
According to the role of theta activity as an EEG measure of sleepiness21,22 and to the findings of our previous study,11 we selected as responders to θ-tACS those subjects who exhibited an average increase of 5–7 Hz activity when comparing Active vs Sham conditions. To this aim, the mean percentage of increase was computed as the ratio of the theta EEG changes (post/pre-stimulation) averaged across all derivations between the two experimental conditions [(Active/Sham) x 100]. According to this procedure, we identified seven responders (3 females) among the participants (order of active-sham conditions assignment: 3 subjects for active – sham sequence, 4 for sham – active sequence). In order to control for differences at the baseline that could have affected the responsiveness to stimulation in the two groups/conditions, we compared subjective sleepiness and cortical EEG activity by means of mixed-design ANOVAs, Group (Responders vs Non-responders) × Condition (θ-tACS vs Sham) on the KSS scores and resting EEG power at the baseline. No significant differences in subjective sleepiness (FGroup= 0.215, p= 0.65; FCondition= 0.075, p= 0.79; Finteraction= 0.32, p= 0.58) or EEG data [max FGroup= 8.18, p= 0.012; max FCondition= 4.09, p= 0.06; max Finteraction= 5.62, p= 0.58; critic-p ≤ 0.005 after the Bonferroni correction with a mean intercorrelations between the dependent variables r= 0.55 and the number of comparisons (28 scalp locations × 5 frequency bands = 140)] have been found, pointing to similar baseline values of the two groups and conditions. The seven subjects, who had such increase of the theta activity (mean increase in percentage=51.77%, S.D.=59.04%), also reported a consistent significant increase in self-reported sleepiness after θ-tACS compared to sham condition, independently supporting our selection criterion. Indeed, in this sub-group, the repeated-measures ANOVA Time (Baseline vs Post-Stimulation) × Condition (θ-tACS vs Sham) on KSS scores showed a significant interaction (F=8.00, p=0.030), with θ-tACS increasing sleepiness significantly more than Sham stimulation (t-test Δθ-tACS vs ΔSham: t=2.83, p=0.03).
Table 2 reports the macrostructural sleep variables for responders and non-responders, and the results of the comparisons by mixed-design ANOVAs, Group (Responders vs Non-responders) × Condition (θ-tACS vs Sham). The statistical comparisons do not reveal significant effects of the stimulation, group or interactions on these variables.
 |
Table 2 Means And Standard Deviations (S.D.) Of Polysomnographic Variables In The Two Experimental Conditions For Responders And Non-Responders Groups |
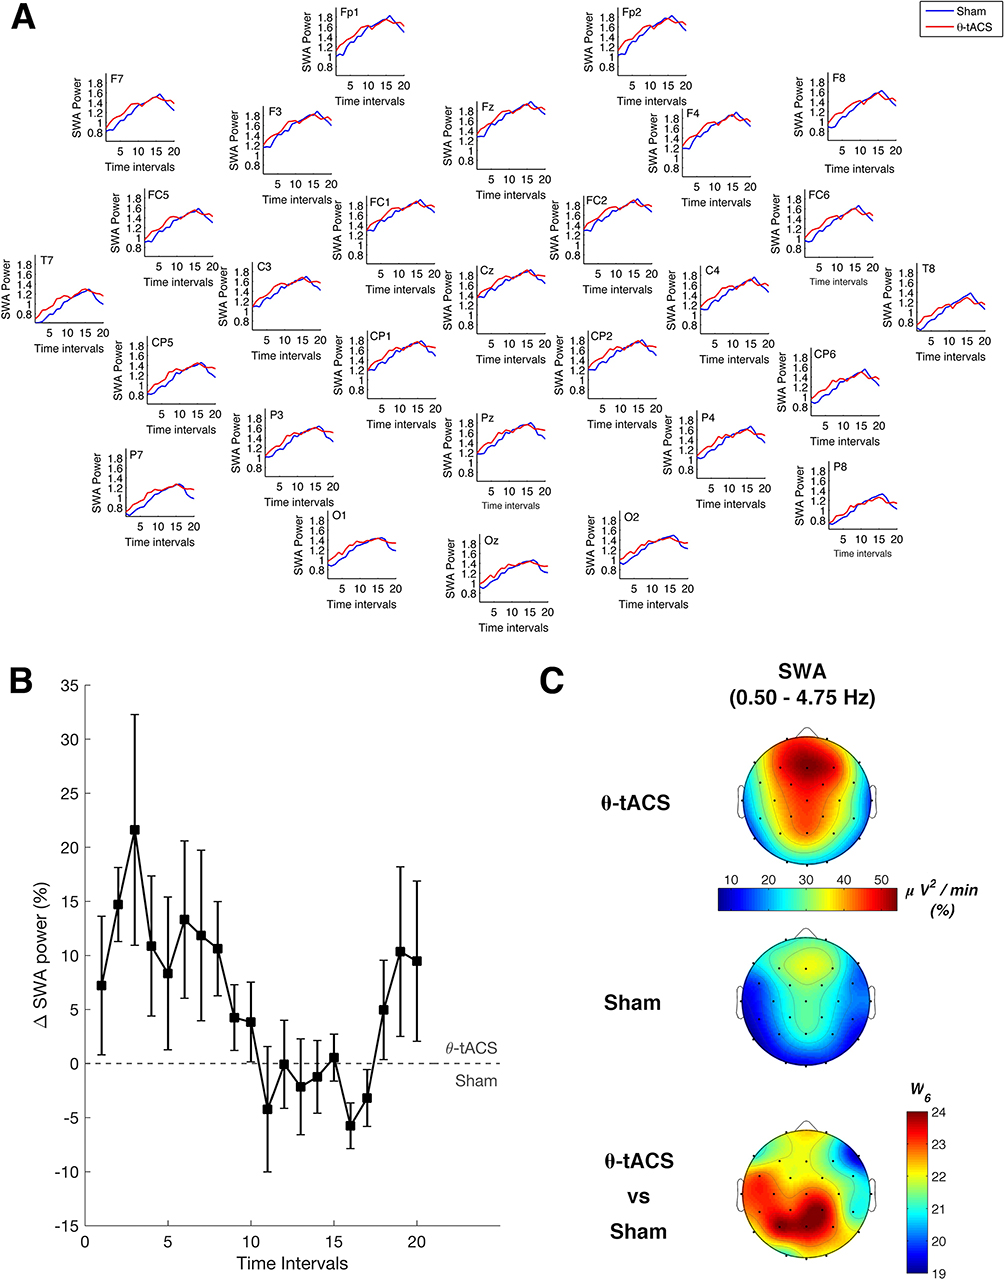
We then compared sleep SWA following the Active vs Sham stimulations. In this case, we observed a clear increase of SWA in the frontal, central, and parietal sites (Figure 4). According to the Bonferroni correction (p≤ 0.0376, with a mean intercorrelations between the dependent variables r= 0.915 and the number of comparisons n = 28 scalp locations), we found a significantly increased SWA on F3 (p=0.03), F4 (p=0.034), Fc2 (p=0.01), Fc5 (p=0.028), C3 (p=0.01), C4 (p=0.008), Cp1 (p=0.019), Cp2 (p=0.01), Cp5 (p=0.027), Cz (p=0.026), and Pz (p=0.032). Notably, this effect involves a large cluster interspersed between the frontotemporal areas stimulated by θ-tACS.
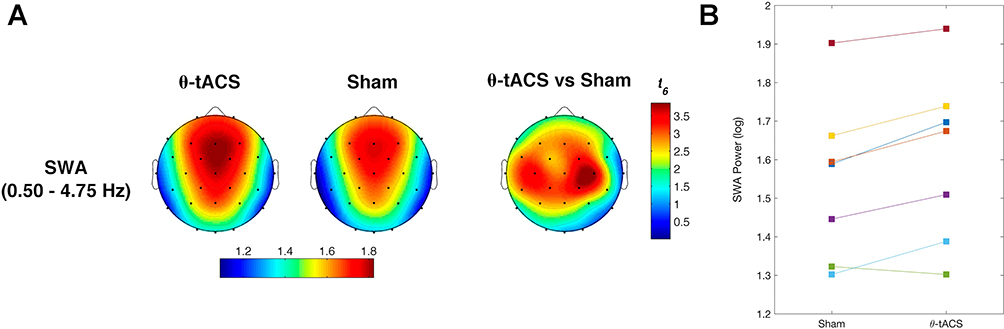 |
Figure 4 Effects of θ-tACS on sleep slow-wave activity (SWA) in responders. (A) Topographic distribution of the SWA power during the first NREM sleep cycle for Active (left) and Sham (central) conditions in responders to θ-tACS stimulation during wakefulness (n=7). The statistical map of the comparisons between the two experimental conditions by paired t-test is reported (right). Values are color coded, plotted at the corresponding position on the planar projection of the hemispheric scalp model and interpolated between electrodes. (B) Individual SWA power at C4 scalp location for Sham and Active conditions in responders. |
We also tested a different selection criterion for selecting the responders to the stimulation (ie, average increase of alpha power in the Active relative to sham condition) to check for the specificity of the chosen criterion. This control confirmed the goodness of the boosted theta as a criterion to selected responders since no significant difference (p > 0.05) was found in SWA or other frequency bands by comparing sleep after Active and after Sham stimulation in subjects (n=13) selected in this way.
According to the hypothesis that wake θ-tACS affects EEG activity by increasing sleep pressure, this variation of SWA in responders during the first sleep cycle should be larger at the onset of sleep (ie, closer to the awake stimulation). This was the case in our responders, who showed a clear difference in the time courses of SWA when comparing Active vs Sham conditions (Figure 5A). The repeated-measures ANOVA comparing on time intervals the SWA percentage difference (average of all EEG channels) between Active and Sham (Figure 5B) showed a significant effect of time (F= 1.813, p= 0.029), with the difference in SWA that is much larger in the first time intervals after sleep onset, not persisting in the second half of the first NREM period.
 |
Figure 5 Time-course of slow-wave activity during the first sleep cycle in responders to θ-tACS. (A) The time-course of the spectral power for slow-wave activity (0.50–4.75 Hz) during the first NREM sleep cycle of the naps following the Active (red line) and the Sham (blue line) stimulations in the responders' subgroup. The values were obtained by dividing the individual time period from the sleep onset to the first REM sleep (or the final awakening in absence of REM sleep) into 20 equal intervals and calculating the spectral power at each scalp location for each interval. Data were calculated for each subject, then averaged across subjects and the log-transformed values were plotted at the corresponding position on the planar projection of the scalp surface. (B) Mean percentage difference in SWA power between Active and Sham condition for the time intervals of the first NREM sleep cycle. Positive values indicate the prevalence of SWA in Active relative to the Sham condition. Error bars show the standard error. (C) Responders’ topographic distribution of the rise rate of SWA (0.50–4.75 Hz) during the first NREM sleep cycle modelled by a linear least-squares regression on individual time-course data, separately for the two conditions. The statistical map of the comparisons between the two experimental conditions by the Wilcoxon test is reported. Values are color coded, plotted at the corresponding position on the planar projection of the hemispheric scalp model and interpolated between electrodes. |
Furthermore, we modelled the rise-rate of SWA in the two conditions by a linear least-squares regression on individual data, to further characterize the temporal evolution of SWA within the sleep cycle. According to the literature, a faster build-up of SWA is associated with a higher homeostatic sleep pressure.19,23 The rise-rate has been quantified as the slope of the buildup of SWA calculated from the sleep onset to the moment of its maximum. To overcome the variability in the SWA power in adjacent epochs that makes hard to determine the endpoint for the computation of the slope, the maximum point of SWA has been estimated as a function of the maximum of the quadratic fit on the time-series of power data per epoch. The topographic distributions of the speed in the build-up of SWA in the two conditions confirmed the expected anteroposterior gradient of the SWA rising rate, with a clear frontal prevalence (Figure 5C). The comparison between conditions suggests, on average, a faster build-up of SWA after the θ-tACS than after sham, although no difference reached the statistical significance (p>0.10).
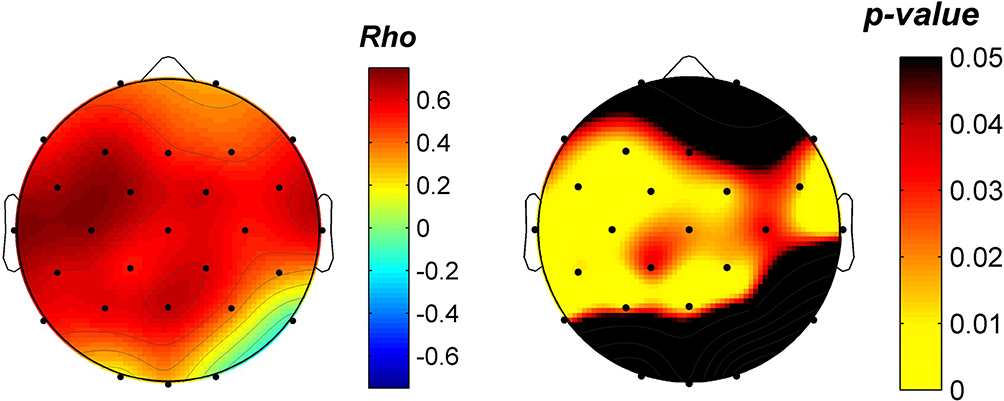
Finally, the enhancement of the theta activity during wake as a consequence of θ-tACS was topographically associated with the corresponding enhancement of SWA during sleep. The correlation (Spearman’s rho coefficient computed on the whole sample) between the stimulation effects on theta activity at rest and those on sleep SWA in active relative to sham condition was significant (corrected critic-p= 0.0152) for a wide cluster of electrodes encompassing frontal, central, temporal and parietal electrodes (C3: rho=0.72, p=0.0017; Cp2: rho=0.61, p=0.0108; Cp5: rho=0.61, p=0.0108; F3: rho=0.67, p=0.0044; Fc1: rho=0.69, p=0.0027; Fc2: rho=0.61, p=0.0108; Fc5: rho=0.68, p=0.0034; P3: rho=0.59, p=0.0142; Pz: rho=0.65, p=0.0059; T7: rho=0.76, p=0.0008; T8: rho=0.63, p=0.0078) with a trajectory that crosses the brain ideally connecting the two stimulation sites (Figure 6).
 |
Figure 6 Relationship between θ-tACS EEG effects during wakefulness and SWA modulation in the subsequent sleep. Topographic distribution of the Spearman’s Rho coefficients (left) and corresponding p-values (right) of the correlations between the θ-tACS effect on theta EEG activity [percentage of theta power increase (post-/pre-stimulation) in the Active relative to Sham condition] and the effect on the SWA during the subsequent sleep (Active/Sham) computed on the whole sample. Values are colour coded, plotted at the corresponding position on the planar projection of the hemispheric scalp model and interpolated between electrodes. |
EEG Differences During Resting Wake Between Responders And Non-Responders
The univocal pattern of heightened sleep pressure in responders raises the question of basic differences that may predict responsiveness to stimulation. To this aim, we compared resting EEG topography of responders and non-responders at the baseline (averaging individual data between the two experimental conditions). As shown in Figure 7, the two groups do not show a significant difference for any band or scalp location. Although not significant after correcting for multiple comparisons (p≤ 0.007, with a mean intercorrelation between the dependent variables r= 0.608 and the number of comparisons n: 5 frequency bands × 28 scalp derivations = 140), the responders tend to have a higher alpha activity in left temporo-parietal sites (p < 0.02).
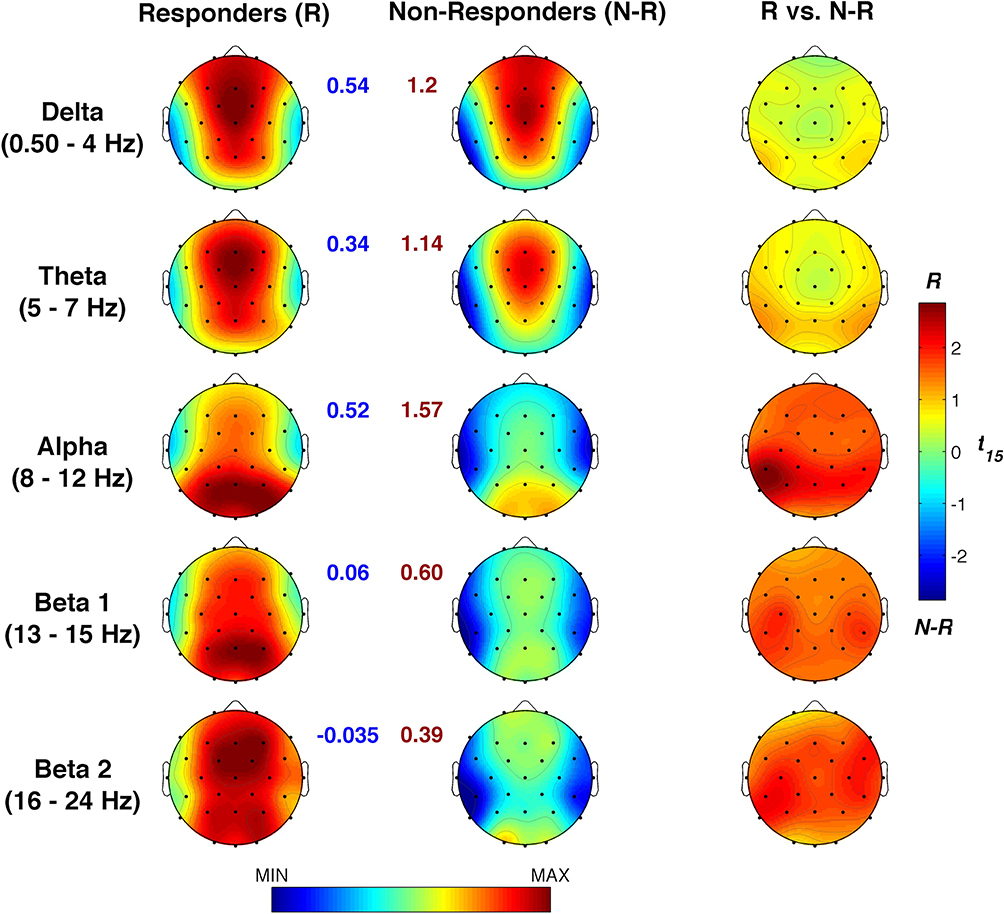 |
Figure 7 Baseline EEG differences during resting wake between responders and non-responders. Baseline topographic distribution of the waking EEG spectral powers in responders and non-responders and statistical maps of their comparisons by un-paired t-tests. Maps are plotted for the following frequency bands: slow-wave activity (SWA, 0.50–4.75 Hz), theta (5.00–7.75 Hz), alpha (8.00–11.75 Hz), sigma (12.00–15.75 Hz), and beta (16.00–24.75 Hz). Values are colour coded and plotted at the corresponding position on the planar projection of the scalp surface and are interpolated (biharmonic spline) between electrodes. The topographic maps (first and second columns) are scaled between minimal and maximal values considering the two experimental conditions within each frequency band. The minimum (blue number) and the maximum (red number) for each scale are also reported close to the corresponding maps. The statistical maps are scaled symmetrically according to the absolute maximal t-value across the statistical comparisons in all frequency bands. |
Discussion
The aim of our study was a direct evaluation of the ability of a tACS protocol to affect sleep pressure, after our recent demonstration that a 5-Hz tACS stimulation affects resting EEG by enhancing cortical EEG synchronization compared to a sham stimulation.11 Those findings also suggested that the effect of θ-tACS relays not only on the simple entrainment of cortical oscillations at the stimulation frequency, but it also induces a global and physiological synchronizing effect, affecting both the theta and alpha frequency ranges. Here, we have not been able to show any group effect on polysomnographic nor on topographic quantitative EEG measures. Sleep immediately following sham or active θ-tACS did not change in any aspect during the first sleep cycle when comparing sham vs active conditions. However, when we replicated the analyses focusing on the responders to the stimulation only, ie, those subjects who actually had the increase of the theta activity during wake after θ-tACS, as a marker of enhanced sleep pressure, the pattern of the results changed. These responders actually show clear effects on their sleep as a consequence of θ-tACS. After the active stimulation, compared to the sham, responders had: (1) an enhancement of sleep pressure as indicated by higher SWA; (2) a time course of the SWA revealing an increase much larger as closer to the sleep onset (ie, closer to the presleep stimulation), which progressively decrease across the first sleep cycle; and (3) a topographically specific correlation between changes of the theta activity during wake and corresponding changes of SWA during sleep. All these effects go in the direction of an increased sleep pressure, directly related to the previous increase of the theta activity as a consequence of θ-tACS. Hence, the more the subjects show the expected changes after the stimulation during wake, the more they also express a consistent pattern of changes during sleep.
According to the main aim of our study of responding to the fundamental question regarding the nature of the effects induced by θ-tACS during wakefulness,11 current results indicate that waking EEG changes, when present, are actually associated with an increase in sleep pressure. Unavoidably, the subsequent question becomes what differentiates responders from non-responders. Baseline resting EEG does not point to any significant difference between responders vs non-responders, at least with the type of standard analysis as adopted in the present study. We only observed a non-significant trend of higher alpha activity over the left centro-parietal sites in responders compared to non-responders. High alpha activity at rest could be interpreted both as a state or a trait factor predisposing to react to the subsequent transcranial stimulation. In other words, a higher alpha activity could indicate a more relaxed state (ie, state) or a basic individual factor (ie, trait) that facilitate the effects of θ-tACS. However, the lack of significance in the differences between groups does not allow to make other considerations on this regard.
This scenario questions that transcranial stimulations could be proposed at this stage as a method or, possibly, a treatment to promote physiological sleep. Actually, the small number of responders in our experimental sample raises some doubts on the generalizability of the results, which should be replicated in future studies with a larger sample size. On the other hand, the failure in identifying stable traits in baseline EEG differentiating responders from non-responders does not allow to design future studies specifically aimed to directly re-test the efficacy of the protocol in a sample selected ad-hoc as responders to the treatment. Indeed, it should be highlighted that the post-hoc selection of our responders in the present study can be considered as one of the main limits. Accordingly, future studies should also focus on the factors that modulate the presence/absence of coherent responses to θ-tACS. In our opinion, special attention should be devoted to the individual vulnerability to sleep deprivation. Phenotypic vulnerability to the effects of sleep loss has been explained by numerous (genetic, neurochemical, physiological, psychological or structural) factors, although none of these factors fully accounts for this phenomenon (for a comprehensive review, see24). We can speculate that individual responsiveness to transcranial stimulation affecting sleepiness may depend on individual vulnerability to sleep deprivation. In other words, people less vulnerable to sleep loss could also be less responsive to transcranial stimulation. This speculation is indeed testable by investigating the effects of θ-tACS in groups with different vulnerability to sleep loss, as defined on the basis of cognitive performance and subjective reports.25 Finally, attention should be also devoted to an individual characterization of the dynamic connectivity of brain regions across the wake–sleep transition, focusing on an optimal balance between local specialization (segregation) and global integration.26 In fact, we have recently described (by group analyses) how sleep onset is characterized by stronger connectivity in the sigma band paralleled by decreased connectivity in the low-frequency bands (ie, delta and theta activity).27 In such a way, timing and topography of the specific mechanisms for the maintenance of functional connectivity may potentially discriminate individual responding and not responding with an EEG synchronization to transcranial stimulation.
Acknowledgments
This work was supported by a grant from “Ministero della Salute” (Ministry of Health) (grant number RF-2009–1528677), and by grants from University of Rome Sapienza to LDG from “Progetti di Ricerca di Ateneo" 2012 (grant number C26A1254AT), 2013 (grant number C26A139JL4), 2014 (grant number C26A143ZEP).
Author Contributions
All authors contributed to data analysis, drafting and revising the article, gave final approval of the version to be published, and agree to be accountable for all aspects of the work.
Disclosure
The authors report no conflicts of interest in this work.
References
1. Annarumma L, D’Atri A, Alfonsi V, De Gennaro L. The efficacy of transcranial current stimulation techniques to modulate resting-state EEG, to affect vigilance and to promote sleepiness. Brain Sci. 2018;8(7). doi:10.3390/brainsci8070137
2. Massimini M, Ferrarelli F, Esser SK, et al. Triggering sleep slow waves by transcranial magnetic stimulation. Proc Natl Acad Sci U S A. 2007;104(20):8496–8501. doi:10.1073/pnas.0702495104
3. Marshall L, Helgadóttir H, Mölle M, Born J. Boosting slow oscillations during sleep potentiates memory. Nature. 2006;444(7119):610–613. doi:10.1038/nature05278
4. Krone L, Frase L, Piosczyk H, et al. Top-down control of arousal and sleep: fundamentals and clinical implications. Sleep Med Rev. 2016. doi:10.1016/j.smrv.2015.12.005
5. Assenza G, Pellegrino G, Tombini M, Di Pino G, Di Lazzaro V. Wakefulness delta waves increase after cortical plasticity induction. Clin Neurophysiol. 2015;126(6):1221–1227. doi:doi:10.1016/j.clinph.2014.09.029
6. Mensen A, Gorban C, Niklaus M, Kuske E, Khatami R. The effects of theta-burst stimulation on sleep and vigilance in humans. Front Hum Neurosci. 2014;8(June):1–10. doi:10.3389/fnhum.2014.00420
7. Frase L, Piosczyk H, Zittel S, et al. Modulation of total sleep time by Transcranial Direct Current Stimulation (tDCS). Neuropsychopharmacology. 2016;(April):1–10. doi:10.1038/npp.2016.65
8. Kirov R, Weiss C, Siebner HR, Born J, Marshall L. Slow oscillation electrical brain stimulation during waking promotes EEG theta activity and memory encoding. Proc Natl Acad Sci. 2009;106(36):15460–15465. doi:doi:10.1073/pnas.0904438106
9. Bergmann TO, Groppa S, Seeger M, Molle M, Marshall L, Siebner HR. Acute changes in motor cortical excitability during slow oscillatory and constant anodal transcranial direct current stimulation. J Neurophysiol. 2009;102(4):2303–2311. doi:10.1152/jn.00437.2009. doi:00437.2009 [pii].
10. D’Atri A, De Simoni E, Gorgoni M, et al. Electrical stimulation of the frontal cortex enhances slow-frequency EEG activity and sleepiness. Neuroscience. 2016;324:119–130. doi:10.1016/j.neuroscience.2016.03.007
11. D’Atri A, Romano C, Gorgoni M, et al. Bilateral 5 Hz transcranial alternating current stimulation on fronto-temporal areas modulates resting-state EEG. Sci Rep. 2017;7(1):15672. doi:10.1038/s41598-017-16003-2
12. De Gennaro L, Ferrara M, Bertini M. The boundary between wakefulness and sleep: quantitative electroencephalographic changes during the sleep onset period. Neuroscience. 2001;107(1):1–11. doi:10.1016/S0306-4522(01)00309-8
13. Kaida K, Takahashi M, Åkerstedt T, et al. Validation of the Karolinska sleepiness scale against performance and EEG variables. Clin Neurophysiol. 2006;117(7):1574–1581. doi:10.1016/j.clinph.2006.03.011
14. Rechtschaffen A, Kales A. A manual of standardized techniques and scoring system for sleep stages of human subjects. Washington, DC US Gov Print Off. 1968;NIH Public:12. doi:10.1016/0013-4694(69)90021-2
15. Sankoh AJ, Huque MF, Dubey SD. Some comments on frequently used multiple endpoint adjustment methods in clinical trials. Stat Med. 1997;16(22):2529–2542. doi:10.1002/(SICI)1097-0258(19971130)16:22<2529::aid-sim692>3.0.CO;2-J
16. Perneger TV. What’s wrong with Bonferroni adjustments. BMJ. 1998;316(7139):1236 LP- 1238. doi:10.1136/bmj.316.7139.1236
17. Scarpelli S, D’Atri A, Mangiaruga A, et al. Predicting dream recall: EEG activation during NREM sleep or shared mechanisms with wakefulness? Brain Topogr. 2017;30(5):629–638. doi:10.1007/s10548-017-0563-1
18. Aeschbach D, Borbély AA. All-night dynamics of the human sleep EEG. J Sleep Res. 1993;2(2):70–81. doi:10.1111/j.1365-2869.1993.tb00065.x
19. Marzano C, Moroni F, Gorgoni M, Nobili L, Ferrara M, De Gennaro L. How we fall asleep: regional and temporal differences in electroencephalographic synchronization at sleep onset. Sleep Med. 2013;14(11):1112–1122. doi:10.1016/j.sleep.2013.05.021
20. De Gennaro L, Ferrara M, Vecchio F, Curcio G, Bertini M. An electroencephalographic fingerprint of human sleep. Neuroimage. 2005;26(1). doi:10.1016/j.neuroimage.2005.01.020
21. De Gennaro L, Marzano C, Veniero D, et al. Neurophysiological correlates of sleepiness: a combined TMS and EEG study. Neuroimage. 2007;36(4). doi:10.1016/j.neuroimage.2007.04.013
22. Gorgoni M, Ferlazzo F, Ferrara M, et al. Topographic electroencephalogram changes associated with psychomotor vigilance task performance after sleep deprivation. Sleep Med. 2014;15(9):1132–1139. doi:10.1016/j.sleep.2014.04.022
23. Finelli LA, Baumann H, Borbély AA, Achermann P. Dual electroencephalogram markers of human sleep homeostasis: correlation between theta activity in waking and slow-wave activity in sleep. Neuroscience. 2000;101(3):523–529. doi:10.1016/S0306-4522(00)00409-7
24. Tkachenko O, Dinges DF. Interindividual variability in neurobehavioral response to sleep loss: a comprehensive review. Neurosci Biobehav Rev. 2018;89:29–48. doi:10.1016/j.neubiorev.2018.03.017
25. van Dongen HPA, Vitellaro KM, Dinges DF. Individual differences in adult human sleep and wakefulness: leitmotif for a research agenda. Sleep. 2005;28(4):479–498. doi:10.1093/sleep/28.4.479
26. Watts DJ, Strogatz SH. Collective dynamics of ‘small-world’ networks. Nature. 1998;393(6684):440–442. doi:10.1038/30918
27. Vecchio F, Miraglia F, Gorgoni M, et al. Cortical connectivity modulation during sleep onset: a study via graph theory on EEG data. Hum Brain Mapp. 2017;38(11):5456–5464. doi:10.1002/hbm.23736
 © 2019 The Author(s). This work is published and licensed by Dove Medical Press Limited. The
full terms of this license are available at https://www.dovepress.com/terms
and incorporate the Creative Commons Attribution
- Non Commercial (unported, 3.0) License.
By accessing the work you hereby accept the Terms. Non-commercial uses of the work are permitted
without any further permission from Dove Medical Press Limited, provided the work is properly
attributed. For permission for commercial use of this work, please see paragraphs 4.2 and 5 of our Terms.
© 2019 The Author(s). This work is published and licensed by Dove Medical Press Limited. The
full terms of this license are available at https://www.dovepress.com/terms
and incorporate the Creative Commons Attribution
- Non Commercial (unported, 3.0) License.
By accessing the work you hereby accept the Terms. Non-commercial uses of the work are permitted
without any further permission from Dove Medical Press Limited, provided the work is properly
attributed. For permission for commercial use of this work, please see paragraphs 4.2 and 5 of our Terms.