Back to Journals » Drug Design, Development and Therapy » Volume 11
β3-Adrenoceptor activation upregulates apolipoprotein A-I expression in HepG2 cells, which might further promote cholesterol efflux from macrophage foam cells
Authors Gao XQ, Li YF, Jiang ZL
Received 13 December 2016
Accepted for publication 25 January 2017
Published 3 March 2017 Volume 2017:11 Pages 617—627
DOI https://doi.org/10.2147/DDDT.S130088
Checked for plagiarism Yes
Review by Single anonymous peer review
Peer reviewer comments 2
Editor who approved publication: Dr Tuo Deng
Xia-qing Gao,1,2 Yan-fang Li,1,2 Zhi-li Jiang1,2
1Department of Cardiology, Beijing Anzhen Hospital, Capital Medical University, 2Beijing Institute of Heart, Lung and Blood Vessel Diseases, Beijing, People’s Republic of China
Objective: The aim of this study was to explore the effects of β3-adrenoceptor (β3-AR) activation on HepG2 cells and its influence on cholesterol efflux from macrophage foam cells.
Materials and methods: HepG2 cells were cultured and treated with the β3-AR agonist, BRL37344, and antagonist, SR52390A, and the expression of apolipoprotein (Apo) A-I, ApoA-II, ApoB, and β3-AR in the supernatants and cells was determined. The expression of peroxisome proliferator-activated receptor (PPAR) γ and PPARα in the HepG2 cells was also assessed. Next, using the RAW264.7 macrophage foam cell model, we also assessed the influence of the HepG2 cell supernatants on lipid efflux. The cholesterol content of the foam cells was also measured, and the cholesterol efflux from the macrophages was examined by determining 3H-labeled cholesterol levels. Expression of ATP-binding cassette transporter (ABC) A1 and ABCG1 of the macrophage foam cells was also assessed.
Results: β3-AR activation increased ApoA-I expression in both the HepG2 cells and the supernatants; PPARγ expression was upregulated, but PPARα expression was not. Treatment with GW9662 abolished the increased expression of ApoA-I induced by the β3-AR agonist. The HepG2 cell supernatants decreased the lipid accumulation and increased the cholesterol efflux from the macrophage foam cells. ABCA1 expression, but not ABCG1 expression, increased in the macrophage foam cells treated with BRL37344-treated HepG2 cell supernatants.
Conclusion: Activation of β3-AR in HepG2 cells upregulates ApoA-I expression, which might further promote cholesterol efflux from macrophage foam cells. PPARγ might be required for the induction of ApoA-I expression.
Keywords: β3-adrenoceptor, HepG2 cell, macrophage foam cell, atherosclerosis, cholesterol efflux, reverse cholesterol transport
Abbreviations
ABC, adenosine triphosphate (ATP)-binding cassette transporter; Apo, apolipoprotein; β3-AR, β3-adrenoceptor; AS, atherosclerosis; BAT, brown adipose tissue; BSA, bovine serum albumin; cAMP, cyclic adenosine monophosphate; DMEM, Dulbecco’s Modified Eagle’s Medium; ECL, enhanced chemiluminescence; ELISA, enzyme-linked immunosorbent assay; FBS, fetal bovine serum; FC, free cholesterol; GAPDH, glyceraldehyde-3-phosphate dehydrogenase; HDL, high-density lipoprotein; LXR, liver X receptor; MAPK, mitogen-activated protein kinase; P/S, penicillin-streptomycin antibiotic; PAGE, polyacrylamide gel electrophoresis; PBS, phosphate-buffered saline; PI3K, phosphatidylinositol-3-kinase; PKC, protein kinase C; PMSF, phenylmethylsulfonyl fluoride; PPAR, peroxisome proliferator-activated receptor; PPRE, peroxisome proliferator response element; RCT, reverse cholesterol transport; RMR, resting metabolic rate; RT-PCR, real-time polymerase chain reaction; SDS, sodium dodecyl sulfate; SEM, standard error of the mean; TC, total cholesterol.
Introduction
Cardiovascular and cerebrovascular diseases caused by AS are the leading causes of death. The formation of foam cells is not only one of the early signs of AS but also a key step in the genesis and development of AS. The main reason for the formation of foam cells is imbalances in the inflow and outflow of cholesterol within macrophages. Therefore, promoting lipid efflux from macrophages might be an effective way to inhibit foam cell formation and delay the occurrence and development of atherosclerotic lesions. RCT is defined as the transport of cholesterol from peripheral tissues and cells to the liver for further metabolism and involves cholesterol efflux from cells such as macrophages and vascular smooth muscle cells to acceptors outside of cells such as HDL.1 The development of ways to promote RCT has recently become the new focus of anti-AS research.
HDL is mainly synthesized by hepatocytes and can be used as the most promising target for regulating RCT. However, results from a series of clinical trials of CETP inhibitors showed that the elevation of HDL results neither in better clinical prognosis2,3 nor in greater function4,5 in the promotion of RCT. These data suggested that the increased HDL in plasma does not necessarily reflect the increased capacity of RCT.6 Therefore, researchers reached a consensus that the prebeta HDL is the major acceptor for cholesterol efflux, which mainly consists of poorly lapidated ApoA-I and is seldom present in plasma.7
β3-AR was discovered in the 1980s and is mainly expressed in white adipose tissue and BAT, but it has also been detected in the heart, brain, lungs, and liver.8 Activation of β3-AR modulates the thermogenesis of BAT and lipid metabolism in white adipose tissue. Moreover, the Trp64Arg polymorphism in β3-AR is associated with abdominal obesity and insulin resistance.9 Our previous study showed that β3-AR activation can significantly ameliorate lipid metabolism disorders, increase plasma HDL levels, and decrease the atherosclerotic plaque area of the thoracic aorta in ApoE−/− mice,10,11 which suggested that β3-AR activation promotes RCT and ameliorates AS. However, the precise mechanism underlying this effect of β3-AR activation needs further exploration.
Therefore, in this study, we aimed to study the effect of β3-AR activation on the expression of ApoA-I, the major component of HDL, in HepG2 cells and to elucidate the underlying mechanism and its possible influence on cholesterol efflux from macrophage foam cells.
Materials and methods
Materials
FBS, DMEM, P/S, trypsin, HepG2 cell lines, and RAW264.7 cell lines were purchased from Gibco (Grand Island, NY, USA). BSA and PMSF were obtained from Amresco (Solon, OH, USA). BRL37344 (β3-AR agonist), SR59230A (β3-AR antagonist), GW9662 (2-chloro-5-nitro-N-phenylbenzamide), adio-immunoprecipitation assay (RIPA) lysis buffer, and 10× Tris buffered saline Tween-20 (TBST) (pH 8.0) were purchased from Sigma-Aldrich (St Louis, MO, USA). Acetylation-LDL (ac-LDL) (used for lipid loading) and primers were purchased from Invitrogen (Carlsbad, CA, USA). The cell counting kit 8 (CCK-8) assay kit was obtained from Dojindo Laboratories (Kumamoto, Japan). The RNA extraction kit was purchased from Tiangen Biotechnology Co., Ltd (Beijing, China). The RNA reverse transcription (PrimeScript™ RT Reagent Kit) and RT-PCR kits (SYBR® Premix Ex Taq™ II) were purchased from Takara Bio (Shiga, Nagano, Japan). ELISA kits for ApoA-I, ApoA-II, ApoB, and β3-AR, as well as the BCA protein assay kit, were purchased from Promega (Madison, WI, USA). The TC and FC enzymatic assay kits were purchased from Wako Chemicals USA (Irvine, CA, USA). [3H] cholesterol was purchased from Amersham (Arlington Heights, IL, USA). Antibodies against ApoA-I, ApoA-II, ApoB, β3-AR, PPARγ, PPARα, ABCA1, ABCG1, and GAPDH were purchased from Abcam (Cambridge, MA, USA). Goat antirabbit and antimouse secondary antibodies were purchased from Tiandeyue (Beijing, China). The SDS-PAGE Gel Preparation Kit and nitrocellulose membranes were purchased from Beyotime Biotechnology Co., Ltd (Beijing, China). ECL solution was purchased from Millipore (Boston, MA, USA).
Culture and treatment of HepG2 cells
HepG2 cells were cultured in DMEM supplemented with 10% (v/v) FBS and antibiotics (100 μg/mL penicillin G and 100 μg/mL streptomycin) under 5% CO2 at 37°C. The medium was changed every other day, and the cells were passaged when they reached 70%–80% confluence, followed by seeding in six-well plates at a density of 1×10⁵ cells/L. For the β3-AR agonist (BRL37344) and antagonist (SR59230A) activity assay, the cells were treated with various concentrations of the β3-AR agonist and antagonist for various durations as described in the “CCK-8 assay for the determination of cell viability” section. The optimum concentration of BRL37344 and SR59230A and the duration of the treatment were then selected and used to treat the HepG2 cells. After 24 h of HepG2 cell treatment, the supernatants were collected by centrifugation at 12,000× g for 10 min at 4°C and used for the subsequent experiments.
Culture and treatment of RAW264.7 macrophages cells
RAW264.7 macrophages were cultured in DMEM supplemented with 10% (v/v) FBS and 25 mM D-glucose in a humidified incubator at 37°C under 5% CO2. Upon attaining 60%–70% confluence, the cells were seeded in 24-well plates at a density of 1×10⁵ cells/L. Next, the β3-AR agonist and antagonist activity assays were conducted as described in the “CCK-8 assay for the determination of cell viability” section. Twenty-four hours later, the cells were washed with PBS three times and incubated with ac-LDL (50 μg/mL) for 24 h for lipid loading. Oil Red O staining was performed to verify the establishment of the model. After lipid loading, the RAW264.7 cells were treated with the supernatants from HepG2 cells that were treated with BRL37344 or SR59230A for another 20 h.12–14
CCK-8 assay for the determination of cell viability
For determining cell viability, 1×10³ cells/well were seeded in 96-well plates overnight under 5% CO2 at 37°C. The cells were then exposed to BRL37344 or SR59230A at concentrations of 0, 10−5, 10−6, 10−7, 10−8, 10−9, and 10−10 mol/L for 6, 12, 24, and 48 h. The supernatants were then collected from the cells, and 10 μL of CCK-8 solution was added to each well, followed by incubation at 37°C for 3 h. The OD values were then measured at 450 nm. Finally, 10−5 or 10−6 mol/L BRL37344 and 10−6 mol/L SR59230A were chosen as the optimum concentrations for the treatment of the HepG2 cells.
ELISA assay for ApoA-I, ApoA-II, ApoB, and β3-AR levels in the HepG2 cell supernatants
The media from the cultures of the HepG2 cells were collected and centrifuged at 15,000× g for 8 min at 4°C to obtain the supernatants. Next, 96-well plates were blocked with 10 mg/mL BSA in PBS after coating with primary antibodies at 37°C for 1 h. The plates were then rinsed with PBS three times and incubated with 100 μL of the HepG2 cell supernatants for 2 h at 4°C. Finally, goat antirabbit antibody was added and the cells were again incubated at room temperature for 45 min. Twenty minutes later, stopping buffer was added and the plates were read at 450 nm.
Enzymatic assay for TC, FC, and CE levels in the macrophage foam cells
The foam cells from each group were washed twice with PBS, and the cells in each well were added with 1 mL distilled water into centrifuge tubes for sonication. Ten microliters of the samples were reserved for the determination of protein concentration, and 500 μL of the sample and 2 mL of chloroform and methanol mixture were mixed and shaken thoroughly. This mixture was then centrifuged at 15,000× g for 5 min at 15°C. Next, 1 mL of the solution from the lower compartment was transferred to another centrifuge tube for vacuum drying. The lipid was then dissolved in 100 μL of isopropanol containing 10% Triton X-100. Enzymatic assay kits were used to determine the TC and FC concentrations; CE was determined as the difference between TC and FC.
Measurement of cholesterol efflux
For determining the cholesterol efflux of the lipid-loaded RAW264.7 cells, RAW264.7 cells were incubated with 0.2 μCi/mL [3H] cholesterol and 50 μg/mL ac-LDL in DMEM for 24 h. After washing twice with PBS, the cells were cultured with the supernatants from the HepG2 cells for another 20 h. The supernatants of the RAW264.7 cells were then collected and centrifuged at 15,000× g for 10 min at 4°C, followed by washing twice with PBS. The cells were then lysed with 0.5 mol/L NaOH, and the [3H] radioactivity of cholesterol in the supernatants and cell lysates was determined using a liquid scintillation counter. Cholesterol efflux rate was calculated as the ratio of radioactivity in the supernatant/(supernatants + cell lysates) ×100%.
RNA extraction and analysis
To determine the mRNA concentrations of ApoA-I, ApoA-II, ApoB, and β3-AR in the three HepG2 cell groups, total RNA was extracted from the cells using Trizol and RNA quality was determined using NanoDrop® 2000. cDNA was then reverse-transcribed from the total RNA using the PrimeScript™ RT Reagent Kit with the gDNA eraser. RT-PCR was then performed using the RT-PCR detection system (ABI7500) with 10 μL of 2× SYBR® Premix Ex Taq™ II master mix, 0.5 μL each of forward and reverse primers, 2 μL cDNA, and 5 μL deionized water. The conditions were as follows: 95°C for 30 s to activate the DNA synthesis enzyme, followed by an amplification cycle of 95°C for 5 s and 60°C for 40 s for a total of 40 cycles. The sequences of the specific primers are listed in Table 1.
 | Table 1 Primer sequences |
Protein extraction and Western blot
The HepG2 and macrophage foam cells were collected and washed with precooled PBS three times and placed on ice. Next, 10 μL of 0.1 M PMSF was added to the cells before protein extraction, and 1 mL of RIPA was added to every 1×10⁷ cells. The cells were then incubated on ice for 20 min and centrifuged at 13,000× g for 20 min at 4°C. The supernatants were then collected into sterile eppendorf (EP) tubes, and total cellular protein concentration was determined using the Bio-Rad protein assay reagent. Protein concentration was adjusted using RIPA, and the proteins were separated by SDS-PAGE and transferred to a nitrocellulose membrane run at 300 mA for 1–2 h. The membrane was then blocked with 3% BSA–TBST for 30 min and incubated with antibodies against ApoA-I, ApoA-II, ApoB, β3-AR, PPARγ, PPARα, ABCA1, and ABCG1 diluted with 3% BSA–TBST (1:1,000 or 1:2,000) at room temperature for 10 min and then overnight at 4°C (GAPDH was used as a control). The membrane was then washed with TBST five times (3 min each time) and then incubated with goat antirabbit and goat antimouse antibodies (diluted to 1:1,000 using TBST). Finally, ECL was added to the membrane for 3–5 min; the membrane was then allowed to develop for 2 min and fixed. Images were analyzed with the ChemiDoc XRS system using the Quantity One Software (Bio-Rad; Hercules, CA, USA), and the results were expressed as protein/GAPDH ratio.
Statistical analysis
All data were expressed as mean ± SEM. Statistical significance between more than two groups was analyzed using one-way analysis of variance (ANOVA) (Bonferroni’s correction was used for post hoc t-test for comparison between two groups). P<0.05 was considered statistically significant.
Results
Effect of β3-AR activation on the concentrations of ApoA-I, ApoA-II, ApoB, and β3-AR in the HepG2 cell supernatants
The concentration of ApoA-I significantly increased after BRL37344 treatment (BRL37344 group) and significantly decreased after SR59230A treatment (SR59230A group) compared to that in the control group (P<0.01). In contrast, the ApoA-II level in the BRL37344 group was significantly lower compared to that in the control (P<0.05) and the SR59230A (P<0.05) groups. ApoB levels were not significantly different between the three groups (P>0.05). Compared with the control group, the BRL37344 group showed significantly higher β3-AR levels (P<0.01), while the SR59230A group showed significantly lower β3-AR levels (P<0.01, Figure 1).
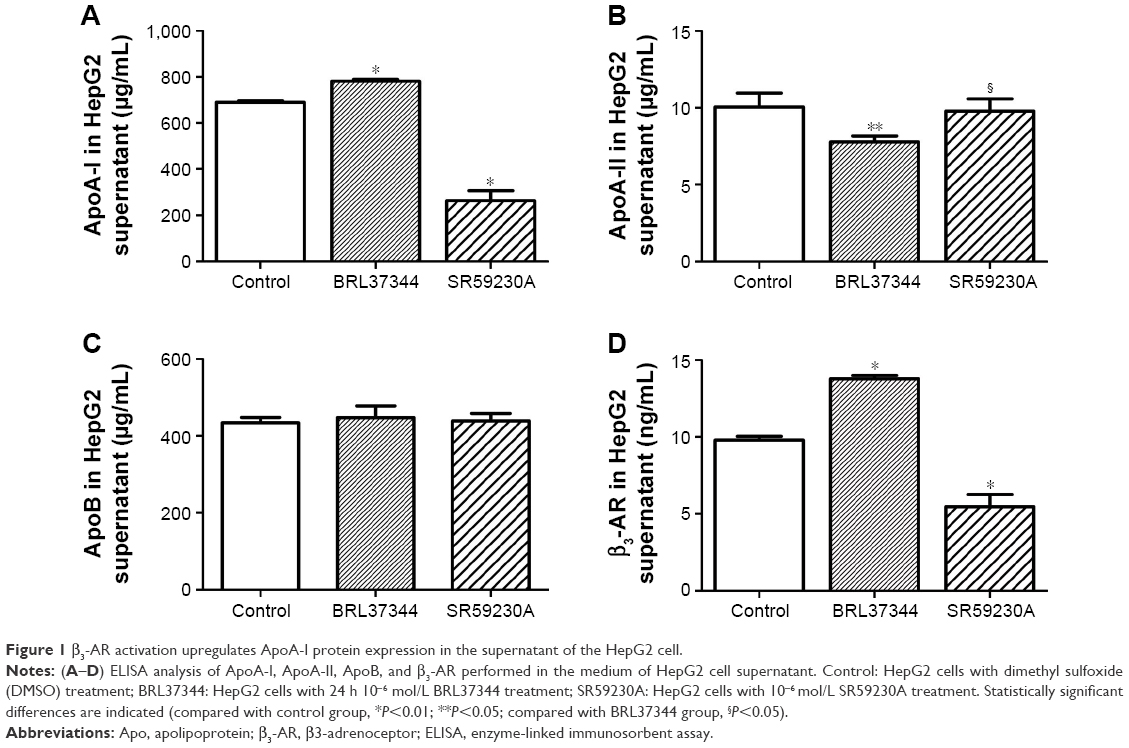 | Figure 1 β3-AR activation upregulates ApoA-I protein expression in the supernatant of the HepG2 cell. |
Effect of β3-AR activation on the mRNA and protein expressions of ApoA-I, ApoA-II, ApoB, and β3-AR in the HepG2 cells
Results from RT-PCR analysis showed that, compared with the control group, the BRL37344 group showed significantly higher ApoA-I mRNA expression (P<0.01) and the SR59230A group showed significantly lower ApoA-I mRNA expression (P<0.01). In contrast, ApoA-II mRNA expression in the BRL37344 group was significantly lower compared to that in the control group (P<0.01) and the SR59230A group (P<0.01). However, ApoB mRNA expression was not significantly different between the three groups (P>0.05). β3-AR mRNA expression in the BRL37344 group was significantly higher (P<0.01), while that in the SR59230A group was significantly lower (P<0.01) compared to that in the control group (Figure 2). Results from the Western blot also showed similar trends (Figure 3).
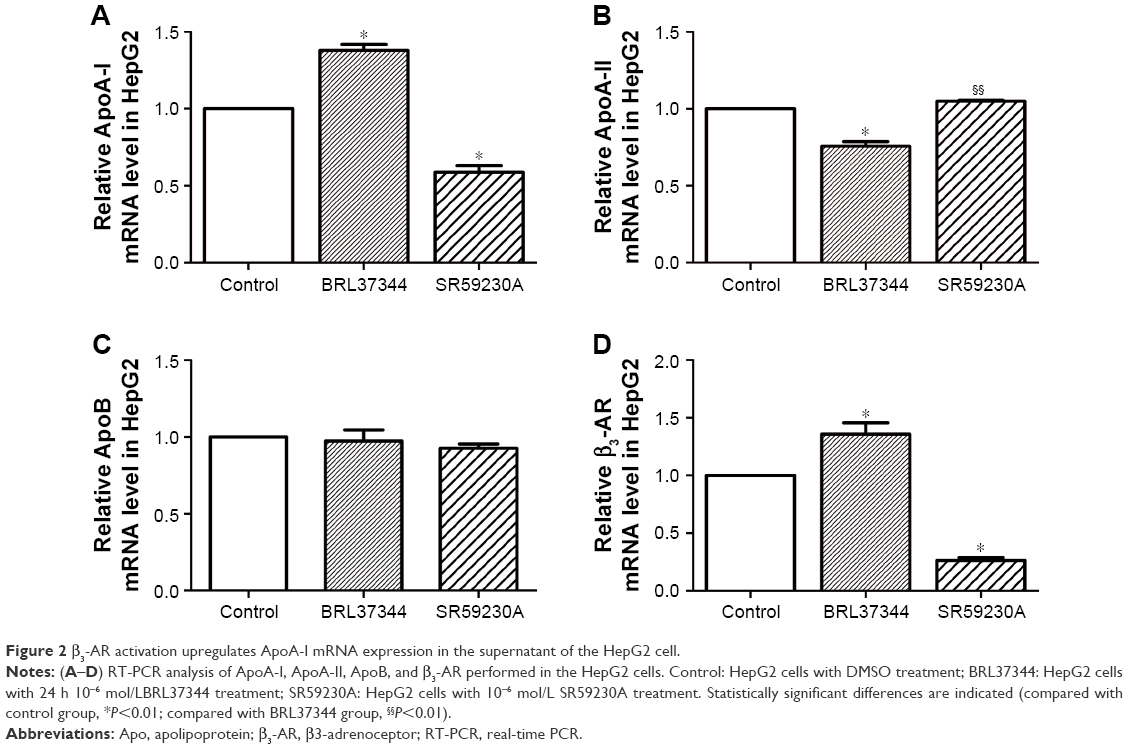 | Figure 2 β3-AR activation upregulates ApoA-I mRNA expression in the supernatant of the HepG2 cell. |
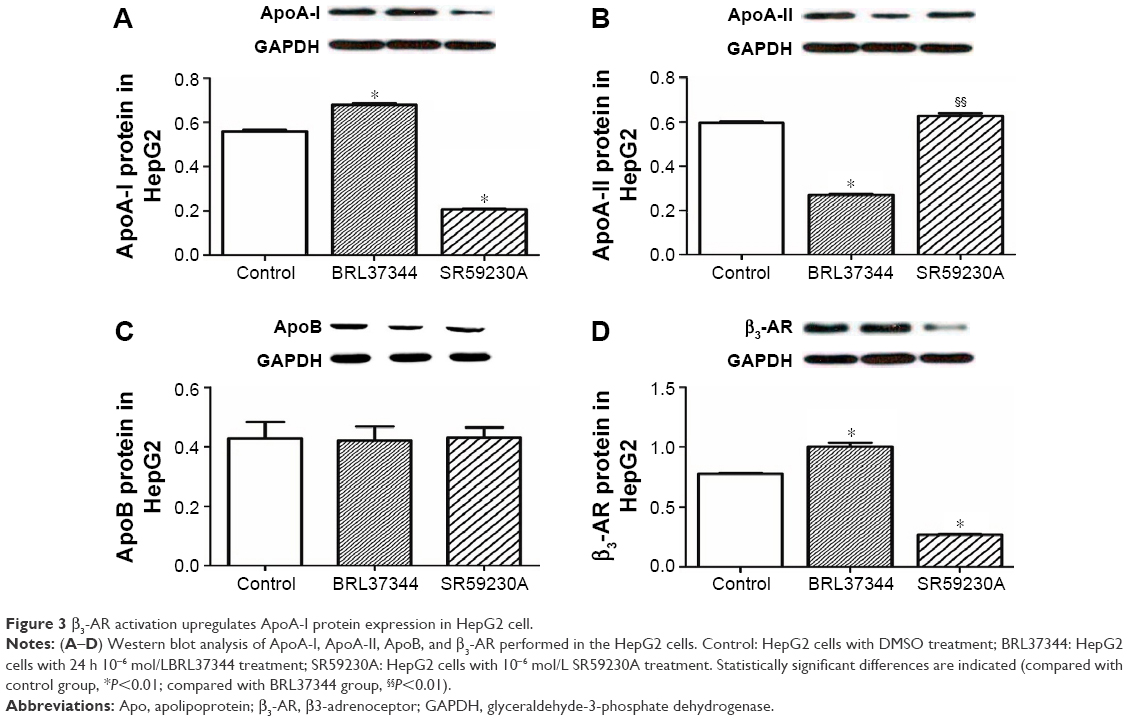 | Figure 3 β3-AR activation upregulates ApoA-I protein expression in HepG2 cell. |
Effect of β3-AR activation on PPARγ and PPARα and its role in regulating ApoA-I expression in HepG2 cells
Results from the Western blot showed that BRL37344 treatment significantly elevated PPARγ (P<0.01) expression but not PPARα expression, whereas SR59230A treatment had the opposite effect (P<0.01). Moreover, compared with the control group, the BRL37344 group showed significantly elevated ApoA-I protein expression (P<0.01). The upregulation of ApoA-I protein expression by BRL37344 was significantly impeded by GW9662 (a PPAR antagonist) (P<0.01, Figure 4).
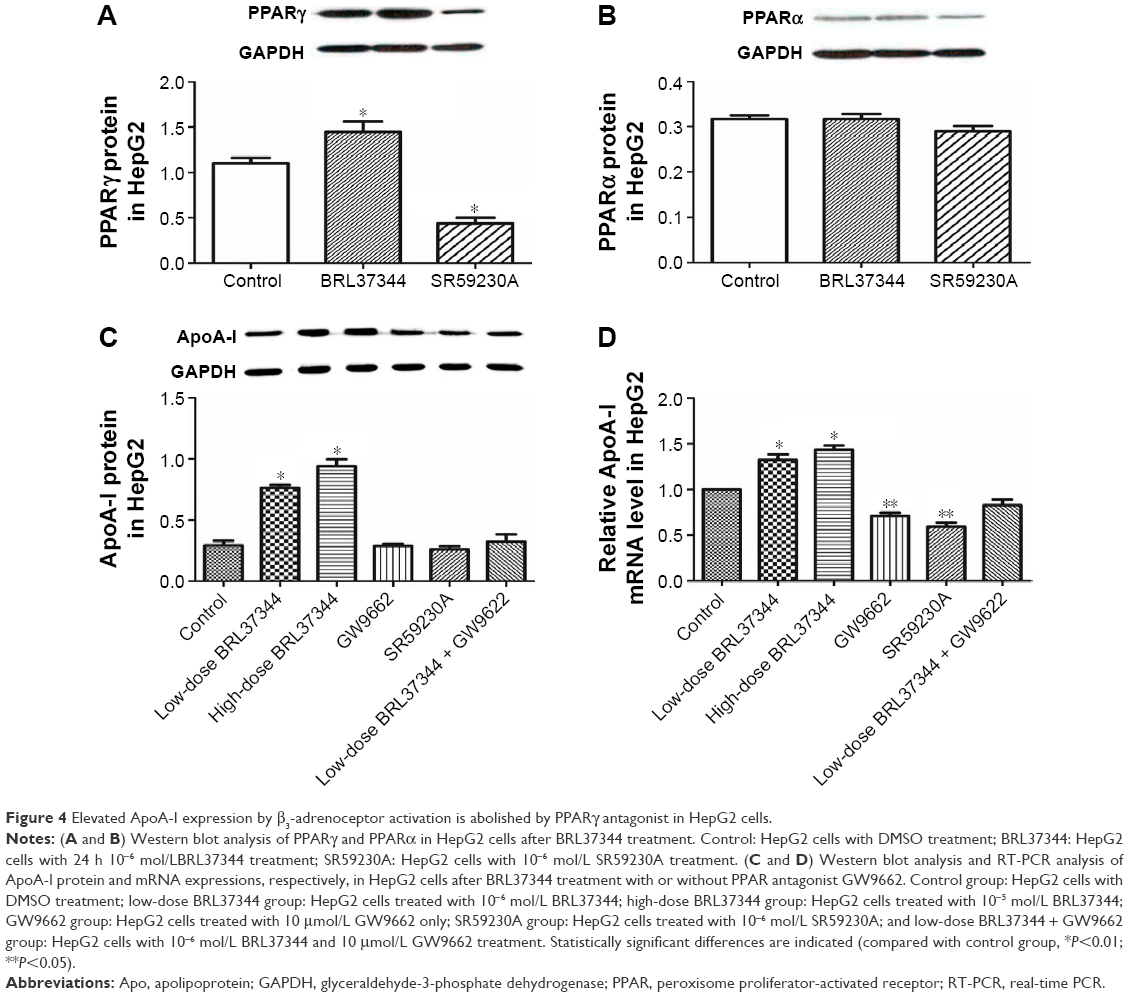 | Figure 4 Elevated ApoA-I expression by β3-adrenoceptor activation is abolished by PPARγ antagonist in HepG2 cells. |
Effect of treatment with supernatants of HepG2 cells treated with the β3-AR agonist on the TC, FC, and CE levels and cholesterol efflux of macrophage foam cells
Compared with the supernatants of the control HepG2 cells, the supernatants of the BRL37344-treated HepG2 cells significantly reduced the intracellular levels of TC and CE but increased the FC levels in the lipid-loaded RAW264.7 cells. However, direct administration of BRL37344 or SR59230A showed no effect on the lipid-loaded RAW264.7 cells (Figure 5A–C). This result indicated that β3-AR activation-induced secretions in HepG2 cells, and not the direct action of the β3-AR agonist, might promote cholesterol-mediated efflux from the macrophages. Cholesterol efflux rates also significantly increased in the macrophages treated with supernatants from the BRL37344 group (P<0.01, Figure 5D) compared to that in the other groups.
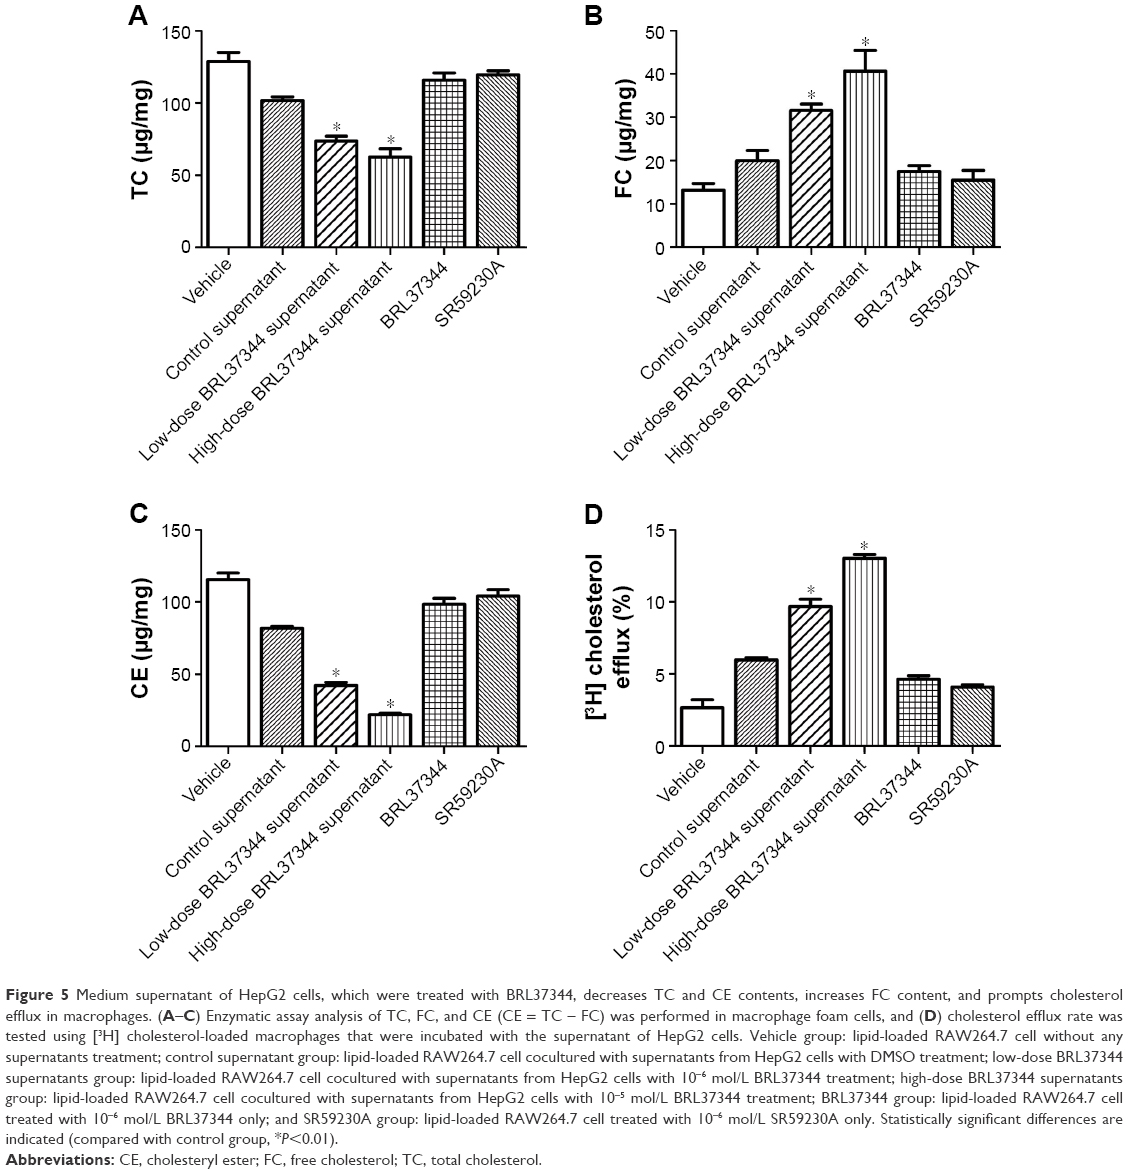 | Figure 5 Medium supernatant of HepG2 cells, which were treated with BRL37344, decreases TC and CE contents, increases FC content, and prompts cholesterol efflux in macrophages. (A–C) Enzymatic assay analysis of TC, FC, and CE (CE = TC – FC) was performed in macrophage foam cells, and (D) cholesterol efflux rate was tested using [3H] cholesterol-loaded macrophages that were incubated with the supernatant of HepG2 cells. Vehicle group: lipid-loaded RAW264.7 cell without any supernatants treatment; control supernatant group: lipid-loaded RAW264.7 cell cocultured with supernatants from HepG2 cells with DMSO treatment; low-dose BRL37344 supernatants group: lipid-loaded RAW264.7 cell cocultured with supernatants from HepG2 cells with 10−6 mol/L BRL37344 treatment; high-dose BRL37344 supernatants group: lipid-loaded RAW264.7 cell cocultured with supernatants from HepG2 cells with 10−5 mol/L BRL37344 treatment; BRL37344 group: lipid-loaded RAW264.7 cell treated with 10−6 mol/L BRL37344 only; and SR59230A group: lipid-loaded RAW264.7 cell treated with 10−6 mol/L SR59230A only. Statistically significant differences are indicated (compared with control group, *P<0.01). |
Effect of HepG2 cell supernatants on the protein expression of ABCA1 and ABCG1 in macrophage foam cells
Results from Western blot showed that treatment with the supernatants of the BRL37344-treated HepG2 cells significantly upregulated ABCA1 protein levels in the lipid-loaded RAW264.7 cells but had no effect on the protein expression of ABCG1. However, again, direct treatment of the lipid-loaded RAW264.7 cells with BRL37344 or SR59230A showed no effect on the protein levels of ABCA1 and ABCG1 (Figure 6).
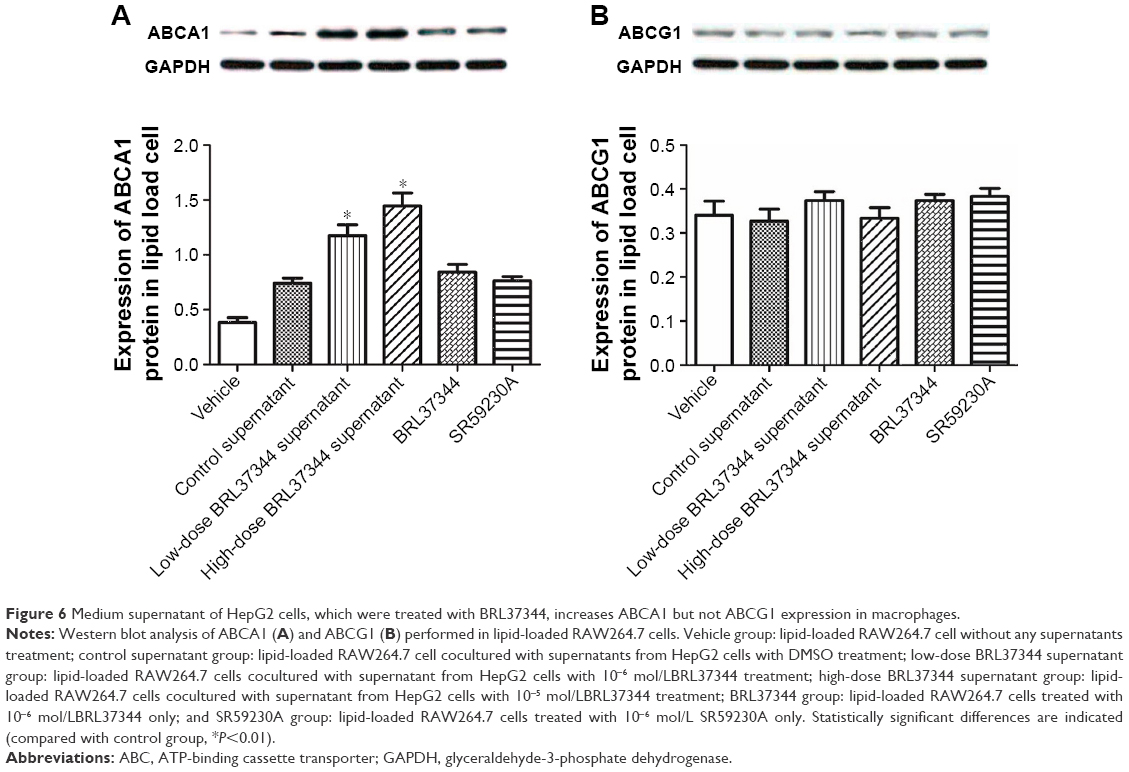 | Figure 6 Medium supernatant of HepG2 cells, which were treated with BRL37344, increases ABCA1 but not ABCG1 expression in macrophages. |
Discussion
β3-AR is considered as a receptor that mediates metabolism in the adipose tissue.15 Previously, Cypess et al16 showed that the RMR in healthy young male subjects with detectable BAT increased by ~13% after acute treatment with high doses of the β3-AR agonist, mirabegron, which suggested that BAT might be activated by the β3-AR agonist. Since β3-AR activation was found to have effect on fat metabolism, we proposed that β3-AR activation might influence lipid metabolism and AS. In recent years, we performed a series of experiments and discovered that a β3-AR agonist impedes the progression of AS in ApoE−/− mice through improvement of lipid and glucose profiles.10,11 Further studies revealed that serum HDL levels in ApoE−/− mice significantly increased after β3-AR activation.11 In this study, we showed that β3-AR activation in HepG2 cells upregulated ApoA-I expression and further promoted the lipid efflux from RAW264.7 macrophage foam cells. Our results indicated that β3-AR activation might play a favorable anti-AS role, which is consistent with our previous studies.
ApoA-I is mainly synthesized in the liver and intestine, is the major component of HDL (~60% of all HDL is ApoA-I), and acts as the main acceptor of cholesterol efflux from cells to HDL.17 Francis et al18 found that lipid-free ApoA-I promotes cholesterol efflux from cells. Increased serum ApoA-I levels in patients with metabolic syndrome can also enhance cholesterol efflux and ameliorate AS development.19 Lipid-free ApoA-I, which is a component of small HDL, is gradually converted into lipid-rich mature and large HDL particles as lipid efflux from cells to ApoA-I and is transported to the liver for further metabolism.20 Therefore, it is important to find an effective approach for increasing endogenous ApoA-I expression in order to promote lipid efflux from macrophages to inhibit foam cell formation and delay the occurrence and development of atherosclerotic lesions. In this study, ApoA-I expression was found to be upregulated after β3-AR activation in HepG2 cells; this result is consistent with the results reported by Shi et al,21 which indicated that treatment with a β3-AR agonist significantly increases ApoA-I concentration in the plasma and ApoA-I mRNA and protein expressions in the liver of ApoE−/− mice.
PPARα/γ belong to the PPAR superfamily and are mainly involved in regulating fat cell differentiation and fat tissue formation. A previous study by Schuster et al22 revealed that tesaglitazar, a dual PPARα/γ agonist, dose-dependently increases the serum concentrations of ApoA-I in subjects with insulin resistance. The presence of a PPRE in site A of the ApoA-I promoter could be the reason for the stimulation of ApoA-I gene transcription upon activation of both PPARα and PPARγ.23 In this study, we found that PPARγ protein levels were significantly increased upon treatment with the β3-AR agonist, BRL37344, but PPARα protein expression was not significantly changed. We also discovered that the increase in ApoA-I expression induced by β3-AR activation was abolished by treatment with a PPARγ antagonist, GW9662, which suggested that the upregulation of ApoA-I in HepG2 cells by β3-AR activation might involve a PPARγ-dependent pathway. Our results are in line with a previous report by Du et al,14 which indicated that activation of PPARγ is required for 4010B-30, a novel molecular upregulator, to induce hepatic ApoA-I gene expression.
ApoA-II is the second most abundant protein in HDL.24 However, so far, studies on the effect of ApoA-II on RCT are few, and the results have been controversial. One previous study by Kido et al showed that ApoA-II might inhibit cholesterol efflux to HDL.25 In contrast, several other studies have shown that ApoA-II might have no influence on RCT.26–28 The results of our present study showed that β3-AR activation can decrease ApoA-II expression. Based on our results for ApoA-I and ApoA-II expressions, we believe that ApoA-I and ApoA-II might play opposite roles in RCT.
The TC content is the sum of the FC and CE in foam cells. FC is the most common form of cholesterol in RCT. The uptake of cholesterol outflow by cells occurs in the form of FC. The inflow and outflow of cell cholesterol are dynamically balanced under physiological conditions, but under some pathological conditions, the uptake of cholesterol into cells exceeds its outflow; the excess FC is then esterified into CE and deposited into cells, which results in foam cell formation.29 In our study, we found that CE was significantly decreased in macrophage foam cells treated with β3-AR-activated HepG2 cell supernatants, and the cholesterol efflux rates were increased. The results suggested that supernatants from β3-AR-activated HepG2 cells could prompt lipid efflux from macrophage foam cells, which increased the FC efflux, decreased the CE content, and prevented foam cell formation.
ABCA1 is a highly conserved transmembrane glycoprotein, which belongs to the ATP-binding cassette transporter protein superfamily. The research by Du et al30 revealed that both lipid-free and poorly lipidated ApoA-I and small HDL particles promote cholesterol efflux in an ABCA1-dependent pathway. Thus, ABCA1 plays an important role in mediating RCT. In the early stages of foam cell formation, ABCA1 expression is upregulated, which, in combination with ApoA-I, mediates cholesterol efflux to maintain intracellular lipid homeostasis.23 However, ABCA1 is downregulated during foam cell formation, which leads to decreased cholesterol efflux. A previous study revealed that binding of ApoA-I to ABCA1 can increase the concentration of ABCA1 in macrophage-derived foam cells, mainly through the prevention of ABCA1 degradation.31,32 A possible mechanism underlying this effect might be that PKC is activated by the interaction of ApoA-I with ABCA1,33 which can further decrease the phosphorylation of threonine residues at 1286 and 1305, a region that directs calpain proteolysis, in ABCA1 and increase its stability.33–35 Apart from this, the activation of PKC can also modulate ABCA1 gene transcription and expression.36 PKC-mediated activation of PI3K and Ras/MAPK pathways35 could also activate PPARα,32 PPARγ,37 and LXR38 through phosphorylation and can further up- or downregulate ABCA1 expression. The binding of ApoA-I to ABCA1 has also been shown to promote cAMP production, thereby activating protein kinase A and further increasing ABCA1 mRNA expression in mouse macrophages.35 Our present study showed that ABCA1 was upregulated in the macrophage foam cells treated with supernatants from the BRL37344 group, which suggested that the increase in ABCA1 might have occurred in an ApoA-I-dependent way and might further promote cholesterol efflux. We also found that the levels of ABCG1 protein were not significantly different between the groups, which suggested that the increase in ApoA-I levels had no influence on ABCG1 levels. Moreover, this result was consistent with the results from previous studies that lipid efflux mediated by ABCG1 is mainly to HDL rather than to ApoA-I.39,40
Conclusion
Our study showed that activation of β3-AR in HepG2 cells can upregulate ApoA-I expression, possibly in a PPARγ-dependent way. This elevated ApoA-I expression, in turn, promotes the cholesterol efflux of macrophage-derived foam cells through an ABCA1-related pathway. However, the precise mechanisms through which β3-AR regulates ApoA-I expression need further investigation and will be evaluated in our future work. One limitation of this study is that the effect of the supernatants from BRL37344-treated HepG2 cells on cholesterol efflux might have been influenced by many other factors in the supernatants; this issue will be addressed in our future research. Based on our current findings, we believe that β3-AR activation can be a potential strategy for use in anti-AS therapies in the future.
Acknowledgments
We are grateful to our colleagues and teachers who generously shared their precious time and knowledge with us, which helped us perform this study. This work was supported by the National Natural Science Foundation of China (grant no 81270380).
Disclosure
The authors report no conflicts of interest in this work.
References
Rosenson RS, Brewer HB Jr, Davidson WS, et al. Cholesterol efflux and atheroprotection: advancing the concept of reverse cholesterol transport. Circulation. 2012;125(15):1905–1919. | ||
Tall AR, Yvan-Charvet L, Wang N. The failure of torcetrapib: was it the molecule or the mechanism? Arterioscler Thromb Vasc Biol. 2007;27(2):257–260. | ||
Schwartz GG, Olsson AG, Abt M, et al. Effects of dalcetrapib in patients with a recent acute coronary syndrome. N Engl J Med. 2012;367(22):2089–2099. | ||
Nissen SE, Tardif JC, Nicholls SJ, et al. Effect of torcetrapib on the progression of coronary atherosclerosis. N Engl J Med. 2007;356(13):1304–1316. | ||
Tomoda H. Dalcetrapib in patients with an acute coronary syndrome. N Engl J Med. 2013;368(9):869. | ||
Kingwell BA, Chapman MJ, Kontush A, Miller NE. HDL-targeted therapies: progress, failures and future. Nat Rev Drug Discov. 2014;13(6):445–464. | ||
Heinecke JW. Small HDL promotes cholesterol efflux by the ABCA1 pathway in macrophages: implications for therapies targeted to HDL. Circ Res. 2015;116(7):1101–1103. | ||
Ursino MG, Vasina V, Raschi E, Crema F, De Ponti F. The beta3-adrenoceptor as a therapeutic target: current perspectives. Pharmacol Res. 2009;59(4):221–234. | ||
Sakane N, Sato J, Tsushita K, et al. Effects of lifestyle intervention on weight and metabolic parameters in patients with impaired glucose tolerance related to beta-3 adrenergic receptor gene polymorphism Trp64Arg(C/T): results from the Japan Diabetes Prevention Program. J Diabetes Investig. 2016;7(3):338–342. | ||
Wang ZH, Li YF, Guo YQ. Beta3-Adrenoceptor activation attenuates atherosclerotic plaque formation in ApoE(−/−) mice through lowering blood lipids and glucose. Acta Pharmacol Sin. 2013;34(9):1156–1163. | ||
Guo YQ, Li YF, Wang ZH. Effects of beta(3)-adrenoceptor on scavenger receptor class B type 1 and its signal transduction pathway in apolipoprotein E knockout mice. Eur J Pharmacol. 2013;714(1–3):295–302. | ||
Jin FY, Kamanna VS, Chuang MY, Morgan K, Kashyap ML. Gemfibrozil stimulates apolipoprotein A-I synthesis and secretion by stabilization of mRNA transcripts in human hepatoblastoma cell line (Hep G2). Arterioscler Thromb Vasc Biol. 1996;16(8):1052–1062. | ||
Liu C, Guo Q, Lu M, et al. An experimental study on amelioration of dyslipidemia-induced atherosclesis by Clematichinenoside through regulating Peroxisome proliferator-activated receptor-alpha mediated apolipoprotein A-I, A-II and C-III. Eur J Pharmacol. 2015;761:362–374. | ||
Du Y, Wang L, Si S, et al. A novel compound 4010B-30 upregulates apolipoprotein A-I gene expression through activation of PPARgamma in HepG2 cells. Atherosclerosis. 2015;239(2):589–598. | ||
Dessy C, Balligand JL. Beta3-adrenergic receptors in cardiac and vascular tissues emerging concepts and therapeutic perspectives. Adv Pharmacol. 2010;59:135–163. | ||
Cypess AM, Weiner LS, Roberts-Toler C, et al. Activation of human brown adipose tissue by a beta3-adrenergic receptor agonist. Cell Metab. 2015;21(1):33–38. | ||
Castellani LW, Lusis AJ. ApoA-II versus ApoA-I: two for one is not always a good deal. Arterioscler Thromb Vasc Biol. 2001;21(12):1870–1872. | ||
Francis GA, Knopp RH, Oram JF. Defective removal of cellular cholesterol and phospholipids by apolipoprotein A-I in Tangier disease. J Clin Invest. 1995;96(1):78–87. | ||
Khera AV, Millar JS, Ruotolo G, et al. Potent peroxisome proliferator-activated receptor-alpha agonist treatment increases cholesterol efflux capacity in humans with the metabolic syndrome. Eur Heart J. 2015;36(43):3020–3022. | ||
Phillips MC. Molecular mechanisms of cellular cholesterol efflux. J Biol Chem. 2014;289(35):24020–24029. | ||
Shi ST, Li YF, Guo YQ, et al. Effect of beta-3 adrenoceptor stimulation on the levels of ApoA-I, PPARalpha, and PPARgamma in apolipoprotein E-deficient mice. J Cardiovasc Pharmacol. 2014;64(5):407–411. | ||
Schuster H, Fagerberg B, Edwards S, et al. Tesaglitazar, a dual peroxisome proliferator-activated receptor alpha/gamma agonist, improves apolipoprotein levels in non-diabetic subjects with insulin resistance. Atherosclerosis. 2008;197(1):355–362. | ||
Zhang LH, Kamanna VS, Ganji SH, Xiong XM, Kashyap ML. Pioglitazone increases apolipoprotein A-I production by directly enhancing PPRE-dependent transcription in HepG2 cells. J Lipid Res. 2010;51(8):2211–2222. | ||
Hedrick CC, Castellani LW, Wong H, Lusis AJ. In vivo interactions of apoA-II, apoA-I, and hepatic lipase contributing to HDL structure and antiatherogenic functions. J Lipid Res. 2001;42(4):563–570. | ||
Kido T, Kurata H, Kondo K, et al. Bioinformatic analysis of plasma apolipoproteins A-I and A-II revealed unique features of A-I/A-II HDL particles in human plasma. Sci Rep. 2016;6:31532. | ||
Fazio S, Pamir NHDL. Particle size and functional heterogeneity. Circ Res. 2016;119(6):704–707. | ||
Pownall HJ, Gillard BK, Gotto AM Jr. Setting the course for apoAII: a port in sight? Clin Lipidol. 2013;8(5):551–560. | ||
Qin S, Koga T, Ganji SH, Kamanna VS, Kashyap ML. Rosuvastatin selectively stimulates apolipoprotein A-I but not apolipoprotein A-II synthesis in Hep G2 cells. Metabolism. 2008;57(7):973–979. | ||
Yu XH, Fu YC, Zhang DW, Yin K, Tang CK. Foam cells in atherosclerosis. Clin Chim Acta. 2013;424:245–252. | ||
Du XM, Kim MJ, Hou L, et al. HDL particle size is a critical determinant of ABCA1-mediated macrophage cellular cholesterol export. Circ Res. 2015;116(7):1133–1142. | ||
Chen W, Wang N, Tall AR. A PEST deletion mutant of ABCA1 shows impaired internalization and defective cholesterol efflux from late endosomes. J Biol Chem. 2005;280(32):29277–29281. | ||
Mulay V, Wood P, Manetsch M, et al. Inhibition of mitogen-activated protein kinase Erk1/2 promotes protein degradation of ATP binding cassette transporters A1 and G1 in CHO and HuH7 cells. PLoS One. 2013;8(4):e62667. | ||
Yamauchi Y, Hayashi M, Abe-Dohmae S, Yokoyama S. Apolipoprotein A-I activates protein kinase C alpha signaling to phosphorylate and stabilize ATP binding cassette transporter A1 for the high density lipoprotein assembly. J Biol Chem. 2003;278(48):47890–47897. | ||
Martinez LO, Agerholm-Larsen B, Wang N, Chen W, Tall AR. Phosphorylation of a pest sequence in ABCA1 promotes calpain degradation and is reversed by ApoA-I. J Biol Chem. 2003;278(39):37368–37374. | ||
Mulay V, Wood P, Rentero C, Enrich C, Grewal T. Signal transduction pathways provide opportunities to enhance HDL and apoAI-dependent reverse cholesterol transport. Curr Pharm Biotechnol. 2012;13(2):352–364. | ||
Mineo C, Shaul PW. Regulation of signal transduction by HDL. J Lipid Res. 2013;54(9):2315–2324. | ||
Mogilenko DA, Shavva VS, Dizhe EB, et al. PPARgamma activates ABCA1 gene transcription but reduces the level of ABCA1 protein in HepG2 cells. Biochem Biophys Res Commun. 2010;402(3):477–482. | ||
Zhang L, Jiang M, Shui Y, et al. DNA topoisomerase II inhibitors induce macrophage ABCA1 expression and cholesterol efflux-an LXR-dependent mechanism. Biochim Biophys Acta. 2013;1831(6):1134–1145. | ||
Wang N, Lan D, Chen W, Matsuura F, Tall AR. ATP-binding cassette transporters G1 and G4 mediate cellular cholesterol efflux to high-density lipoproteins. Proc Natl Acad Sci U S A. 2004;101(26):9774–9779. | ||
Kennedy MA, Barrera GC, Nakamura K, et al. ABCG1 has a critical role in mediating cholesterol efflux to HDL and preventing cellular lipid accumulation. Cell Metab. 2005;1(2):121–131. |
 © 2017 The Author(s). This work is published and licensed by Dove Medical Press Limited. The
full terms of this license are available at https://www.dovepress.com/terms
and incorporate the Creative Commons Attribution
- Non Commercial (unported, 3.0) License.
By accessing the work you hereby accept the Terms. Non-commercial uses of the work are permitted
without any further permission from Dove Medical Press Limited, provided the work is properly
attributed. For permission for commercial use of this work, please see paragraphs 4.2 and 5 of our Terms.
© 2017 The Author(s). This work is published and licensed by Dove Medical Press Limited. The
full terms of this license are available at https://www.dovepress.com/terms
and incorporate the Creative Commons Attribution
- Non Commercial (unported, 3.0) License.
By accessing the work you hereby accept the Terms. Non-commercial uses of the work are permitted
without any further permission from Dove Medical Press Limited, provided the work is properly
attributed. For permission for commercial use of this work, please see paragraphs 4.2 and 5 of our Terms.