Back to Journals » Journal of Inflammation Research » Volume 19
Berberine Ameliorates Diabetic Kidney Disease by Modulating Macrophage Polarization via Inhibiting IL-17A Signaling
Authors Fan J ![]() , Liu Y
, Liu Y ![]() , Zheng C
, Zheng C ![]() , Liu J
, Liu J ![]() , Liu W
, Liu W ![]() , Geng R
, Geng R ![]() , Zhao A
, Zhao A ![]() , Wang Y
, Wang Y ![]() , Wang R
, Wang R ![]() , Qi Z
, Qi Z ![]()
Received 18 November 2025
Accepted for publication 24 February 2026
Published 3 March 2026 Volume 2026:19 580534
DOI https://doi.org/10.2147/JIR.S580534
Checked for plagiarism Yes
Review by Single anonymous peer review
Peer reviewer comments 3
Editor who approved publication: Dr Wenjian Li
Jingna Fan,1 Yuan Liu,1 Canlei Zheng,1 Jiahui Liu,1 Wennuan Liu,1 Ruibin Geng,1 Aoxue Zhao,1 Yuhang Wang,1 Rong Wang,1,* Zhenqiang Qi2,*
1School of Integrated Traditional Chinese and Western Medicine, Jining Medical University, Jining, Shandong, 272067, People’s Republic of China; 2Jining NO.1 People’s Hospital, Jining, Shandong, 272011, People’s Republic of China
*These authors contributed equally to this work
Correspondence: Rong Wang; Zhenqiang Qi, Email [email protected]; [email protected]
Objective: This study aimed to elucidate the molecular mechanisms of berberine (BBR) in ameliorating diabetic kidney disease (DKD), focusing on its regulatory effects on the renal immune microenvironment and macrophage polarization.
Methods: We first employed a network pharmacology approach, integrating public transcriptomic data with drug target databases, to predict the core pathways and immune regulatory mechanisms of BBR in DKD. To experimentally validate these in silico predictions, we assessed the effects of BBR on apoptosis, fibrosis, and inflammation in a high-glucose-induced renal tubular epithelial cell (NRK-52E) model. Finally, a DKD rat model was established to confirm the therapeutic efficacy in vivo and to mechanistically investigate BBR’s impact on renal macrophage polarization and the key signaling proteins of the predicted pathway.
Results: Network pharmacology and transcriptomic analysis identified 55 core genes of BBR in DKD, enriched in apoptosis, metabolism, oxidative stress, and inflammation, with immune infiltration implicating T cells, B cells, and macrophage subsets. In vitro, BBR enhanced viability of high-glucose–injured NRK-52E cells, suppressed apoptosis and fibrosis markers, and reduced IL-6, IL-17A, and TNF-α levels. In vivo, BBR reduced hyperglycemia, preserved renal function, attenuated fibrosis, and rebalanced macrophage polarization by inhibiting M1 while promoting M2 phenotypes. Mechanistically, these effects were associated with downregulation of the IL17A/TRAF6/MAPK14 pathway.
Conclusion: Berberine alleviates diabetic kidney disease by regulating macrophage polarization via inhibition of the IL17A/TRAF6/MAPK14 signaling pathway, underscoring its therapeutic potential as an anti-inflammatory and anti-fibrotic agent.
Keywords: diabetic kidney disease, berberine, bioinformatics, macrophage polarization, inflammation and fibrosis
Introduction
Diabetic Kidney Disease (DKD), a major chronic complication of diabetes, is a leading cause of End-Stage Renal Disease (ESRD) globally.1 It features proteinuria, glomerulosclerosis, and progressive kidney dysfunction. With the growing prevalence of type 2 diabetes and aging-related comorbidities such as vascular lesions, insulin resistance, and obesity, DKD poses an increasing threat to public health and a substantial socioeconomic burden.2 Despite the widespread clinical application of first-line therapeutic regimens, including intensive management of blood glucose, lipids, and blood pressure along with renin-angiotensin system inhibitors (RASI), the risk of Diabetic Kidney Disease (DKD) progression remains uncontrolled.3,4 This is primarily attributable to the complexity of its pathogenic mechanisms. Consequently, building upon existing treatments, in-depth exploration and targeting of these potential, non-canonical pathogenic mechanisms are crucial for developing novel therapeutic strategies capable of providing additional renal protection.
Coptis chinensis Franch, known as Rhizoma Coptidis in traditional Chinese medicine, is traditionally used for “Xiaoke” (diabetes) treatments, as documented in the Compendium of Materia Medica. Berberine (BBR), a primary bioactive isoquinoline alkaloid, demonstrates a range of pharmacological properties, such as improving metabolic disorders (eg, hypoglycemic and lipid-regulating effects), anti-inflammatory, anti-fibrotic, and immunomodulatory activities.5–10 Given its natural origin and favorable safety profile, BBR has emerged as a promising therapeutic candidate for a spectrum of conditions, including metabolic syndrome, diabetes, cardiovascular and renal diseases, and even cancer.5–11 Both clinical and experimental researches suggest that BBR improves glucose and lipid metabolism, reduces proteinuria, and alleviates renal inflammation and fibrosis in DKD.10 Given that chronic low-grade inflammation triggered by immune cell infiltration is a central hallmark of DKD pathogenesis,12 the potent anti-inflammatory and immunoregulatory properties of BBR highlight its potential as an attractive therapeutic strategy targeting the immune component13 of this disease.
Macrophages are abundant innate immune cells in renal tissue and and pivotal mediators of DKD-related inflammation and fibrosis.14 The balance between M1 macrophages that contribute to inflammation and kidney damage, and M2 macrophages that assist in tissue repair, plays a vital role in determining the disease outcome.15–19 Although previous studies have established that BBR inhibits M1 polarization in othercontexts, its precise role in regulating macrophage phenotype within the unique metabolic and inflammatory milieu of DKD remains largely undefined.20 Crucially, the key upstream signaling pathways that mediate BBR’s potential effects on macrophage polarization in this disease are yet to be identified.
To address this knowledge gap, our study integrates comprehensive bioinformatic analyses with experimental validation. By leveraging public transcriptomic data and combining it with in vitro and in vivo models, we aimed to systematically uncover the mechanisms of BBR in DKD. We hypothesize that BBR alleviates DKD by rebalancing macrophage polarization, and we sought to identify and validate the core signaling cascade—specifically the IL17A/TRAF6/MAPK14 pathway—that governs this process.
Methods
Bioinformatics Analysis
Acquisition of Drug Target Gene Datasets
The molecular structure, standard SMILES notation, and CAS number of BBR were retrieved from the PubChem database (https://pubchem.ncbi.nlm.nih.gov/). Potential drug-related targets (DRTs) were obtained from TCMSP (http://tcmspw.com/tcmsp.php), SwissTargetPrediction (http://www.swisstargetprediction.ch/), CTD (http://ctdbase.org/), and STITCH (http://stitch.embl.de). All target genes were standardized using the UniProt database (http://www.uniprot.org). The “venn” package in R software (4.2.1) was employed to find common targets across multiple databases. Functional enrichment analysis of the differentially regulated transcripts (DRTs) was performed for both Gene Ontology (GO) terms and Kyoto Encyclopedia of Genes and Genomes (KEGG) pathways utilizing the “clusterProfiler” and “org.Hs.egdb” packages in R.
Identification of Differentially Expressed Genes (DEGs) in DKD
Gene expression profiles from 27 renal biopsy samples of DKD patients and 9 normal renal biopsy samples were obtained from the GSE142025 dataset in the GEO database.21 The raw dataset underwent rigorous preprocessing and normalization prior to conducting differential expression analysis via the limma package in R. Genes were classified as significantly differentially expressed if they showed an absolute log2(Fold Change) greater than 1 and a p-value less than 0.05. Heatmaps and volcano plots were created with the pheatmap and ggplot2 packages, respectively, while ridge plots of the top 20 DEGs were created using the RidgePlot function. To pinpoint the biological processes and pathways that showed significant enrichment, we employed the clusterProfiler package for gene set enrichment analysis. In this analysis, we considered findings statistically meaningful when they exhibited an absolute normalized enrichment score exceeding 1 and achieved a nominal p-value below 0.05.
Weighted Gene Co-Expression Network Analysis (WGCNA)
From the GSE142025 dataset, the 5000 genes exhibiting the highest variance were selected to develop a gene co-expression network using R’s WGCNA package. Samples were grouped by expression profiles, with Pearson correlation coefficients computed for all gene pairs. A soft-thresholding power was determined by performing gradient testing across power values (range: 1–30) to achieve a scale-free topology fit index of >0.90. Subsequently, a hierarchical clustering algorithm was applied to identify co-expression modules. Genes exhibiting strong module membership (MM > 0.8) and significant gene relevance (GS > 0.25) were classified as hub genes. Genes present in both the significant WGCNA modules and the DEG list were considered key DKD-related target genes. DAVID (version 7.0) was utilized for GO and KEGG analyses of these pivotal genes, applying a p-value cutoff of <0.05 for significance.
Construction of Protein-Protein Interaction (PPI) Networks
A protein-protein interaction (PPI) network was mapped by leveraging the STRING database (https://cn.string-db.org/) to analyze the overlapping genes between WGCNA modules and DEGs. This network was then imported into Cytoscape software for visualization and cluster analysis using the MCODE plugin. The highest-scoring cluster was designated as the key gene module, followed by GO and KEGG enrichment analyses targeting its constituent genes.
Identification of Differentially Expressed Key Cluster Genes in DKD versus Normal Tissues
The expression patterns of genes within the key cluster were analyzed in the GSE142025 dataset using the limma package in R. We performed a receiver operating characteristic (ROC) curve analysis to assess the diagnostic value, and the area under the curve (AUC) was computed as a quantitative measure of performance. Genes with an AUC ≥ 0.80 and p < 0.0522 were identified as core genes capable of effectively distinguishing DKD from controls, indicating strong specificity and sensitivity.
Immune Cell Infiltration Analysis
The “CIBERSORT” package in R was employed to estimate the relative proportions of infiltrating immune cells. Spearman correlation was calculated to determine the associations between immune cell types, with the findings depicted through heatmap imagery. Immune cell infiltration differences between DKD and control groups were assessed via Wilcoxon test, with significance determined at p < 0.05.
Molecular Docking
Protein structures were preprocessed using PyMol 2.5.2 by adding hydrogen atoms and removing water and ligand molecules. Docking grids were defined to encapsulate the active site of the target proteins. The ADFRsuite 1.0 was used to convert the PDB structures of small molecules and receptor proteins into PDBQT format. The conformation with the highest predicted affinity was identified as the most accurate model and subsequently visualized using PyMol 2.5.2 for structural analysis.
In vitro Experiments
Cell Culture and Viability Analysis
NRK-52E cells (Guangzhou Cellcook Biotech Co., Ltd.), a rat renal tubular epithelial cell line, were maintained in DMEM medium supplemented with 10% fetal bovine serum at 37°C under 5% CO2 conditions. Cell viability was assessed using the Cell Counting Kit-8 (CCK-8) assay (Dojindo, Japan, Lot. PF724). To develop the hyperglycemic injury model, cells cultured in 96-well plates (5×10⁴cells/well) were exposed to increasing glucose levels (10, 20, 30, 40, 50 mmol/L) over 24 hours. The control group received normal glucose (5.5 mmol/L). Following the treatment, cell viability was determined using a Cell Counting Kit-8 (CCK-8) in accordance with the manufacturer’s instructions. Briefly, 10μL of CCK-8 solution was added to each well, and the plates were incubated at 37°C for 1.5 hours before the optical density at 450 nm was measured. To evaluate the effect of BBR, high-glucose-injured cells were treated with BBR (0.1, 0.5, 1, 3, 6, 12, or 20 μmol/L) or valsartan (10 μmol/L) for 24 h, with the high-glucose group serving as the model control.
Cell Apoptosis Detection
We assigned cells to six groups: control, model, low-, medium-, and high-dose BBR groups, and a valsartan (10 μmol/L) group. The extent of apoptosis was quantified utilizing an Annexin V-FITC/PI apoptosis detection kit (KGA1102-50, KeyGen Biotech). Following the experimental procedure, cells were harvested and subjected to three sequential washes with PBS prior to being resuspended in binding buffer. Next, a solution containing 5 μL of Annexin V-FITC combined with 10 μL of propidium iodide (PI) was introduced to 200 µL of the cell suspension. This preparation was then left to incubate away from light for 10 minutes before undergoing analysis by flow cytometry (Beckman Coulter, California, USA).
Immunofluorescence Analysis
The cells were first introduced into 6-well culture plates, and following the experimental treatment, they were harvested and rinsed thoroughly with PBS solution. Subsequently, the samples underwent fixation using 4% paraformaldehyde, followed by permeabilization with Triton X-100, and finally blocked with 2% BSA, all procedures being carried out at ambient temperature. Subsequently, cells were incubated with primary antibodies against Collagen I (Proteintech, 14695-1-AP, 1:500), ɑ-SMA (Proteintech, 14395-1-AP, 1:2000), and E-cadherin (Proteintech, 20874-1-AP, 1:500) for 2 hours at room temperature. After the initial incubation with primary antibodies, the cells were exposed to Cy3-labeled secondary antibodies at a dilution of 1:500 alongside DAPI for one hour under ambient conditions and shielded from light. Following a PBS rinse, the specimens were preserved with anti-fade mounting medium and visualized via fluorescence microscopy. Quantitative analysis of relative fluorescence intensity was subsequently performed utilizing Image J software.
Animal Experiments
Animals and DKD Model Establishment
Seventy Sprague Dawley rats, aged 8 weeks and weighing 200 ± 20 g, underwent a one-week acclimation period and were then randomly allocated to a control group (n = 8) and a model-induction group (n = 62) using a random number tableThroughout the four-week experimental period, the control rats were maintained on a standard diet, whereas those in the model-induction group were maintained on a high-fat, high-sugar diet procured from Jinan Pengyue Experimental Animal Breeding Co., Ltd. After a 12h fast with free access to water, model-induction rats received an intraperitoneal injection of 1% streptozotocin (STZ, 35 mg/kg; Solarbio, Lot No. 1018K0212). Seventy-two hours afterward, blood samples were drawn from the tail vein to assess glucose concentrations. Rodents that registered blood sugar levels of 16.7 mmol/L or higher on two separate occasions were classified as diabetic and maintained on the high-fat, high-sugar diet for another six weeks. The animals were housed in the Animal Experiment Center of Jining Medical University under controlled conditions of 50%±10% relative humidity and a temperature of 23±2 with a 12/12-hour light/dark cycle. They had free access to food and water.
Experimental Groups and Treatment
Out of 62 rats in the model-induction group, 42 rats successfully developed DKD (defined as blood glucose ≥ 16.7 mmol/L and 24 h urinary protein excretion ≥ 30 mg), from which 40 were randomly divided into five groups (n = 8 per group): model group, low-dose BBR (50 mg/kg, Solarbio, Lot No. SB8130) group, medium-dose BBR (100 mg/kg) group, high-dose BBR (200 mg/kg) group, and valsartan (10 μmol/L) positive control group (7.18 mg/kg, Novartis, Batch No. X3250). Cage placement was randomized and rotated weekly to control for any environmental gradients on the racks. Over the course of an eight-week trial, both the control and the model groups were administered an identical daily dose of regular saline. Their body weights and fasting blood glucose readings were meticulously recorded at the onset (week 0), at the half-way mark (week 4), and at the end (week 8) to track any physiological shifts.
Sample Collection and Biochemical Analysis
Once the experimental intervention ended, the rats were rendered unconscious through intraperitoneal administration of sodium pentobarbital. Blood samples were then drawn from the abdominal aorta, spun in a centrifuge to separate the serum, and subsequently examined for urea nitrogen and creatinine concentrations with commercially available testing kits, following the protocols provided by the manufacturers. Urine specimens were gathered over a 24-hour period from animals housed in metabolic cages, and the total daily protein output in urine was assessed. Furthermore, serum concentrations of IL-6, TNF-α, and IL-10 were determined by employing enzyme-linked immunosorbent assay (ELISA) kits (Jiangsu Meimian Industrial Co., Ltd.MM-0190R1, MM-0180R1, MM-0195R1), strictly adhering to the protocols provided by the manufacturers. All outcome assessments were performed by research personnel who were blinded to the group allocation. Data analysts also remained blinded to the group assignments until all statistical analyses were completed. At the end of the experiment, the animals were euthanized via an intraperitoneal overdose injection of pentobarbital sodium.
Histopathological and Immunofluorescence
For histopathological analysis, kidney were harvested, fixed in a 4% paraformaldehyde, dehydrated, embedded in paraffin, and sectioned. Tissue sections were stained with hematoxylin and eosin (HE), Masson’s trichrome, and periodic acid–Schiff (PAS) for evaluation of renal injury and fibrosis.
To assess macrophage polarization, kidney tissues were further subjected to immunofluorescence staining. In short, tissue samples underwent permeabilization using a 0.1% Triton X-100 solution for ten minutes, followed by a two-hour blocking step with 10% goat serum at ambient temperature. Subsequently, the specimens were subjected to an overnight incubation at 4 degrees Celsius with primary antibodies, including iNOS antibody (abcam, ab178945, 1:400), CD86 antibody (abcam, ab239075, 1:400), Arg-1 antibody (abcam, ab239731, 1:400), and CD163 antibody (abcam, ab316218, 1:500). Following a PBS rinse, the tissue samples were treated with either Alexa Fluor 488-conjugated goat anti-rabbit IgG (Invitrogen, A-11034, diluted 1:200) or Alexa Fluor 594-tagged goat anti-mouse IgG (Invitrogen, A-11005, diluted 1:100) for one hour under ambient conditions. Subsequently, the nuclei were counterstained with DAPI. Following the staining process, the nuclei were treated with DAPI as a counterstain. Once fully prepared, the tissue sections were affixed to slides using an anti-fade mounting solution before being examined under a fluorescence microscope to quantify the fluorescence intensity.
Molecular Biology Experiments
Real-Time Quantitative PCR (RT-qPCR)
Total cellular RNA was isolated using the Total RNA Extraction Kit (TIANGEN, DP451, China). The concentration and purity of the RNA were measured with a NanoDrop 2000 spectrophotometer (Thermo Scientific, USA). Subsequently, the relative mRNA expression levels of a panel of genes (FOXO1, MAPK3, JUN, PTGS2, AKT1, VEGFA, SIRT1, CDK4, TP53, FOS, MMP2, MAPK14, EGF, EGR1, RPS6KB1) were assessed. cDNA was synthesized from total RNA using primers and the HiScript III qRT SuperMix (Vazyme, Nanjing, China, Cat# R323). Quantitative PCR (qPCR) amplification was performed using a SYBR Green (Vazyme, Nanjing, China, Cat# Q711) reaction system under the following cycling conditions: initial denaturation at 95°C for 30s; 40 cycles of denaturation at 95°C for 10s, annealing at 60°C for 30s, and extension at 72 °C for 20s. A melting curve analysis was carried out following the amplification cycles to verify amplification specificity. The relative expression levels were calculated using the 2−ΔΔCt method, with β-actin (ACTB) serving as the internal reference gene. All primers were synthesized by Sangon Biotech (Shanghai) Co., Ltd., and their sequences are provided in Table 1.
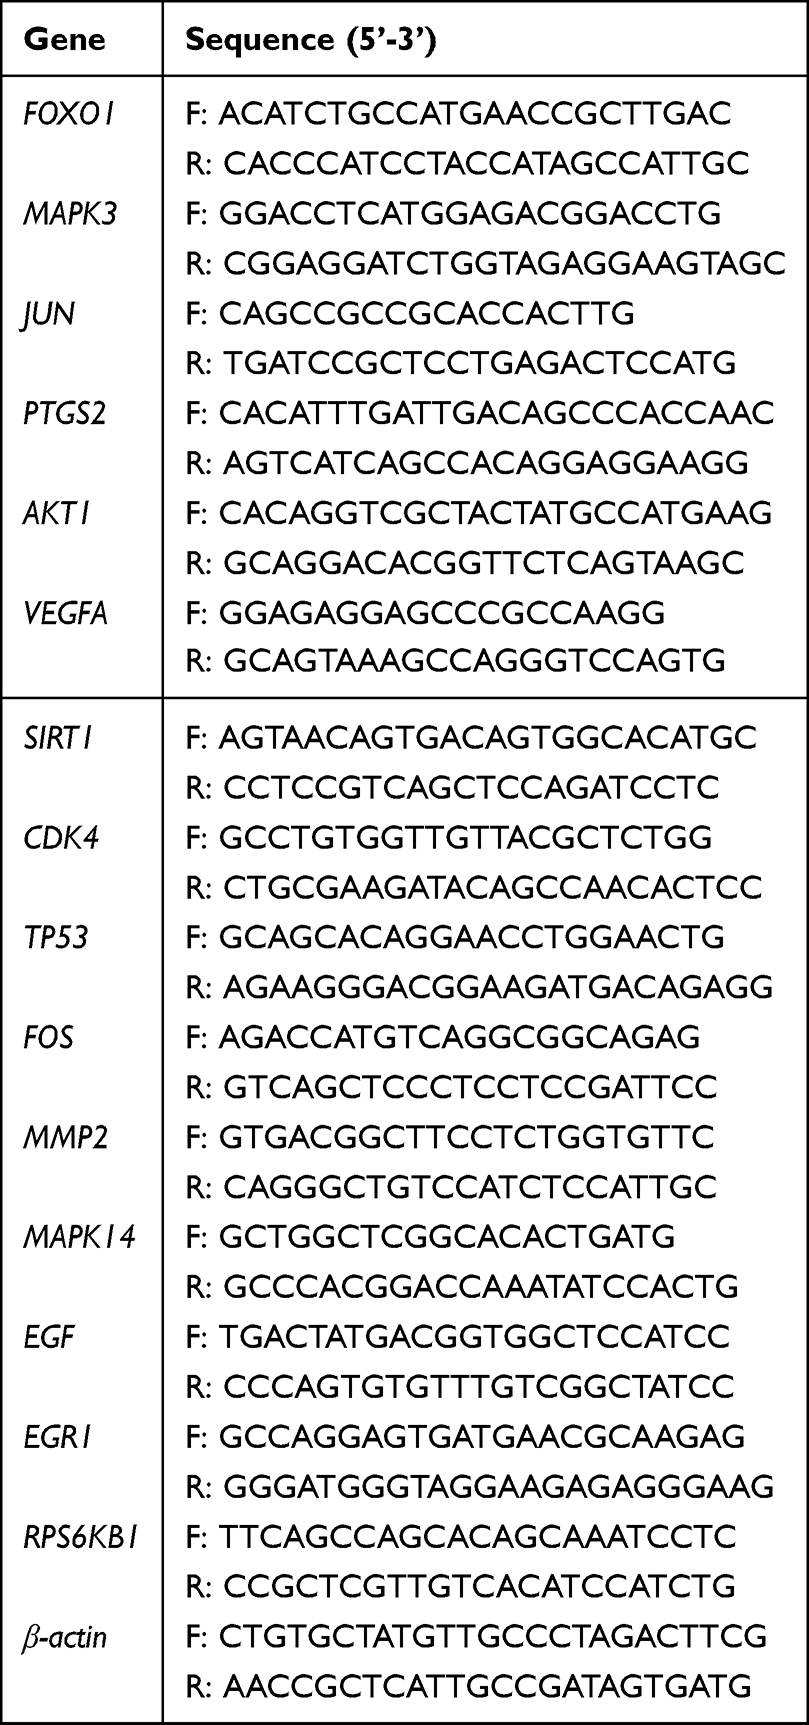 |
Table 1 Primer Sequences Used for RT-qPCR |
Western Blot (WB) Detection
Following extraction with RIPA lysis buffer from the kidney tissues and NRK-52E cells of each group, total protein concentrations were quantified by the BCA method. Following denaturation, the samples underwent separation via SDS-PAGE before being transferred onto PVDF membranes, which were then blocked to prepare for analysis. These membranes were subsequently incubated overnight at 4°C with primary antibodies specifically targeting IL17A (Proteintech, 26163-1-AP, 1:3000), MCP-1 (Proteintech, 26161-1-AP, 1:2000), MMP9 (Proteintech, 10375-2-AP, 1:3000), TRAF6 (ABclonal, A23385, 1:10,000), MAPK14 (Proteintech, 14064-1-AP, 1:10,000), p-MAPK14 (Proteintech, 28796-1-AP, 1:3000), Caspase-3 (Proteintech, 19677-1-AP, 1:3000), Bcl-2 (Proteintech, 26593-1-AP, 1:3000), and Bax (Proteintech, 50599-2-lg, 1:10,000). Post-TBST washing, the membranes were exposed to a room-temperature incubation with an HRP-linked secondary antibody specific to rabbit IgG (Affinity, G-21234, 1:5000) for an hour. Subsequently, protein patterns were illuminated via chemiluminescence, and their brightness was measured using ImageJ software.
Enzyme-Linked Immunosorbent Assay (ELISA)
After the cells were plated in 24-well plates and subjected to experimental treatments, the culture supernatants were collected by centrifugation at 3000rpm for 10 minutes. The concentrations of inflammatory cytokines IL-6, IL-17A, and TNF-α in the supernatants were measured using commercial ELISA kits (Jiangsu Meimian Industrial Co., Ltd.MM-0190R1, MM-70049R1, MM-0180R1) in strict accordance with the manufacturer’s protocols. The absorbance at 450 nm was read with a microplate reader (Bio-Rad, USA), and the cytokine concentrations were calculated based on the standard curve.
Statistical Analysis
All statistical computations were carried out using SPSS version 23.0, while data visualization was accomplished with GraphPad Prism 10.0. The results have been expressed as mean values accompanied by standard deviation (SD). The researchers evaluated whether the data followed a normal distribution and whether variances were homogeneous through application of the Shapiro–Wilk and Levene tests, respectively. Upon confirmation of these assumptions, one-way ANOVA was conducted, succeeded by the least significant difference (LSD) post hoc analysis. In cases where assumptions were violated, non-parametric rank-sum tests were utilized as alternatives. Statistical significance was defined as p < 0.05.
Results
Bioinformatic Analysis Reveals Immune Regulation as a Core Mechanism of BBR in DKD
BBR Targets and DKD Pathogenesis Converge on Immune and Inflammatory Pathways
To systematically uncover the mechanisms of BBR in DKD, we initiated a network pharmacology analysis. A total of 381 potential targets of BBR were identified from four public databases (Figure 1A). Functional enrichment analysis revealed that these targets were significantly associated with metabolic processes, oxidative stress responses, and inflammatory signaling pathways, including the PI3K-Akt, AGE-RAGE, and FoxO pathways (Figures 1B–F). Our functional enrichment analysis demonstrated that these target genes showed strong connections to metabolic activities, oxidative stress management, and inflammatory signaling cascades, particularly the PI3K-Akt, AGE-RAGE, and FoxO pathways (Figures 1B–F). Concurrently, we delved into the renal transcriptome of DKD patients, as represented in the dataset GSE142025, and pinpointed 1164 genes exhibiting altered expression levels—the so-called differentially expressed genes (DEGs). Of these, 659 were upregulated and 505 were downregulated, when juxtaposed with healthy subjects (refer to Figures 2A–E). A closer look through Gene Set Enrichment Analysis (GSEA) revealed that the upregulated DEGs primarily clustered in immune-related pathways, such as allograft rejection and autoimmune thyroid disease. Conversely, the downregulated genes tended to be involved in metabolic processes (see Figure 2F). This convergence suggested that BBR’s therapeutic potential in DKD likely involves the modulation of a dysregulated immune-metabolic axis.
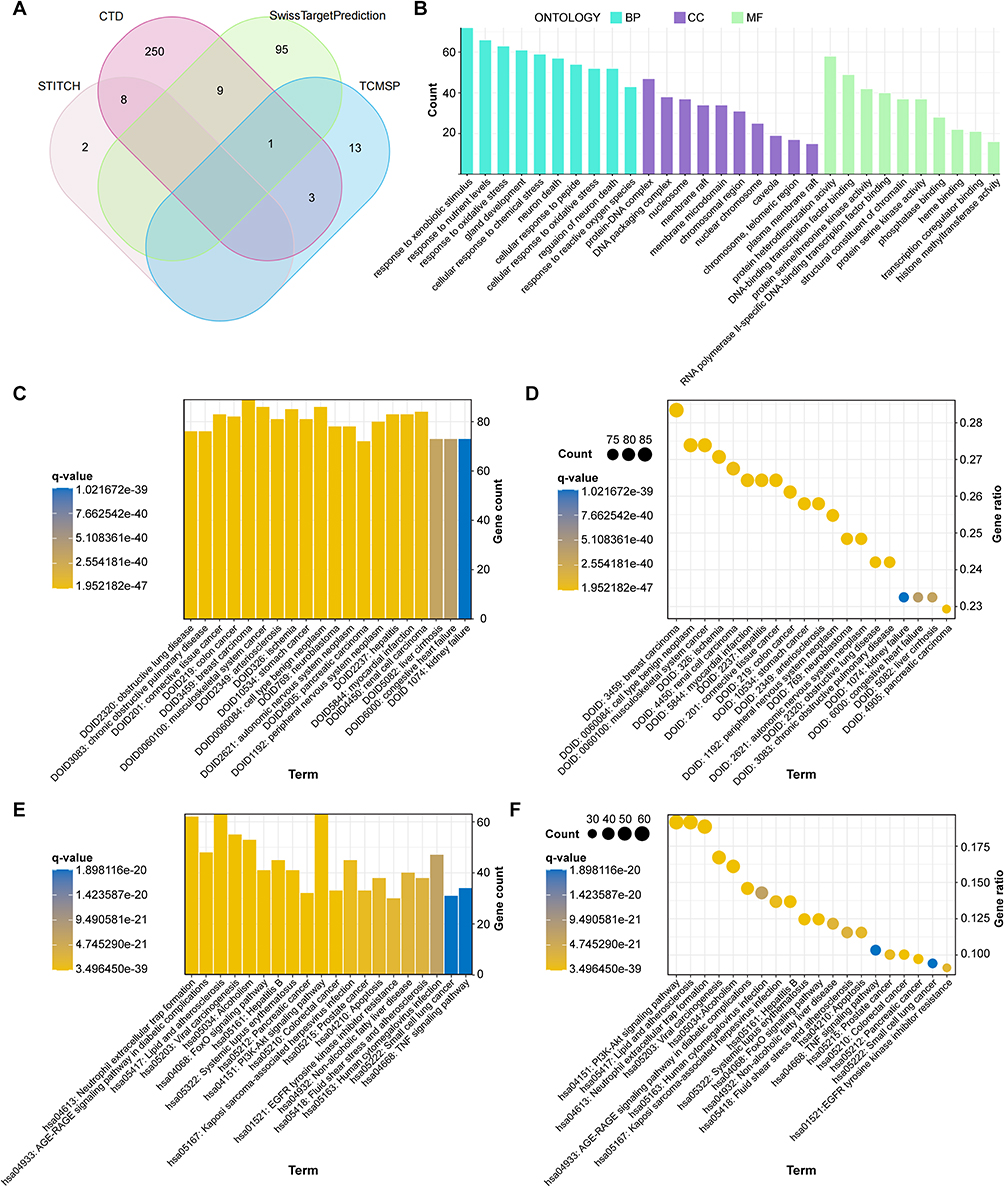 |
Figure 1 Identification and functional enrichment of BBR target genes. (A) Venn diagram showing the overlap of predicted BBR targets obtained from the SwissTargetPrediction, TCMSP, CTD, and STITCH databases. (B) GO enrichment analysis of BBR targets. (C) Bar plot and (D) dot plot presenting the top enriched DO terms. (E) Bar plot and (F) dot plot illustrating the top enriched KEGG pathways. |
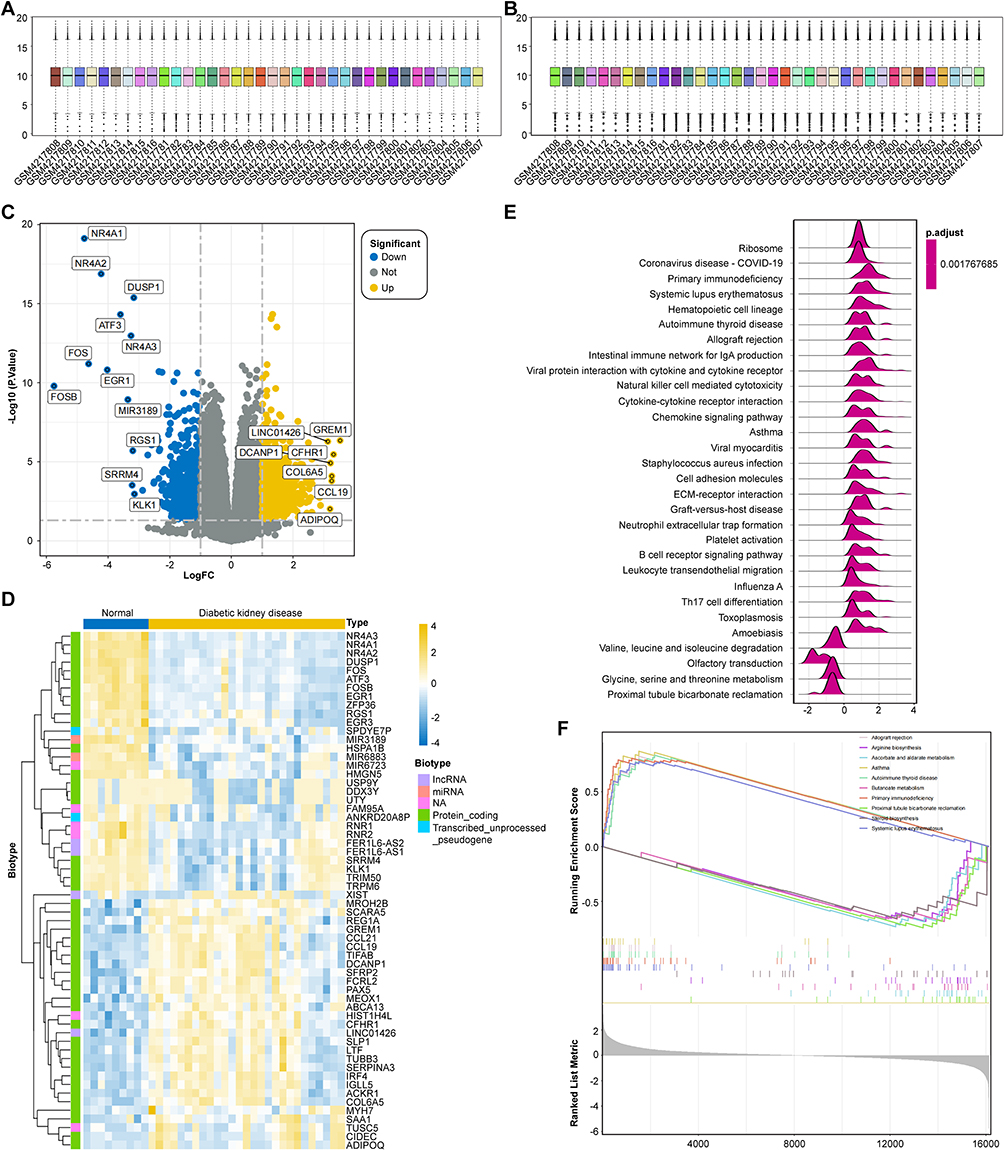 |
Figure 2 Differential gene expression analysis and pathway enrichment. (A and B) Box plots showing the gene expression profiles of samples from the GSE142025 dataset before (A) and after (B) normalization. (C) Volcano plot displaying DEGs between DKD and normal control samples. Yellow dots correspond to upregulated genes, and blue dots to downregulated genes. (D) Heatmap displaying the expression patterns of the top 20 differentially expressed genes (DEGs). (E) Ridge plot illustrating the distribution of core enrichment genes for the top 20 GSEA pathways. (F) GSEA enrichment plots for representative pathways showing significant enrichment in DKD or normal controls. |
WGCNA Identifies Key Gene Modules and Narrows Focus to IL-17 Signaling
To pinpoint the most critical genes within the complex network, we applied Weighted Gene Co-expression Network Analysis (WGCNA) on the top 5000 most variable genes from the dataset. Six co-expression modules were identified (Figures 3A–E). Among these, the “black” (r = 0.74, p < 0.01) and “purple” (r = 0.73, p < 0.01) modules showed the strongest positive correlation with DKD status (Figure 3F). By cross-referencing genes from both primary modules with earlier DEGs, we obtained a refined list of 55 core DKD-related genes (Figure 4A). Strikingly, KEGG pathway analysis of these 55 core genes revealed a significant enrichment in critical inflammatory signaling pathways, including the IL-17, TNF, and MAPK signaling pathways (Figures 4B and C), strongly implicating them as central targets for BBR’s therapeutic action.
 |
Figure 3 WGCNA of the GSE142025 dataset. (A) Scale-Free Fit Index and Mean Connectivity Assessment Across Multiple Soft-Thresholding Powers. A power of 11 was selected. (B and C) Hierarchical clustering dendrogram construction using dynamic hybrid cutting. (D) Module Eigengene-Clinical Trait Correlation Heatmap (DKD vs Normal). (E) Topological overlap matrix (TOM) plot showing the network heatmap of selected genes. The color-coded modules are indicated below the dendrogram. (F) Bar plot displaying mean gene significance for Diabetic Kidney Disease across modules, emphasizing black and purple modules as particularly relevant. |
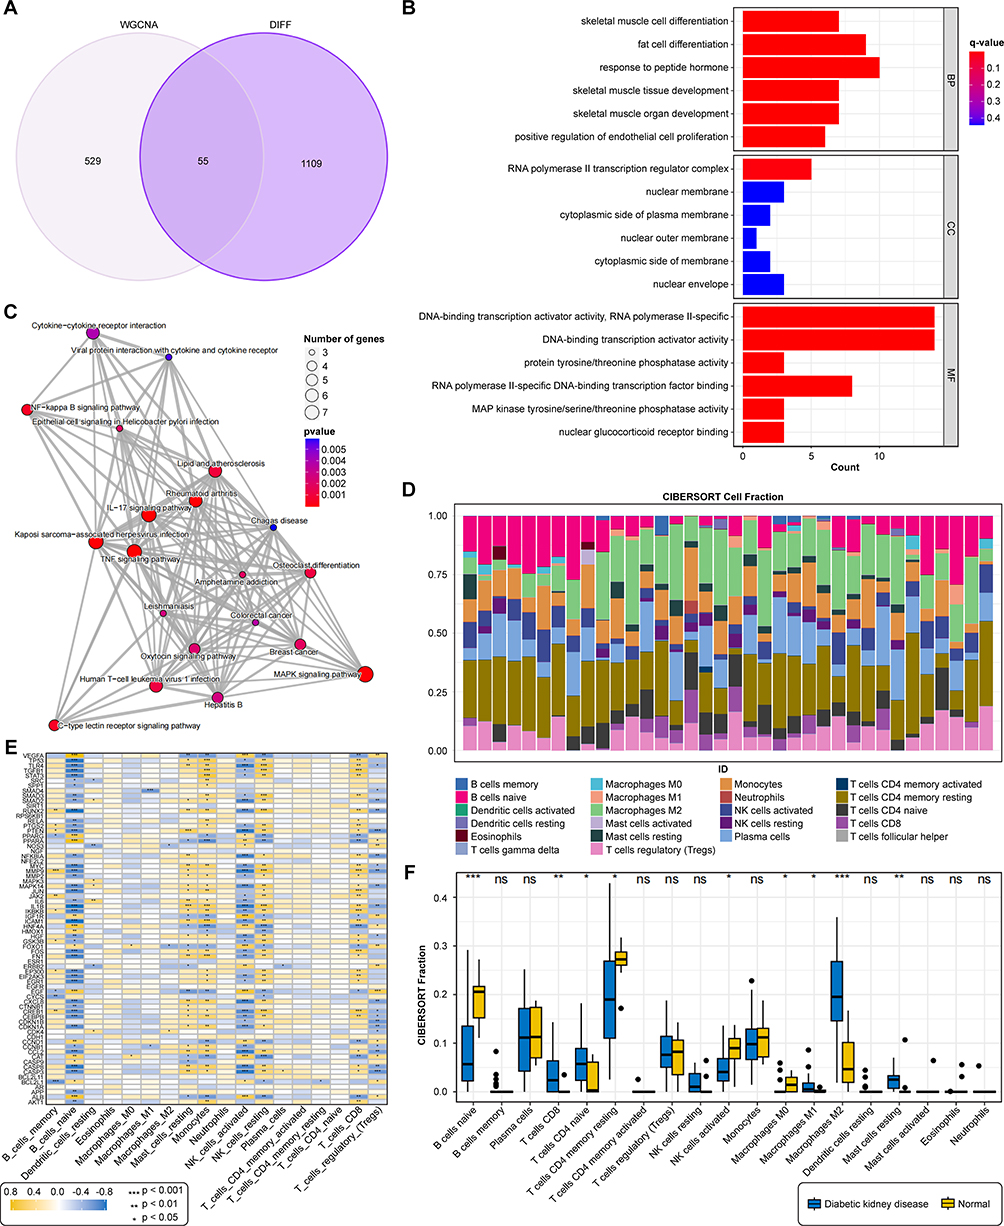 |
Figure 4 Identification and functional analysis of disease- and drug-related genes. (A) Venn diagram illustrating the shared genes between DEGs and DKD-linked WGCNA modules (black and purple). (B) GO enrichment analysis of the 55 intersecting genes. (C) KEGG enrichment analysis highlighting key pathways. (D) Stacked bar plot showing the proportions of 22 immune cell types in each sample. (E) Heatmap illustrating the correlation matrix among the infiltrating immune cells. (F) Box plots illustrating immune cell infiltration differences in DKD versus control groups.***P < 0.001,**P < 0.01,*P < 0.05 vs Normal. |
Immune Infiltration Analysis Highlights Macrophage Polarization Imbalance
To explore the cellular basis for this immune activation, we performed CIBERSORT analysis to deconvolve the immune cell landscape in renal tissues. The analysis revealed a profound immune imbalance in DKD kidneys, characterized by significantly increased infiltration of M1 macrophages (p < 0.05) and M2 macrophages (p < 0.01), alongside altered T and B cell subsets (Figures 4D–F). This finding pointed towards dysregulated macrophage polarization as a key pathological feature of DKD. A subsequent PPI network analysis identified a highly interconnected module of 75 hub genes, which were also enriched in the IL-17 signaling pathway (Figures 5A–C). Further ROC curve analysis identified 15 core genes (eg, FOXO1, VEGFA, MAPK14) with outstanding diagnostic accuracy (AUC > 0.9) for DKD (Figures 5D and E). Molecular docking simulations confirmed that BBR could form stable interactions with key proteins in these pathways, such as JUN and FOS, providing a structural basis for its regulatory potential (Figures 5F–I).
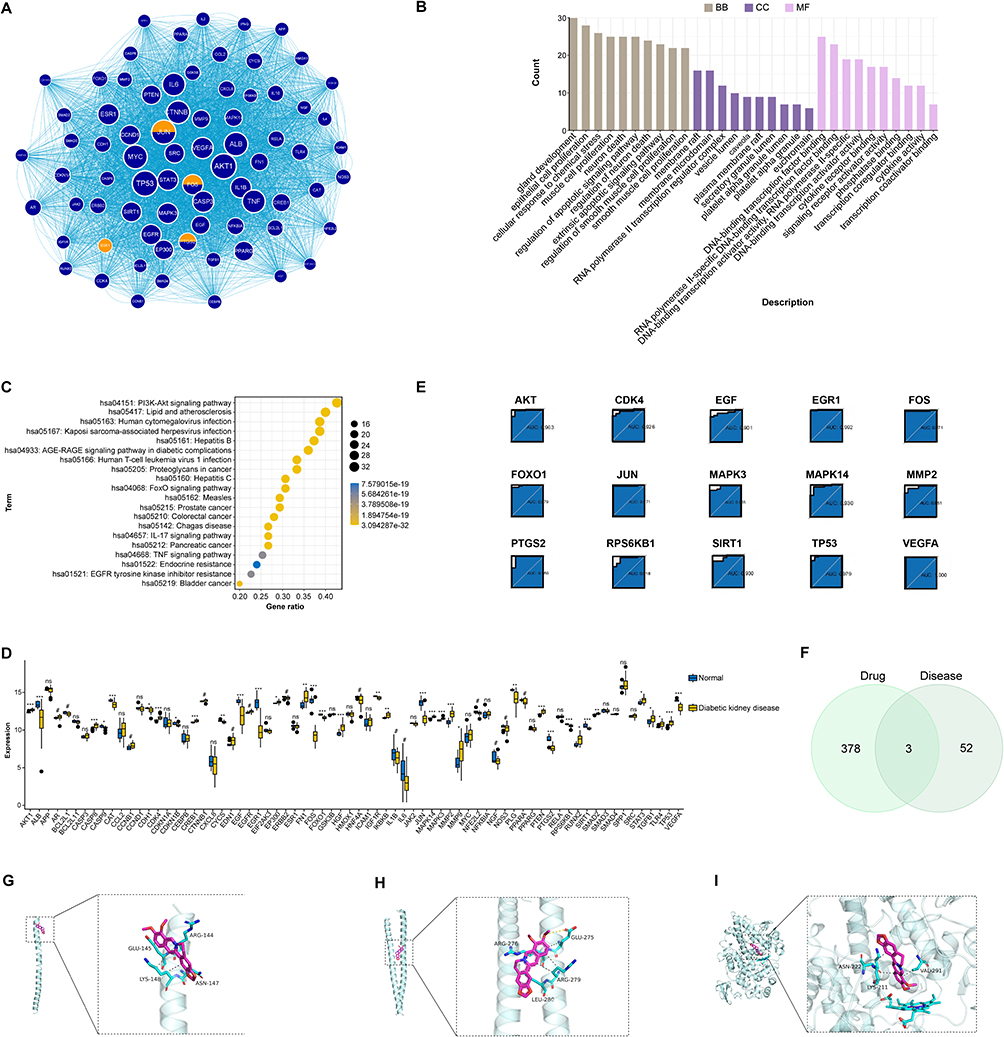 |
Figure 5 Diagnostic performance, immune infiltration, and molecular docking of key genes. (A) Protein-protein interaction (PPI) network of the intersecting genes. The most significant module identified by the MCODE plugin is highlighted. (B and C) GO and KEGG enrichment analyses of the genes within the key PPI module.(D) Box plot showing significant expression differences of hub genes between DKD and control groups. (E) ROC curve analysis of hub genes. (F) Venn diagram identifying the common genes between BBR targets and the 55 core DKD-related genes. (G–I) 3D visualization of the molecular docking poses of BBR with JUN (G), FOS (H), and PTGS2 (I). Hydrogen bonds are shown as dashed lines.***P < 0.001,**P < 0.01,*P < 0.05 vs Normal. |
BBR Protects Renal Tubular Epithelial Cells from High-Glucose-Induced Injury in vitro
Based on our bioinformatic predictions, we proceeded to validate the protective effects of BBR using an in vitro model of high-glucose-induced injury in NRK-52E renal tubular epithelial cells. A concentration of 40 mmol/L glucose for 24 h was found to significantly reduce cell viability and was selected as the optimal modeling condition (Figure 6A). BBR treatment (1, 3, and 6 μmol/L) dose-dependently restored the viability of these injured cells (Figure 6A).
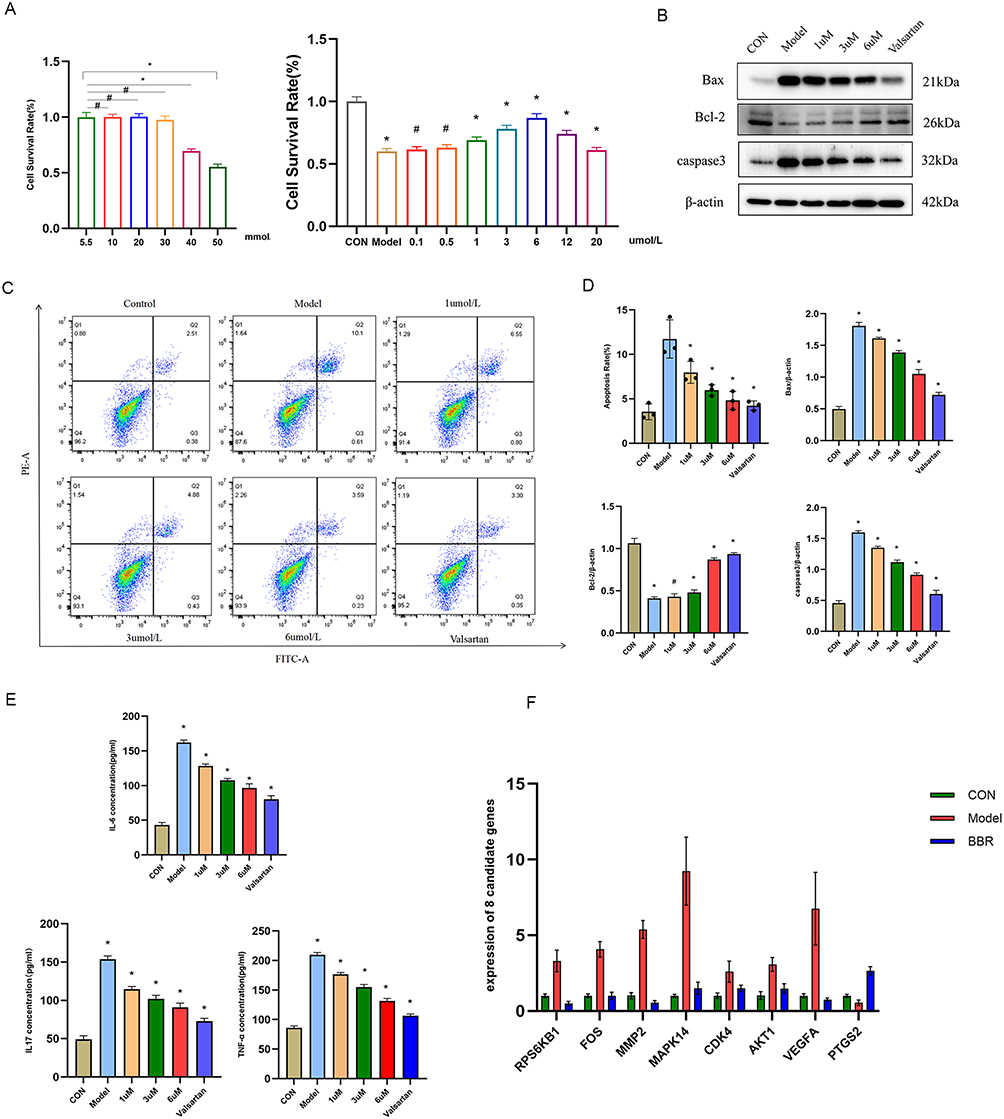 |
Figure 6 Effects of BBR on high-glucose-induced NRK-52E cells. (A) Cell viability of NRK-52E cells treated with different concentrations of glucose (left) or BBR under high-glucose (40 mM) conditions (right). (B) Representative flow cytometry plots showing apoptosis. (C) Western blot analysis of apoptosis-related proteins (Bax, Bcl-2, Caspase-3). (D) Quantification of the protein levels from (C). (E) ELISA results for IL-6, IL-17A, and TNF-α in the cell supernatant. (F) RT-qPCR analysis of hub gene expression. *P < 0.05, #P > 0.05 vs the model group. |
Furthermore, BBR demonstrated potent anti-apoptotic, anti-inflammatory, and anti-fibrotic properties. Flow cytometry and Western blotting confirmed that BBR significantly reduced high-glucose-induced apoptosis by decreasing the expression of Caspase-3 and Bax while increasing Bcl-2 levels (p < 0.01) (Figures 6B–D). In line with our pathway predictions, BBR significantly attenuated the high-glucose-induced secretion of pro-inflammatory cytokines IL-6, IL-17A, and TNF-α (p < 0.05) (Figure 6E). RT-qPCR analysis also showed that BBR reversed the aberrant expression of several core genes identified by bioinformatics, including downregulating MAPK14 and FOS (p < 0.05) (Figure 6F). Finally, immunofluorescence staining revealed that BBR mitigated fibrotic changes by suppressing the expression of Collagen I and α-SMA and restoring the epithelial marker E-cadherin (Figures 7A and B). Collectively, these in vitro results validate the multifaceted protective effects of BBR on renal cells under diabetic conditions.
 |
Figure 7 BBR inhibits high glucose-induced fibrosis on NRK-52E cells. (A and B) Representative immunofluorescence images and quantification for Collagen I, α-SMA, and E-cadherin. Scale bar = 50μm. *P < 0.05 vs the model group. |
BBR Ameliorates Renal Dysfunction and Rebalances Macrophage Polarization in a DKD Rat Model
To confirm the therapeutic relevance of BBR in vivo, we established a DKD rat model. Unlike their control group counterparts, DKD model rats demonstrated marked weight reduction, heightened blood sugar levels, and compromised kidney performance, with significantly increased blood urea nitrogen (BUN), serum creatinine (Scr), and 24-hour urinary protein measurements (p < 0.01). Eight weeks of treatment with BBR significantly reversed these metabolic and renal abnormalities in a dose-dependent manner, with the high-dose group showing efficacy comparable to the positive control drug, valsartan (p < 0.01) (Figures 8A and B). Histopathological analysis confirmed these findings, showing that BBR treatment substantially attenuated glomerular hypertrophy, extracellular matrix deposition, and interstitial fibrosis (Figure 8C).
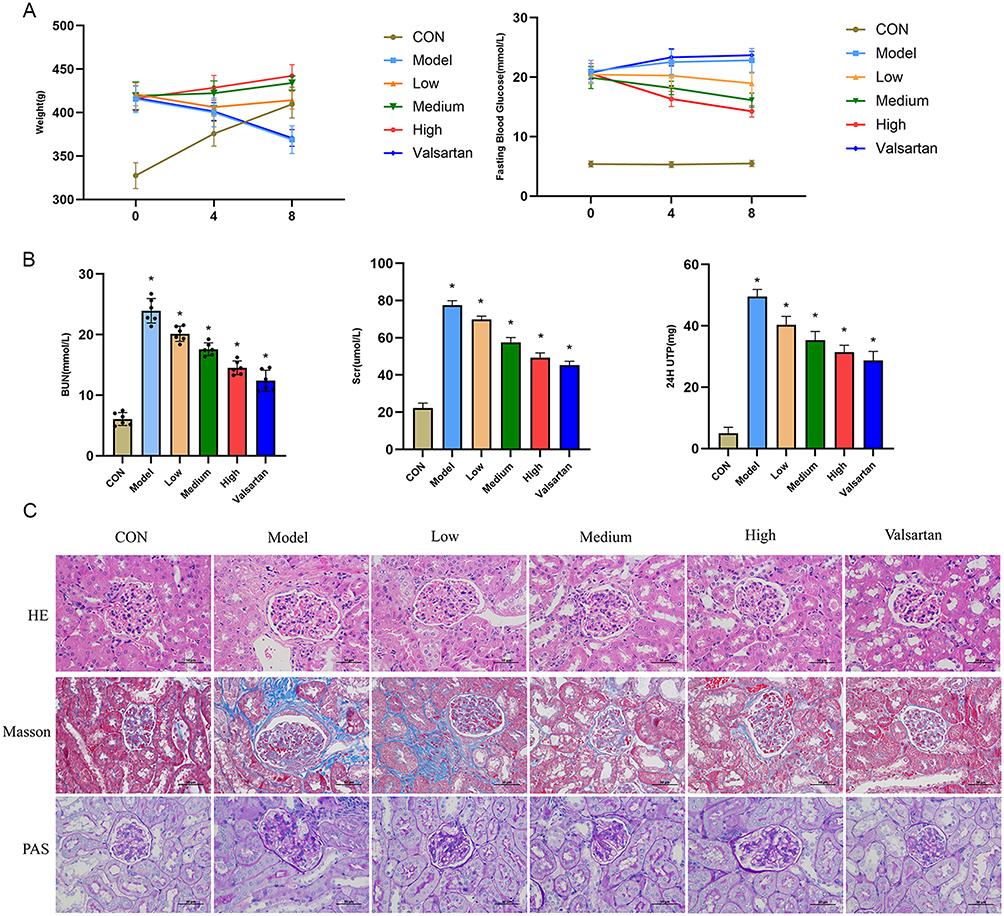 |
Figure 8 In vivo effects of BBR in a rat model of DKD. (A) Body weight and fasting blood glucose levels over 8 weeks. (B) Renal function parameters including BUN, Scr, and 24h UPro at the end of the experiment. (C) Representative images of HE, Masson’s trichrome, and PAS staining of kidney sections. Scale bar = 50μm.*P < 0.05 vs the model group. |
Crucially, we investigated whether BBR’s therapeutic effects were associated with the modulation of macrophage polarization, as predicted by our bioinformatic analysis. Immunofluorescence staining of kidney tissues revealed that DKD rats had a marked increase in M1 macrophage markers (iNOS, CD86) and a decrease in M2 markers (Arg-1, CD163). BBR treatment effectively reversed this imbalance, significantly suppressing M1 polarization while promoting the M2 phenotype (p < 0.01) (Figure 9A and B). The transformation of macrophage phenotype coincided with a body-wide decrease in pro-inflammatory cytokines (IL-6, TNF-α) and a corresponding elevation of the anti-inflammatory cytokine IL-10 in the bloodstream (p < 0.01) (Figure 9C).
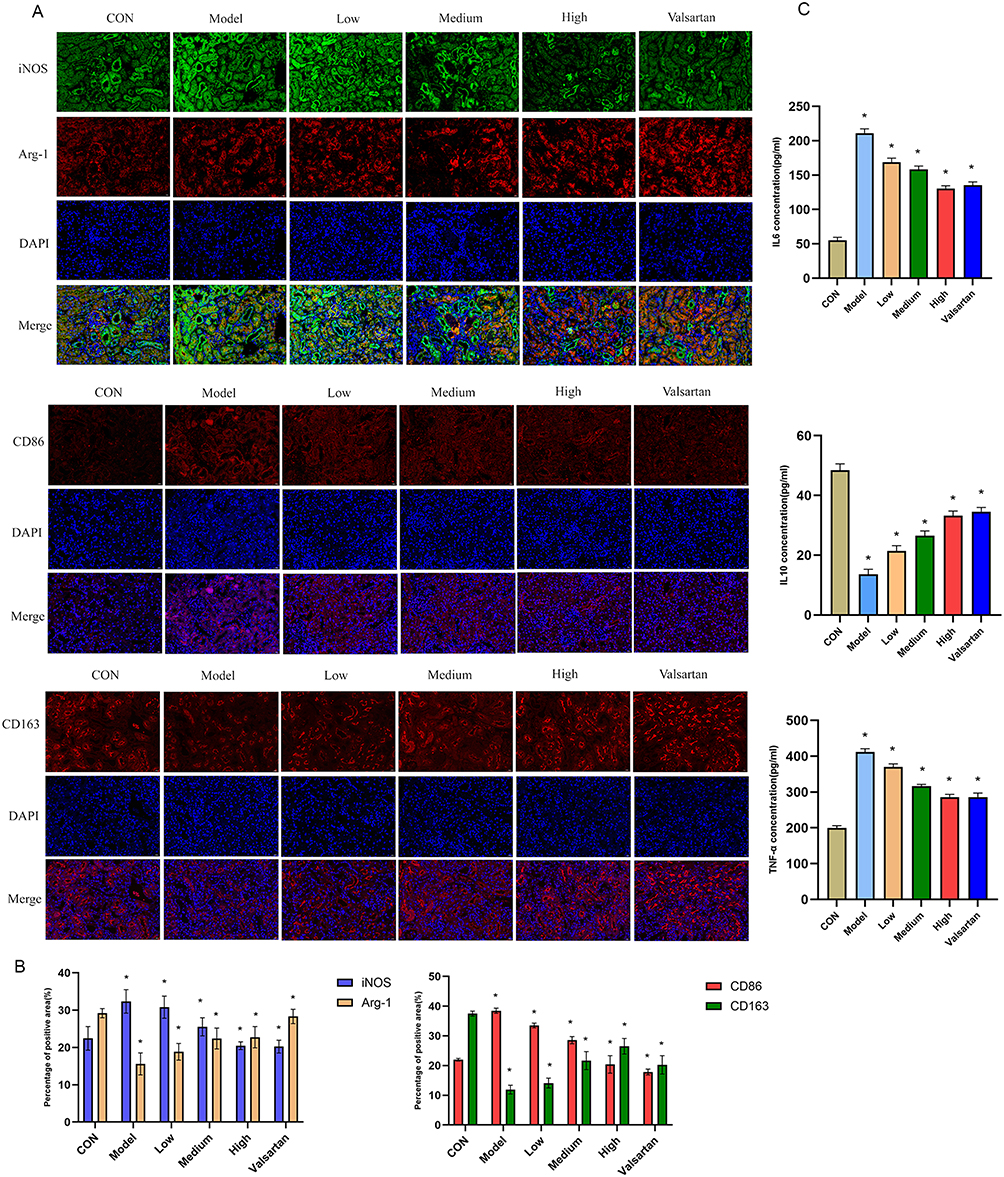 |
Figure 9 BBR Modulates Macrophage Polarization and Systemic Inflammation in DKD. (A and B) Representative immunofluorescence images and quantification of M1 (CD86, iNOS) and M2 (CD163, Arg-1) macrophage markers in the kidney. Scale bar =50μm. (C) Serum levels of IL-6, TNF-α, and IL-10 measured by ELISA. *P < 0.05vs. the model group. |
BBR Suppresses the IL17A/TRAF6/MAPK14 Signaling Pathway in vivo
Finally, to elucidate the underlying molecular mechanism, we examined the expression of key proteins in the IL-17 signaling pathway. Western blot analysis of renal tissues demonstrated that the expression of IL-17A, its downstream adaptor protein TRAF6, and the key signaling kinase MAPK14 (along with its phosphorylated form, p-MAPK14) were all significantly upregulated in the DKD model group. Consistent with its therapeutic effects, BBR treatment markedly downregulated the expression of these proteins (p < 0.01) (Figures 10A and B). This direct evidence links BBR’s ability to rebalance macrophage polarization and ameliorate DKD with its inhibitory effect on the IL-17A/TRAF6/MAPK14 signaling axis, thus validating our initial bioinformatic hypothesis.
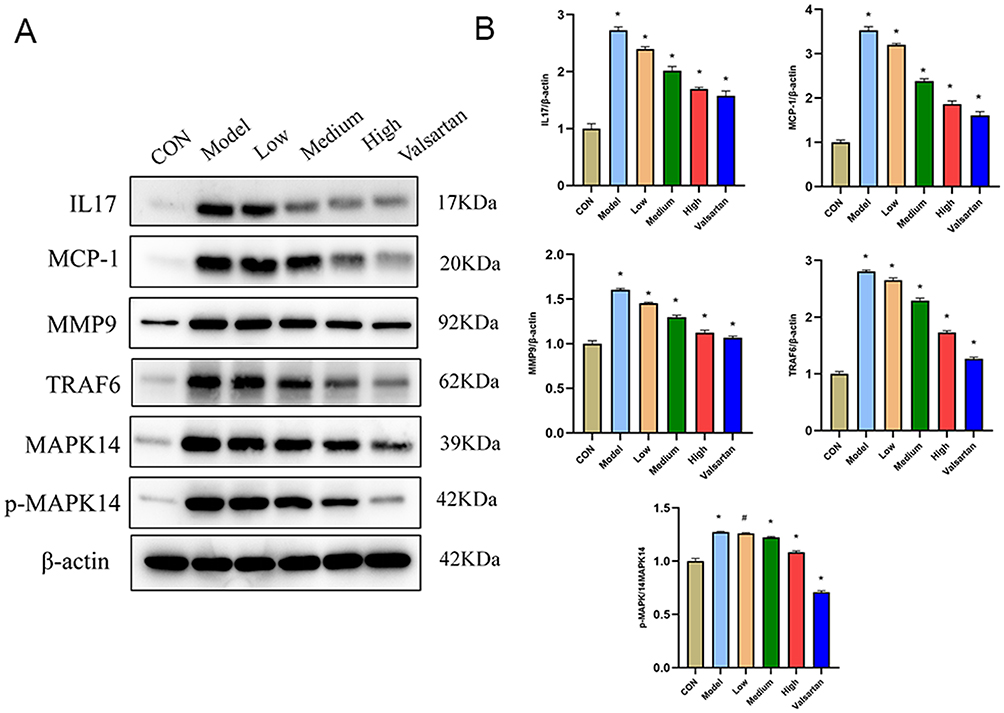 |
Figure 10 Effect of BBR intervention on protein expression in DKD rats by Western blot. (A and B) Western blot analysis and quantification of proteins in the IL-17A/TRAF6/MAPK14 pathway in kidney tissues. *P < 0.05, #P > 0.05 vs the model group. |
Discussion
Through an integration of bioinformatic prediction and experimental validation, this study was designed to systematically elucidate the molecular mechanisms by which berberine (BBR) confers renal protection in diabetic kidney disease (DKD). Our multi-layered approach first identified a dysregulated immune-inflammatory network as a central pathological hub in DKD and then pinpointed the IL-17A signaling pathway and macrophage polarization as BBR’s primary targets. Subsequent in vitro and in vivo experiments validated this hypothesis, providing a cohesive mechanistic narrative for BBR’s therapeutic efficacy.
A pivotal finding of our study is the profound ability of BBR to remodel the renal immune microenvironment by modulating macrophage polarization. Macrophages are critical arbiters of renal inflammation and fibrosis, and their functional phenotype dictates the balance between tissue injury and repair.23,24 Our in vivo results revealed BBR administration diminished pro-inflammatory M1 polarization while enhancing anti-inflammatory M2 differentiation. This shift correlated directly with improved renal function, reduced inflammatory infiltration, and attenuated fibrosis. Taken together, these findings provide strong evidence that targeting macrophage polarization represents a viable therapeutic strategy for DKD, and identify BBR as a potent modulator of this process, thereby advancing our mechanistic understanding of its renoprotective effects.
Mechanistically, we identified the IL-17A/TRAF6/MAPK14 signaling axis as the critical upstream pathway mediating BBR’s effects on macrophage polarization. The pro-inflammatory and pro-fibrotic roles of IL-17A in DKD are increasingly recognized, as it drives key pathological processes such as podocyte injury and mesangial proliferation.25–28 Our findings show that BBR markedly suppressed the expression of IL-17A, its key downstream adaptor TRAF6, and the phosphorylation of MAPK14 (p38α MAPK) in the kidneys of DKD rats.29 As a central node in inflammatory signaling, activated MAPK14 orchestrates the production of cytokines (IL-6, TNF-α) and chemokines (MCP-1) that are essential for M1 macrophage activation.30,31 Thus, by inhibiting this entire cascade, BBR effectively dismantles a key signaling network that sustains chronic inflammation in the diabetic kidney.
The therapeutic benefit of BBR is further amplified by its pleiotropic actions, which create a synergistic network of renoprotection. Our in vitro experiments provide direct evidence that BBR protects resident renal cells, such as tubular epithelial cells (NRK-52E), from high-glucose-induced injury. By preserving the health of these parenchymal cells and reducing their secretion of inflammatory signals, BBR helps to create a less hostile local microenvironment, which is inherently less conducive to M1 macrophage activation. This “environmental conditioning” complements its direct immunomodulatory effects. Furthermore, our bioinformatic analysis identified other hub genes, such as FOXO1 and VEGFA, which are integral to metabolic homeostasis and angiogenesis. FOXO1 is a crucial regulator of cellular stress responses and insulin signaling.32 Consistent with our findings, previous work has demonstrated that BBR can alleviate podocyte injury by modulating the FOXO1 axis, suggesting BBR enhances cellular resilience against metabolic insults.33 Similarly, by influencing targets like VEGFA, BBR may help normalize the dysregulated angiogenesis that contributes to renal microvascular damage and fibrosis.34,35 BBR’s inhibitory effect on the MAPK pathway is also not confined to macrophages;36–41 it has been reported to attenuate fibrosis in glomerular mesangial cells by suppressing this pathway.42 When combined with its well-established systemic hypoglycemic and lipid-lowering effects, this network of synergistic actions—improving the local microenvironment, enhancing cellular metabolic resilience, and directly inhibiting inflammation—likely explains the comprehensive renoprotection observed.
Despite the compelling findings, this study has several limitations. Our investigation focused on the IL-17A/TRAF6/MAPK14 pathway, but other signaling cascades may also be involved in BBR’s immunomodulatory effects. Additionally, while we demonstrated a strong correlation, future studies using macrophage-specific knockout models would be necessary to definitively establish a causal link between this pathway and macrophage polarization in the context of BBR treatment. Nevertheless, our work provides a robust foundation for future investigations. Exploring the potential of BBR as an adjunct therapy alongside existing DKD treatments, such as SGLT2 inhibitors, represents a promising avenue for clinical translation.
Conclusion
In summary, this study provides compelling evidence that berberine alleviates DKD by rebalancing macrophage polarization toward an anti-inflammatory M2 phenotype. We demonstrate, for the first time, that this immunomodulatory effect is mediated through the inhibition of the IL-17A/TRAF6/MAPK14 signaling axis. These findings not only uncover a novel mechanism underlying the renoprotective actions of berberine but also highlight the IL-17A–macrophage axis as a promising therapeutic target for combating inflammation and fibrosis in DKD.
Data Sharing Statement
We hereby declare that all data reported herein were generated by the authors independently. The study’s data are accessible from the corresponding author upon reasonable request.
Ethics Statement
This study constituted a secondary analysis of data from public databases and did not involve any direct intervention with human subjects. The data were obtained from the Gene Expression Omnibus (GEO) database (accession number GSE142025), which provides legally accessible, publicly available datasets that have been anonymized with personal identifiers removed. In accordance with the “Ethical Review Measures for Life Sciences and Medical Research Involving Humans” of the People’s Republic of China and the Declaration of Helsinki, this type of research, which analyzes pre-existing, anonymized data, is not considered to cause harm to individuals, does not involve sensitive personal information or commercial interests, and is classified as qualifying for exemption from ethical review. Therefore, this study did not require separate approval from an Institutional Review Board (IRB) or Ethics Committee. All the experiments were performed and analysed in accordance with ARRIVE guidelines and Jining Medical University Experimental Animal Ethics Committee (Approval Reference: JNMC-2024-DW-267).
Author Contributions
J.Fan contributed to Conceptualization, Formal analysis, Software, and Writing-original draft. Y. Liu and C. Zheng contributed to Data curation, Formal analysis, and Project administration. J. Liu, W. Liu, R. Geng, A. Zhao, and Y. Wang contributed to Investigation. R. Wang contributed to Funding acquisition, Resources, and Supervision. Z. Qi contributed to Conceptualization, Funding acquisition, Project administration, and Writing-review & editing. All authors made a significant contribution to the work reported, whether that is in the conception, study design, execution, acquisition of data, analysis and interpretation, or in all these areas; took part in drafting, revising or critically reviewing the article; gave final approval of the version to be published; have agreed on the journal to which the article has been submitted; and agree to be accountable for all aspects of the work.
Funding
Shandong Traditional Chinese Medicine Science and Technology Project (Q-2023073); Key Discipline of Traditional Chinese Medicine in Shandong Province ([2022] No. 4); Doctoral Fund of Jining NO.1 People’s Hospital (2022-BS-001).
Disclosure
No potential conflict of interest was reported by the author(s).
References
1. Packham DK, Alves TP, Dwyer JP, et al. Relative incidence of ESRD versus cardiovascular mortality in proteinuric type 2 diabetes and nephropathy: results from the DIAMETRIC (Diabetes Mellitus Treatment for Renal Insufficiency Consortium) database. Am J Kidney Dis. 2012;59(1):75–21. doi:10.1053/j.ajkd.2011.09.017
2. Thomas MC, Brownlee M, Susztak K, et al. Diabetic kidney disease. Nat Rev Dis Primers. 2015;1(1):15018. doi:10.1038/nrdp.2015.18
3. Li H, Lu W, Wang A, et al. Changing epidemiology of chronic kidney disease as a result of type 2 diabetes mellitus from 1990 to 2017: estimates from Global Burden of Disease 2017. J Diabetes Investig. 2021;12(3):346–356. doi:10.1111/jdi.13355
4. Jiang S, Yu T, Zhang Z, et al. Prognostic nomogram and score to predict renal survival of patients with biopsy-proven diabetic nephropathy. Diabet Res Clin Pract. 2019;155:107809. doi:10.1016/j.diabres.2019.107809
5. Yu M, Jin X, Liang C, et al. Berberine for diarrhea in children and adults: a systematic review and meta-analysis. Therap Adv Gastroenterol. 2020;13:1756284820961299. doi:10.1177/1756284820961299
6. Park HJ, Jung E, Shim I. Berberine for appetite suppressant and prevention of obesity. Biomed Res Int. 2020;2020:3891806. doi:10.1155/2020/3891806
7. Di S, Han L, An X, et al. In silico network pharmacology and in vivo analysis of berberine-related mechanisms against type 2 diabetes mellitus and its complications. J Ethnopharmacol. 2021;276:114180. doi:10.1016/j.jep.2021.114180
8. Wang H, Zhang H, Gao Z, et al. The mechanism of berberine alleviating metabolic disorder based on gut microbiome. Front Cell Infect Microbiol. 2022;12:854885. doi:10.3389/fcimb.2022.854885
9. Och A, Och M, Nowak R, et al. Berberine, a herbal metabolite in the metabolic syndrome: the risk factors, course, and consequences of the disease. Molecules. 2022;27(4):1351. doi:10.3390/molecules27041351
10. Guo J, Chen H, Zhang X, et al. The effect of berberine on metabolic profiles in type 2 diabetic patients: a systematic review and meta-analysis of randomized controlled trials. Oxid Med Cell Longev. 2021;2021(1):2074610. doi:10.1155/2021/2074610
11. Yan X, Yuan C, Wang Z, et al. Berberine modulates ovarian cancer autophagy and glycolysis through the LINC01123/P65/MAPK10 signaling axis. Phytomedicine. 2024;135:156121. doi:10.1016/j.phymed.2024.156121
12. Yang M, Zhang C. The role of innate immunity in diabetic nephropathy and their therapeutic consequences. J Pharm Anal. 2024;14(1):39–51. doi:10.1016/j.jpha.2023.09.003
13. Sun J, Zeng Q, Wu Z, et al. Berberine inhibits NLRP3 inflammasome activation and proinflammatory macrophage M1 polarization to accelerate peripheral nerve regeneration. Neurotherapeutics. 2024;21(4):e00347. doi:10.1016/j.neurot.2024.e00347
14. Yang X, Mou S. Role of immune cells in diabetic kidney disease. Curr Gene Ther. 2017;17(6):424–433. doi:10.2174/1566523218666180214100351
15. Fu Y, Sun Y, Wang M, et al. Elevation of JAML promotes diabetic kidney disease by modulating podocyte lipid metabolism. Cell Metab. 2020;32(6):1052–1062e8. doi:10.1016/j.cmet.2020.10.019
16. Zeng H, Qi X, Xu X, et al. TAB1 regulates glycolysis and activation of macrophages in diabetic nephropathy. Inflamm Res. 2020;69(12):1215–1234. doi:10.1007/s00011-020-01411-4
17. Wang M, Yao F, Chen N, et al. The advance of single cell transcriptome to study kidney immune cells in diabetic kidney disease. BMC Nephrol. 2024;25(1):412. doi:10.1186/s12882-024-03853-y
18. Kishore A, Petrek M. Roles of macrophage polarization and macrophage-derived mirnas in pulmonary fibrosis. Front Immunol. 2021;12:678457. doi:10.3389/fimmu.2021.678457
19. Chen T, Cao Q, Wang Y, et al. M2 macrophages in kidney disease: biology, therapies, and perspectives. Kidney Int. 2019;95(4):760–773. doi:10.1016/j.kint.2018.10.041
20. Zhao Y, Huang J, Li T, et al. Berberine ameliorates aGVHD by gut microbiota remodelling, TLR4 signalling suppression and colonic barrier repairment for NLRP3 inflammasome inhibition. J Cell Mol Med. 2022;26(4):1060–1070. doi:10.1111/jcmm.17158
21. Langfelder P, Horvath S. WGCNA: an R package for weighted correlation network analysis. BMC Bioinf. 2008;9:559. doi:10.1186/1471-2105-9-559
22. Metz CE. Basic principles of ROC analysis. Semin Nucl Med. 1978;8(4):283–298. doi:10.1016/S0001-2998(78)80014-2
23. Klessens CQF, Zandbergen M, Wolterbeek R, et al. Macrophages in diabetic nephropathy in patients with type 2 diabetes. Nephrol Dial Transplant. 2017;32(8):1322–1329. doi:10.1093/ndt/gfw260
24. Han HI, Skvarca LB, Espiritu EB, et al. The role of macrophages during acute kidney injury: destruction and repair. Pediatr Nephrol. 2019;34(4):561–569. doi:10.1007/s00467-017-3883-1
25. Abdel-Moneim A, Bakery HH, Allam G. The potential pathogenic role of IL-17/Th17 cells in both type 1 and type 2 diabetes mellitus. Biomed Pharmacother. 2018;101:287–292. doi:10.1016/j.biopha.2018.02.103
26. Tang W, Ge K, Shen L, et al. Th1 bias of liver mucosal-associated invariant T cells promotes hepatic gluconeogenesis in type 2 diabetes mellitus. Diabetes Metab Res Rev. 2023;39(4):e3620. doi:10.1002/dmrr.3620
27. Ma J, Li YJ, Chen X, et al. Interleukin 17A promotes diabetic kidney injury. Sci Rep. 2019;9(1):2264. doi:10.1038/s41598-019-38811-4
28. Weng CH, Li Y-J, Wu -H-H, et al. Interleukin-17A induces renal fibrosis through the ERK and Smad signaling pathways. Biomed Pharmacother. 2020;123:109741. doi:10.1016/j.biopha.2019.109741
29. Swaidani S, Liu C, Zhao J, et al. TRAF regulation of IL-17 cytokine signaling. Front Immunol. 2019;10:1293. doi:10.3389/fimmu.2019.01293
30. Lawrence T, Natoli G. Transcriptional regulation of macrophage polarization: enabling diversity with identity. Nat Rev Immunol. 2011;11(11):750–761. doi:10.1038/nri3088
31. Gauthier T, Chen W. Modulation of macrophage immunometabolism: a new approach to fight infections. Front Immunol. 2022;13:780839. doi:10.3389/fimmu.2022.780839
32. Zhao Y, Yang J, Liao W, et al. Cytosolic FoxO1 is essential for the induction of autophagy and tumour suppressor activity. Nat Cell Biol. 2010;12(7):665–675. doi:10.1038/ncb2069
33. Wang C, Wu H, Xie Y, et al. Berberine inhibits migration and apoptosis of rat podocytes in diabetic nephropathy via the novel lncRNA LOC102549726 related pathway. Phytother Res. 2025;39(3):1615–1631. doi:10.1002/ptr.8452
34. Zhou WM, Wu G-L, Huang J, et al. Low expression of PDK1 inhibits renal cell carcinoma cell proliferation, migration, invasion and epithelial mesenchymal transition through inhibition of the PI3K-PDK1-Akt pathway. Cell Signal. 2019;56:1–14. doi:10.1016/j.cellsig.2018.11.016
35. Huang MJ, Ji Y-W, Chen J-W, et al. Targeted VEGFA therapy in regulating early acute kidney injury and late fibrosis. Acta Pharmacol Sin. 2023;44(9):1815–1825. doi:10.1038/s41401-023-01070-1
36. Madkour MM, Anbar HS, El-Gamal MI. Current status and future prospects of p38alpha/MAPK14 kinase and its inhibitors. Eur J Med Chem. 2021;213:113216. doi:10.1016/j.ejmech.2021.113216
37. Valipour M, Mohammadi M, Valipour H. CNS-active p38alpha MAPK inhibitors for the management of neuroinflammatory diseases: medicinal chemical properties and therapeutic capabilities. Mol Neurobiol. 2024;61(7):3911–3933. doi:10.1007/s12035-023-03829-3
38. Romeo R, Giofrè SV, Chiacchio MA, et al. Synthesis and biological evaluation of 2,3,4-Triaryl-1,2,4-oxadiazol-5-ones as p38 MAPK inhibitors. Molecules. 2021;26(6):1745. doi:10.3390/molecules26061745
39. Nailwal NP, Doshi GM. Role of intracellular signaling pathways and their inhibitors in the treatment of inflammation. Inflammopharmacology. 2021;29(3):617–640. doi:10.1007/s10787-021-00813-y
40. Xu Q, Sheng L, Zhu X, et al. Jingfang granules exert anti-psoriasis effect by targeting MAPK-mediated dendritic cell maturation and PPARgamma-mediated keratinocytes cell cycle progression in vitro and in vivo. Phytomedicine. 2023;117:154925. doi:10.1016/j.phymed.2023.154925
41. Xu J, Cao J, Tan B, Xie S. G protein-coupled bile acid receptor 1 reduced hepatic immune response and inhibited NFkappaB, PI3K/AKT, and PKC/P38 MAPK signaling pathway in hybrid grouper. J Anim Sci. 2023;101: skad307.
42. Yang Z, Li J, Xiong F, et al. Berberine attenuates high glucose-induced fibrosis by activating the G protein-coupled bile acid receptor TGR5 and repressing the S1P2/MAPK signaling pathway in glomerular mesangial cells. Exp Cell Res. 2016;346(2):241–247. doi:10.1016/j.yexcr.2016.06.005
 © 2026 The Author(s). This work is published and licensed by Dove Medical Press Limited. The
full terms of this license are available at https://www.dovepress.com/terms
and incorporate the Creative Commons Attribution
- Non Commercial (unported, 4.0) License.
By accessing the work you hereby accept the Terms. Non-commercial uses of the work are permitted
without any further permission from Dove Medical Press Limited, provided the work is properly
attributed. For permission for commercial use of this work, please see paragraphs 4.2 and 5 of our Terms.
© 2026 The Author(s). This work is published and licensed by Dove Medical Press Limited. The
full terms of this license are available at https://www.dovepress.com/terms
and incorporate the Creative Commons Attribution
- Non Commercial (unported, 4.0) License.
By accessing the work you hereby accept the Terms. Non-commercial uses of the work are permitted
without any further permission from Dove Medical Press Limited, provided the work is properly
attributed. For permission for commercial use of this work, please see paragraphs 4.2 and 5 of our Terms.
Recommended articles
Decoding the Intercellular Cross-Talking Between Immune Cells and Renal Innate Cells in Diabetic Kidney Disease by Bioinformatics
Zhou M, Lu F, Jiang L, Chen C, Chen S, Geng L, Sun R, Li Q, Duan S, Zhang B, Mao H, Xing C, Yuan Y
Journal of Inflammation Research 2023, 16:3049-3062
Published Date: 21 July 2023
Network Analysis of Osteoarthritis Progression Using a Steiner Minimal Tree Algorithm
Xie Y, Shao F, Ji Y, Feng D, Wang L, Huang Z, Wu S, Sun F, Jiang H, Miyamoto A, Wang H, Zhang C
Journal of Inflammation Research 2024, 17:3201-3209
Published Date: 18 May 2024
CXCL16 Promotes the Development of Chronic Atrophic Gastritis by Regulating M1 Macrophage Polarisation
Ma X, Liu N, Cui W, Mai P
Journal of Inflammation Research 2026, 19:551832
Published Date: 19 January 2026