Back to Journals » Cancer Management and Research » Volume 11
Baseline FDG Uptake And Peripheral Lymphocyte-Monocyte Ratio For Predicting Chemoradiotherapy Response In Patients With Esophageal Squamous Cell Carcinoma
Authors Wang C ![]() , Zhao K
, Zhao K ![]() , Huang Y, Ma L, Song Y, Li M
, Huang Y, Ma L, Song Y, Li M
Received 15 August 2019
Accepted for publication 4 October 2019
Published 24 October 2019 Volume 2019:11 Pages 9085—9093
DOI https://doi.org/10.2147/CMAR.S227342
Checked for plagiarism Yes
Review by Single anonymous peer review
Peer reviewer comments 2
Editor who approved publication: Dr Chien-Feng Li
Chunsheng Wang,1,* Kewei Zhao,2,* Yong Huang,3 Li Ma,3 Yipeng Song,2 Minghuan Li2
1Department of Radiation Oncology, Qingdao University Medical College Affiliated Yantai Yuhuangding Hospital, Yantai 264000, Shandong, People’s Republic of China; 2Department of Radiation Oncology, Shandong Cancer Hospital and Institute, Shandong University, Jinan 250117, Shandong, People’s Republic of China; 3Department of Nuclear Medicine, Shandong Cancer Hospital and Institute, Shandong University, Jinan 250117, Shandong, People’s Republic of China
*These authors contributed equally to this work
Correspondence: Minghuan Li
Department of Radiation Oncology, Shandong Cancer Hospital and Institute, Shandong University, 440 Jiyan Road, Jinan 250117, Shandong, People’s Republic of China
Tel +86 531 67626112
Fax +86 531 87984079
Email [email protected]
Yipeng Song
Department of Radiation Oncology, Qingdao University Medical College Affiliated Yantai Yuhuangding Hospital, 20 Yudong Road, Yantai 264000, Shandong, People’s Republic of China
Tel +86 0535 6691999
Fax +86 535 6240341
Email [email protected]
Purpose: To explore he predictive values of both the baseline SUVmax of 18F-fluorodeoxy-glucose by the primary tumor in positron emission tomography/computed tomography (PET/CT) and the lymphocyte-monocyte ratio (LMR) in peripheral blood in inoperable treated esophageal squamous cell carcinoma (ESCC) patients who received concurrent chemoradiotherapy (CCRT).
Patients and methods: Between January 2011 and December 2016, 138 newly diagnosed ESCC patients from our institution were retrospectively recruited. The optimal cut-off values for baseline SUVmax and peripheral LMR were determined by individual receiver operating characteristic curves. The predictive values of baseline SUVmax and peripheral LMR for primary tumor response were examined by chi-square and Fisher’s exact tests, as was their combined predictive value.
Results: The objective response rate (ORR) was significantly different between the high-SUVmax group and the low-SUVmax group (61.9% vs 87.8%; P=0.004), as well as between the high-LMR group and the low-LMR group (80.7% vs 52.0%; P=0.001). Furthermore, the low-SUVmax-high-LMR group achieved the best ORR (100%), which was significantly different from the ORRs of the high-SUVmax-high-LMR group (ORR: 72.1%, P=0.002), the high-SUVmax-low-LMR group (ORR: 45.7%, P=0.001), and the low-SUVmax-low-LMR group (ORR: 45.7%, P=0.001).
Conclusion: Baseline SUVmax of the primary tumor and the peripheral LMR are independent predictors of CCRT response in the primary tumors of ESCC patients. Patients who have lower FDG uptake accompanied by a higher peripheral LMR are more likely to have a better primary tumor response after CCRT.
Keywords: esophageal squamous cell carcinoma, maximum standardized uptake value, lymphocyte–monocyte ratio, chemoradiotherapy, tumor response
Introduction
Esophageal cancer (EC) is the eighth most common malignancy and the sixth most common cause of cancer-related deaths worldwide.1 More than 50% of patients are diagnosed at a late stage and therefore lose the opportunity for surgical intervention.2 Chemoradiotherapy is the main treatment method for these patients and includes neoadjuvant chemoradiotherapy and definitive chemoradiotherapy.3,4 For these patients, early prediction of tumor response is very helpful for optimizing the treatment strategy in a timely manner, thus improving the local control rate and the survival rate. It has been reported that tumor response is affected by the tumor itself and the host immune status.5,6
Abnormal glucose metabolism is one of the core characteristics of tumor cell function and is considered to be an important index for tumor diagnosis and the evaluation of tumor biological behavior.7,8 18F-fluorodeoxy-glucose Positron emission tomography/computed tomography (18F-FDG PET/CT), as a commonly used clinical molecular imaging technique, can determine the metabolism of tumor cells at the molecular level by measuring the uptake of FDG in tumor tissues, and it has been widely used in predicting of the disease status of solid tumors.9–13 It has been reported that patients with a high baseline SUVmax have poor primary tumor responses in lymphoma, cervical cancer, and lung cancer.10–14 However, for EC patients undergoing CCRT, the correlation between baseline SUVmax and primary tumor response has not been consistent.15–20 Although some clinical studies suggest that primary tumors with lower SUVmax values can achieve higher objective remission rates,15–17 some data indicate that baseline SUVmax values have no predictive value with regards to the primary tumor response.18,19 Moreover, few studies have reported that patients with higher SUVmax values have better pathologic remissions after neoadjuvant CCRT.20 The inconsistency of these studies suggests that using SUVmax alone is not sufficient to predict tumor response in patients who receive CCRT.
On the other hand, as part of the host’s anti-tumor response, the immune system plays an important role in the development, progression and metastasis of cancer.21,22 Lymphocyte-monocyte ratio (LMR), as the ratio between absolute peripheral lymphocyte and monocyte counts, can reflect the immune status of the host and affect tumor progression. It has been reported that peripheral LMR is associated with tumor response and prognosis in lymphoma, nasopharyngeal carcinoma, lung cancer, colorectal cancer and other solid tumors.23–28 For esophageal cancer, a predictive role of the baseline peripheral LMR has also been reported.29,30 These studies have mainly focused on operable patients and explored the predictive value of peripheral LMR in terms of long-term effects, but few studies have focused on predicting tumor response in inoperable treated patients, which is also important for determining clinical treatment options.
Hence, in this study, we explored the predictive value of baseline SUVmax combined with peripheral LMR in patients with esophageal cancer undergoing CCRT based on two aspects: abnormal glucose metabolism by tumor cells and the anti-tumor immune response of the host.
Materials And Methods
Patient Selection And Characteristics
The presence of disease was histopathologically confirmed in all patients, the pathological type was esophageal squamous cell carcinoma, and all patients had a Karnofsky Performance Scale (KPS) score ≥70. In addition, all patients had a PET/CT examination one week before any systematic treatment as well as a routine blood test. All patients met the following criteria: (1) no history of other malignancy; (2) no distant metastasis (M0) or second primary tumor; (3) no acute infections or hematologic and autoimmune diseases as well as other diseases that may cause inflammation; (4) available clinical information; (5) locally advanced disease based on the 7th edition of the American Joint Committee on Cancer guidelines (AJCC7th edition). Using a hospital information system, we extracted the following baseline characteristics: age, gender, drinking history, smoking history, tumor location, TNM stage, and tumor stage. All of the patients were Chinese. The ethics committee of Shandong Cancer Hospital and Institute approved the study. All participants signed informed consents, and this study was conducted in accordance with the Declaration of Helsinki.
Treatment Protocols And Response Assessment
All patients received CCRT as their treatment option. All radiation treatments were performed using either 3D-CRT or intensity-modulated radiation therapy (IMRT). Patients were treated with a total dose of 50–64 Gy administered once daily in 25–32 fractions with a standard fractionation (ie 1.8 or 2.0 Gy/fractions, 5 days/week). Chemotherapy began on Day 1 concurrent with the initial radiation treatments, cycled every 28 days for 2–4 cycles for 2 cycles with radiation followed by 2 cycles without radiation. 5-Fluorouracil (700 mg/m2) was administered intravenously (iv) continuous infusion over 24 hrs daily on Days 1–4, and cisplatin (75 mg/m2) was administered by iv on Day 1. Due to the lack of endoscopic ultrasound examination in some patients and to the heterogeneity of the criteria, we did not consider the endoscopic results when evaluating tumor response. Due to economic factors and other reasons, a second PET-scan to assess the response is not available. Evaluation of the primary tumor response to treatment was performed by using esophagography and computed tomography scan 2–4 weeks after completion of CCRT. Tumor response was defined as a complete response (CR) or a partial response (PR); nonresponse was defined as stable disease (SD) or progressive disease (PD) according to the Response Evaluation Criteria in Solid Tumors (RECIST) version 1.1. A primary tumor response that fulfilled the CR criteria and PR criteria was defined as an objective response (OR) (OR=CR+PR), and other responses were defined as non-ORs.
Laboratory Data
As part of the laboratory examinations, peripheral blood was counted using Sysmex XT-2000i Automated Hematology Analyzer (GMI, MN, USA) before the initiation of systemic treatment, and both peripheral lymphocytes and monocytes were counted using an automated hematology analyzer. In this study, the peripheral LMR was calculated as the ratio between absolute counts of peripheral lymphocytes and monocytes.
PET/CT Scanning And Image Analysis
All patients underwent PET/CT examination one week before treatment using an advanced PET/CT scanner. The patients were asked to fast and rest at least 6 h before the examination. Then, 5.50 MBq/kg of 18F-FDG was injected into the patients after ensuring that blood glucose levels met the requirement. Sixty minutes later, whole-body PET and CT scans were performed from the top of the skull to the proximal thigh for 5 min per field of view, each covering 14.5 centimeters, with an axial sampling at 4.25 millimeters per slice. PET data sets were reconstructed with CT-derived attenuation correction using the ordered subset expectation maximiza¬tion algorithm. The PET parameters were measured using an elliptical region of interest (ROI) over the suspicious area showing increased FDG uptake compared to that of the surrounding esophageal tissue. The high¬est pixel value of the SUV was recorded as the SUVmax.
Statistical Analysis
The continuous variables baseline SUVmax and peripheral LMR were dichotomized using optimal cut-off values determined by receiver operating characteristics (ROC) curves. Fisher’s exact or chi-squared tests were used to compare the differences in baseline data regarding clinicopathological parameters (i.e., age, gender, drinking history, smoking history, tumor location, clinical tumor stage, clinical node stage, tumor stage and tumor response) between different SUVmax and LMR groups. Univariate and multivariate logistic regression analyses were used to analyze independent predictors of clinical tumor response. Fisher’s exact tests were used to compare the different tumor responses between each group based on SUVmax and LMR status, and the P-value was calibrated by the Bonferroni correction method. The analyses were performed with SPSS 22.0 program (SPSS Inc, Chicago, IL, USA), and a two-sided P-value less than 0.05 was considered statistical significance.
Results
Patient Characteristics
A total of 138 newly diagnosed primary ESCC patients were included in the analysis, including 109 (79.0%) males and 29 (21.0%) females, with a median age of 65 years (range: 40–90 years). The number of patients with a tumor location of cervical, upper-thoracic, mid-thoracic or lower-thoracic was 13 (9.4%), 42 (30.4%), 64 (46.4%) and 19 (13.8%), respectively. There were 37 (26.82%) patients with stage Ⅱ disease and 101 (73.2%) patients with stage Ⅲ disease. Additionally, most of the patients experienced an OR type of primary tumor response (97, 70.3%); by comparison, 41 (29.7%) patients had a non-OR type of primary tumor response. Specifically, the rate of CR, PR, SD and PD was 4.35%(n=6), 58.60%(n=81), 27.54%(n=38), 2.17%(n=3), respectively. It was difficult to differentiate T2 from T3 lesions, so we divided patients into stage T1–3 vs T4.The baseline data regarding the clinicopathological parameters of the patients are summarized in Table 1.
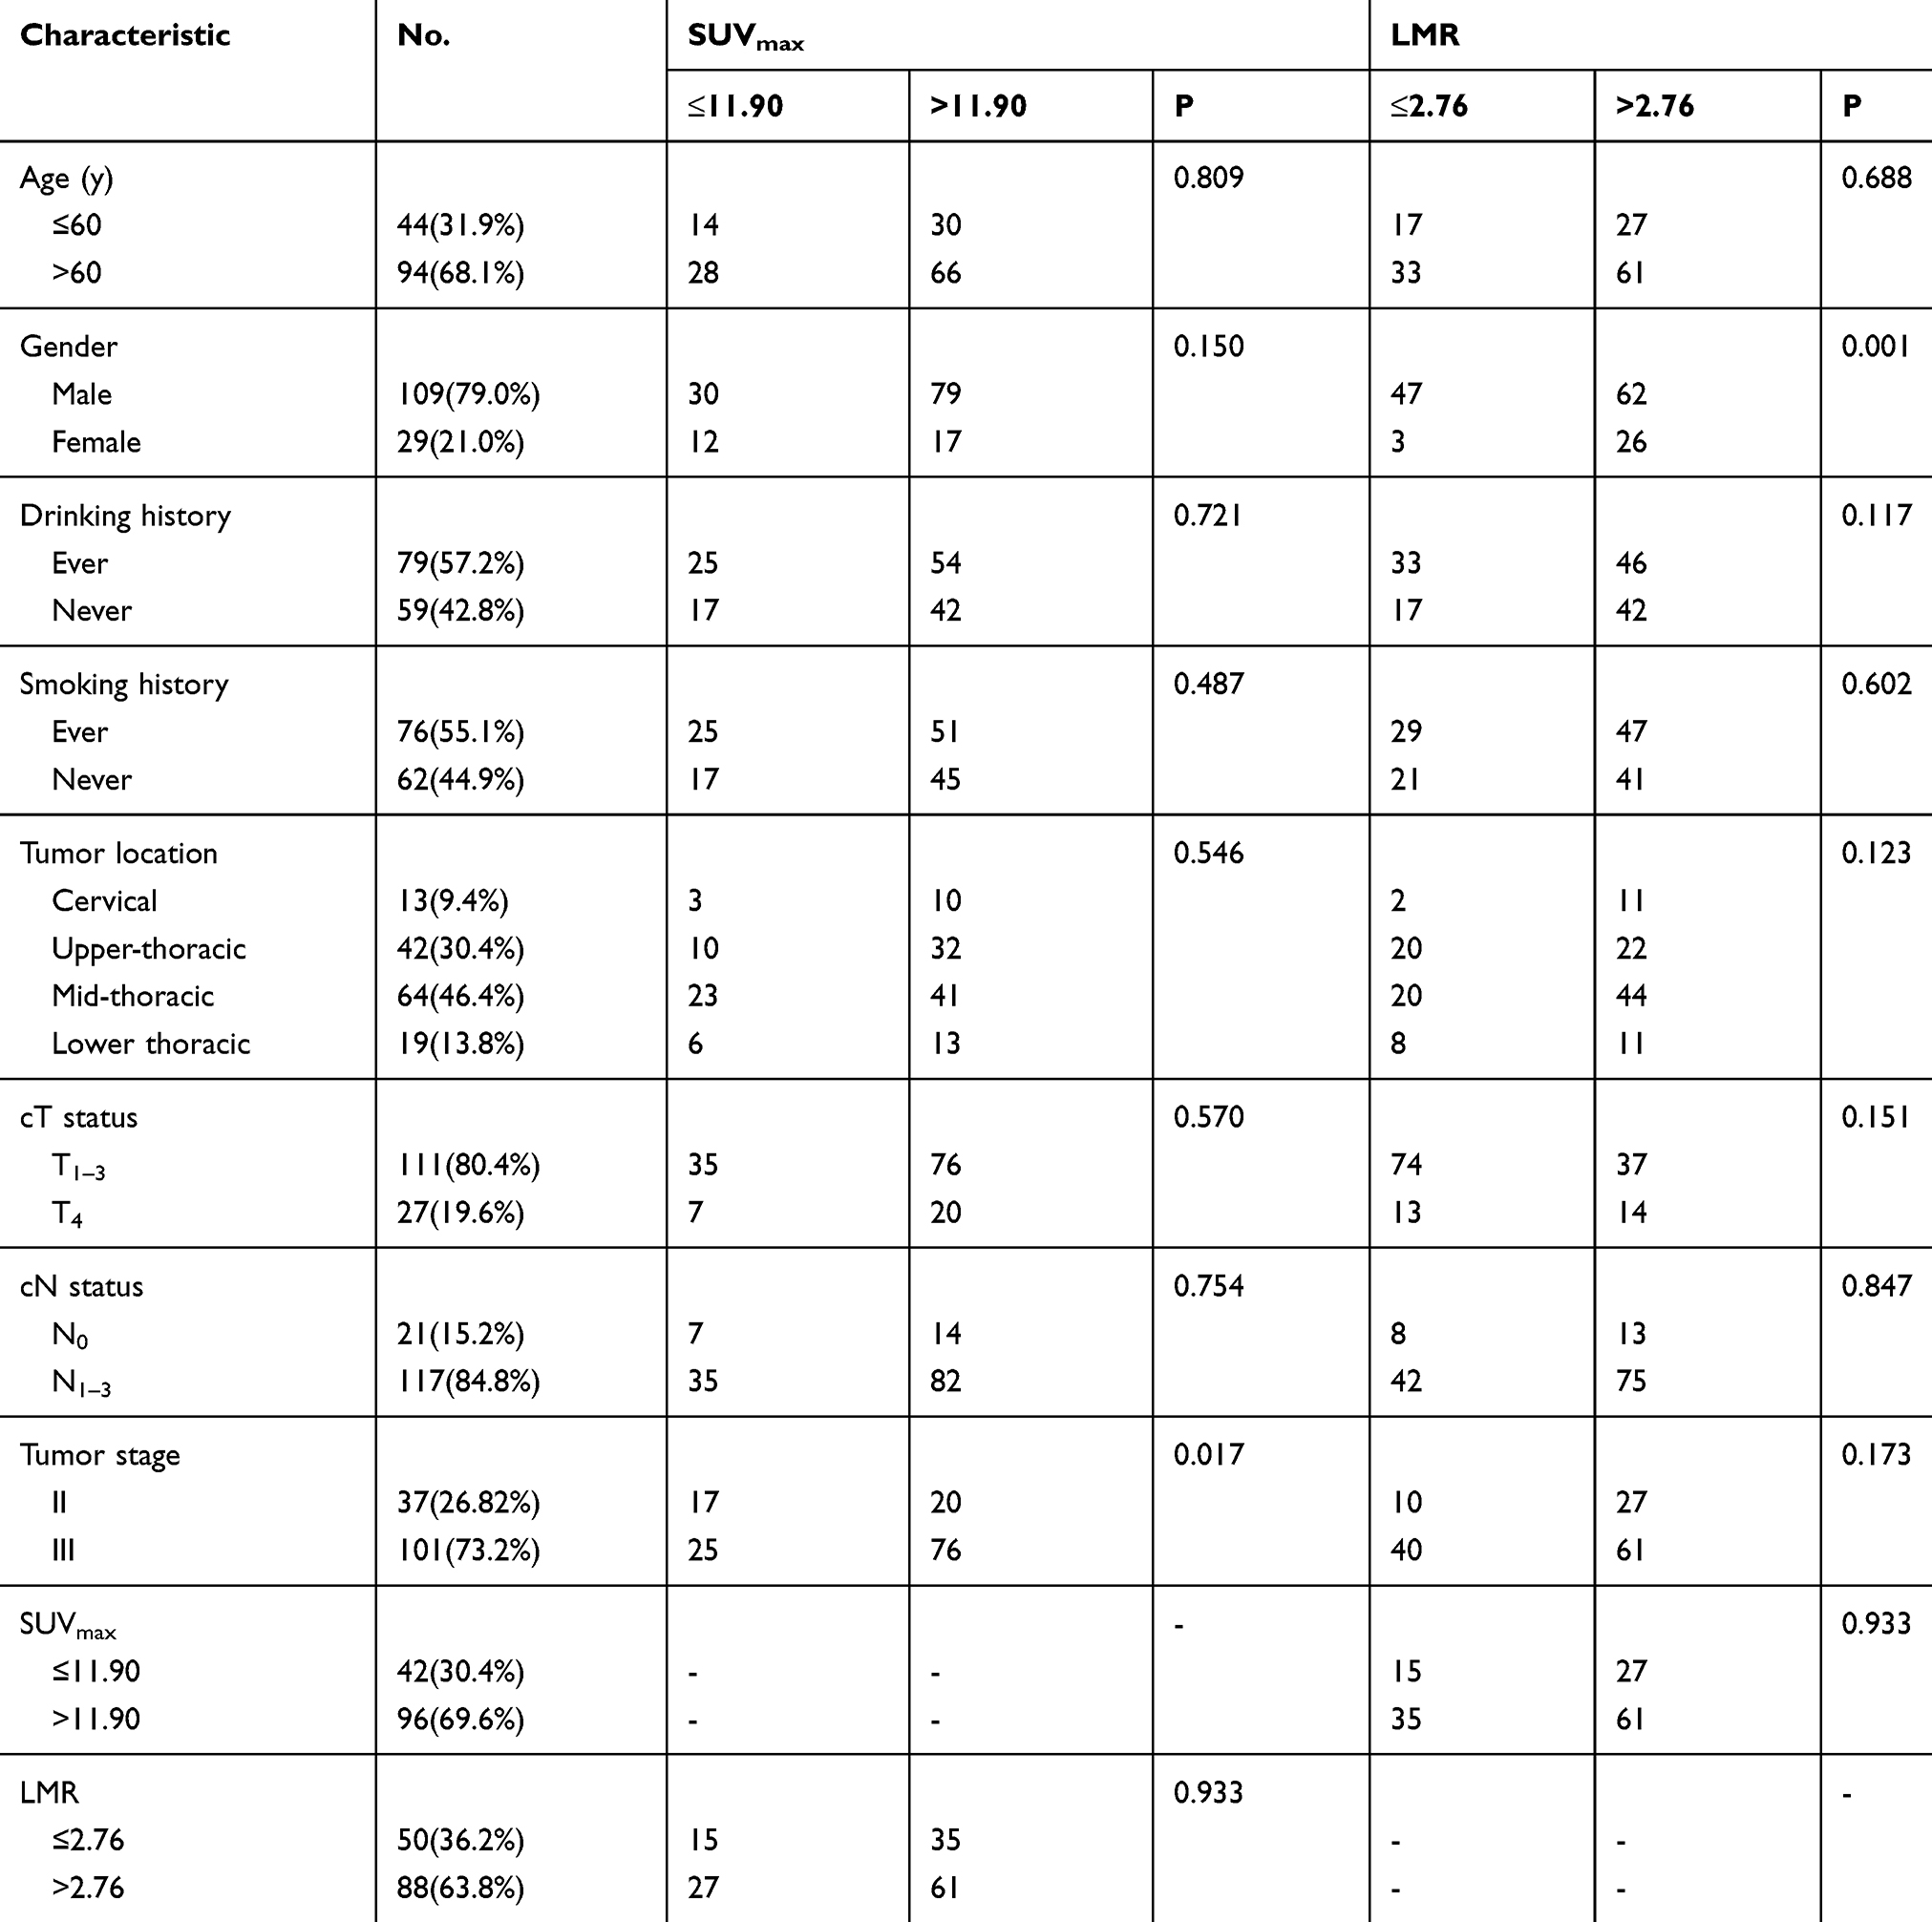 |
Table 1 Baseline Data Between Different SUVmax And LMR Groups |
Baseline SUVmax And Clinical Features
Receiver operating characteristic (ROC) curve analysis was performed to determine the optimal cut-off value for SUVmax values: an area under the curve (AUC) of 0.682 was produced (Figure 1). The optimal cut-off value was 11.90 for the SUVmax; patients were stratified into two groups (the low-SUVmax group and the high-SUVmax group) on the basis of this cut-off. We found that SUVmax had predictive abilities for primary tumor response. The number of patients who obtained an OR type of primary tumor response was 36 in the low-SUVmax group versus 60 in the high-SUVmax group, with ORR values of 87.8% and 61.9%, respectively (P=0.004). We also found that patients with advanced-stage (III) disease had significantly higher SUVmax values than those with early-stage disease (p=0.017). Apart from those two features, none of the other parameters (i.e., age, gender, drinking history, smoking history, tumor location, clinical tumor stage, and clinical node stage) were associated with significant differences between the two groups (Table 1).
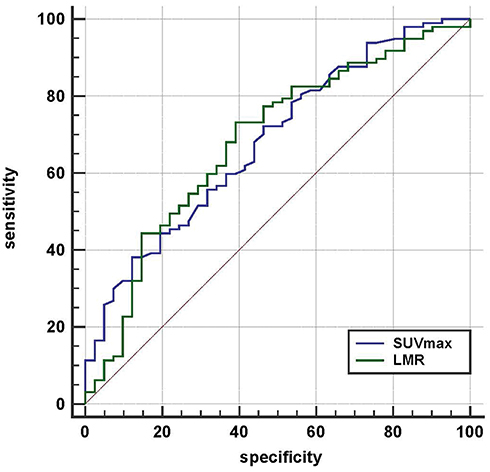 |
Figure 1 ROC curve of SUVmax and NLR for primary tumor response prediction. Notes: The AUCs of LMR and SUVmax was 0.682(95% CI 0.598–0.759) and 0.667(95% CI 0.582–0.745) with the cut-off values was11.90, 2.76, respectively. Abbreviations: SUVmax, maximal standardized uptake value; LMR, lymphocyte–monocyte ratio. |
Peripheral LMR And Clinical Features
ROC analysis revealed that the cut-off point for peripheral LMR values was 2.76, with an AUC of 0.667 (Figure 1). From the comparisons, we found that 71 (80.7%) patients had an OR type of primary tumor response in the high-LMR group (LMR>2.76), while there were only 26 (52.0%) patients who had an OR type of primary response in the low-LMR group (LMR≤2.76); this difference was statistically significant (P=0.001). Interestingly, there were gender differences between LMR groups: the proportion of women in the low-LMR group was larger than that in the high-LMR group (94.0% vs 70.5%, P=0.001). It may be due to the heterogenous distribution of female patients in different groups, which was caused by the low incidence of esophageal cancer in females. Regarding the other features, no statistically significant correlations were seen between different peripheral LMR groups (Table 1).
Univariate And Multivariate Analyses Of The Primary Tumor Response
In univariate analysis, tumor stage (P=0.006, HR =0.210), SUVmax (P=0.004, HR =4.440) and LMR (P=0.001, HR =3.885) were associated with primary tumor response (Table 2). Age (p=0.711), gender (p=0.461), drinking history (p=0.580), smoking history (p=0.554), tumor location (p=0.747), clinical tumor stage (p=0.166) and clinical node stage (p=0.252) showed no significant differences between the two groups (Table 2). Multivariable logistic regression analyses were then performed, including the significant parameters (tumor stage, SUVmax and LMR). The results showed that tumor stage (P=0.026, HR =0.261; 95% CI: 0.080–0.850), SUVmax (P=0.007, HR=0220; 95% CI: 0.073–0.660) and LMR (P=0.001, HR=4.186; 95% CI: 1.821–9.624) were independent predictors of primary tumor response (Table 3).
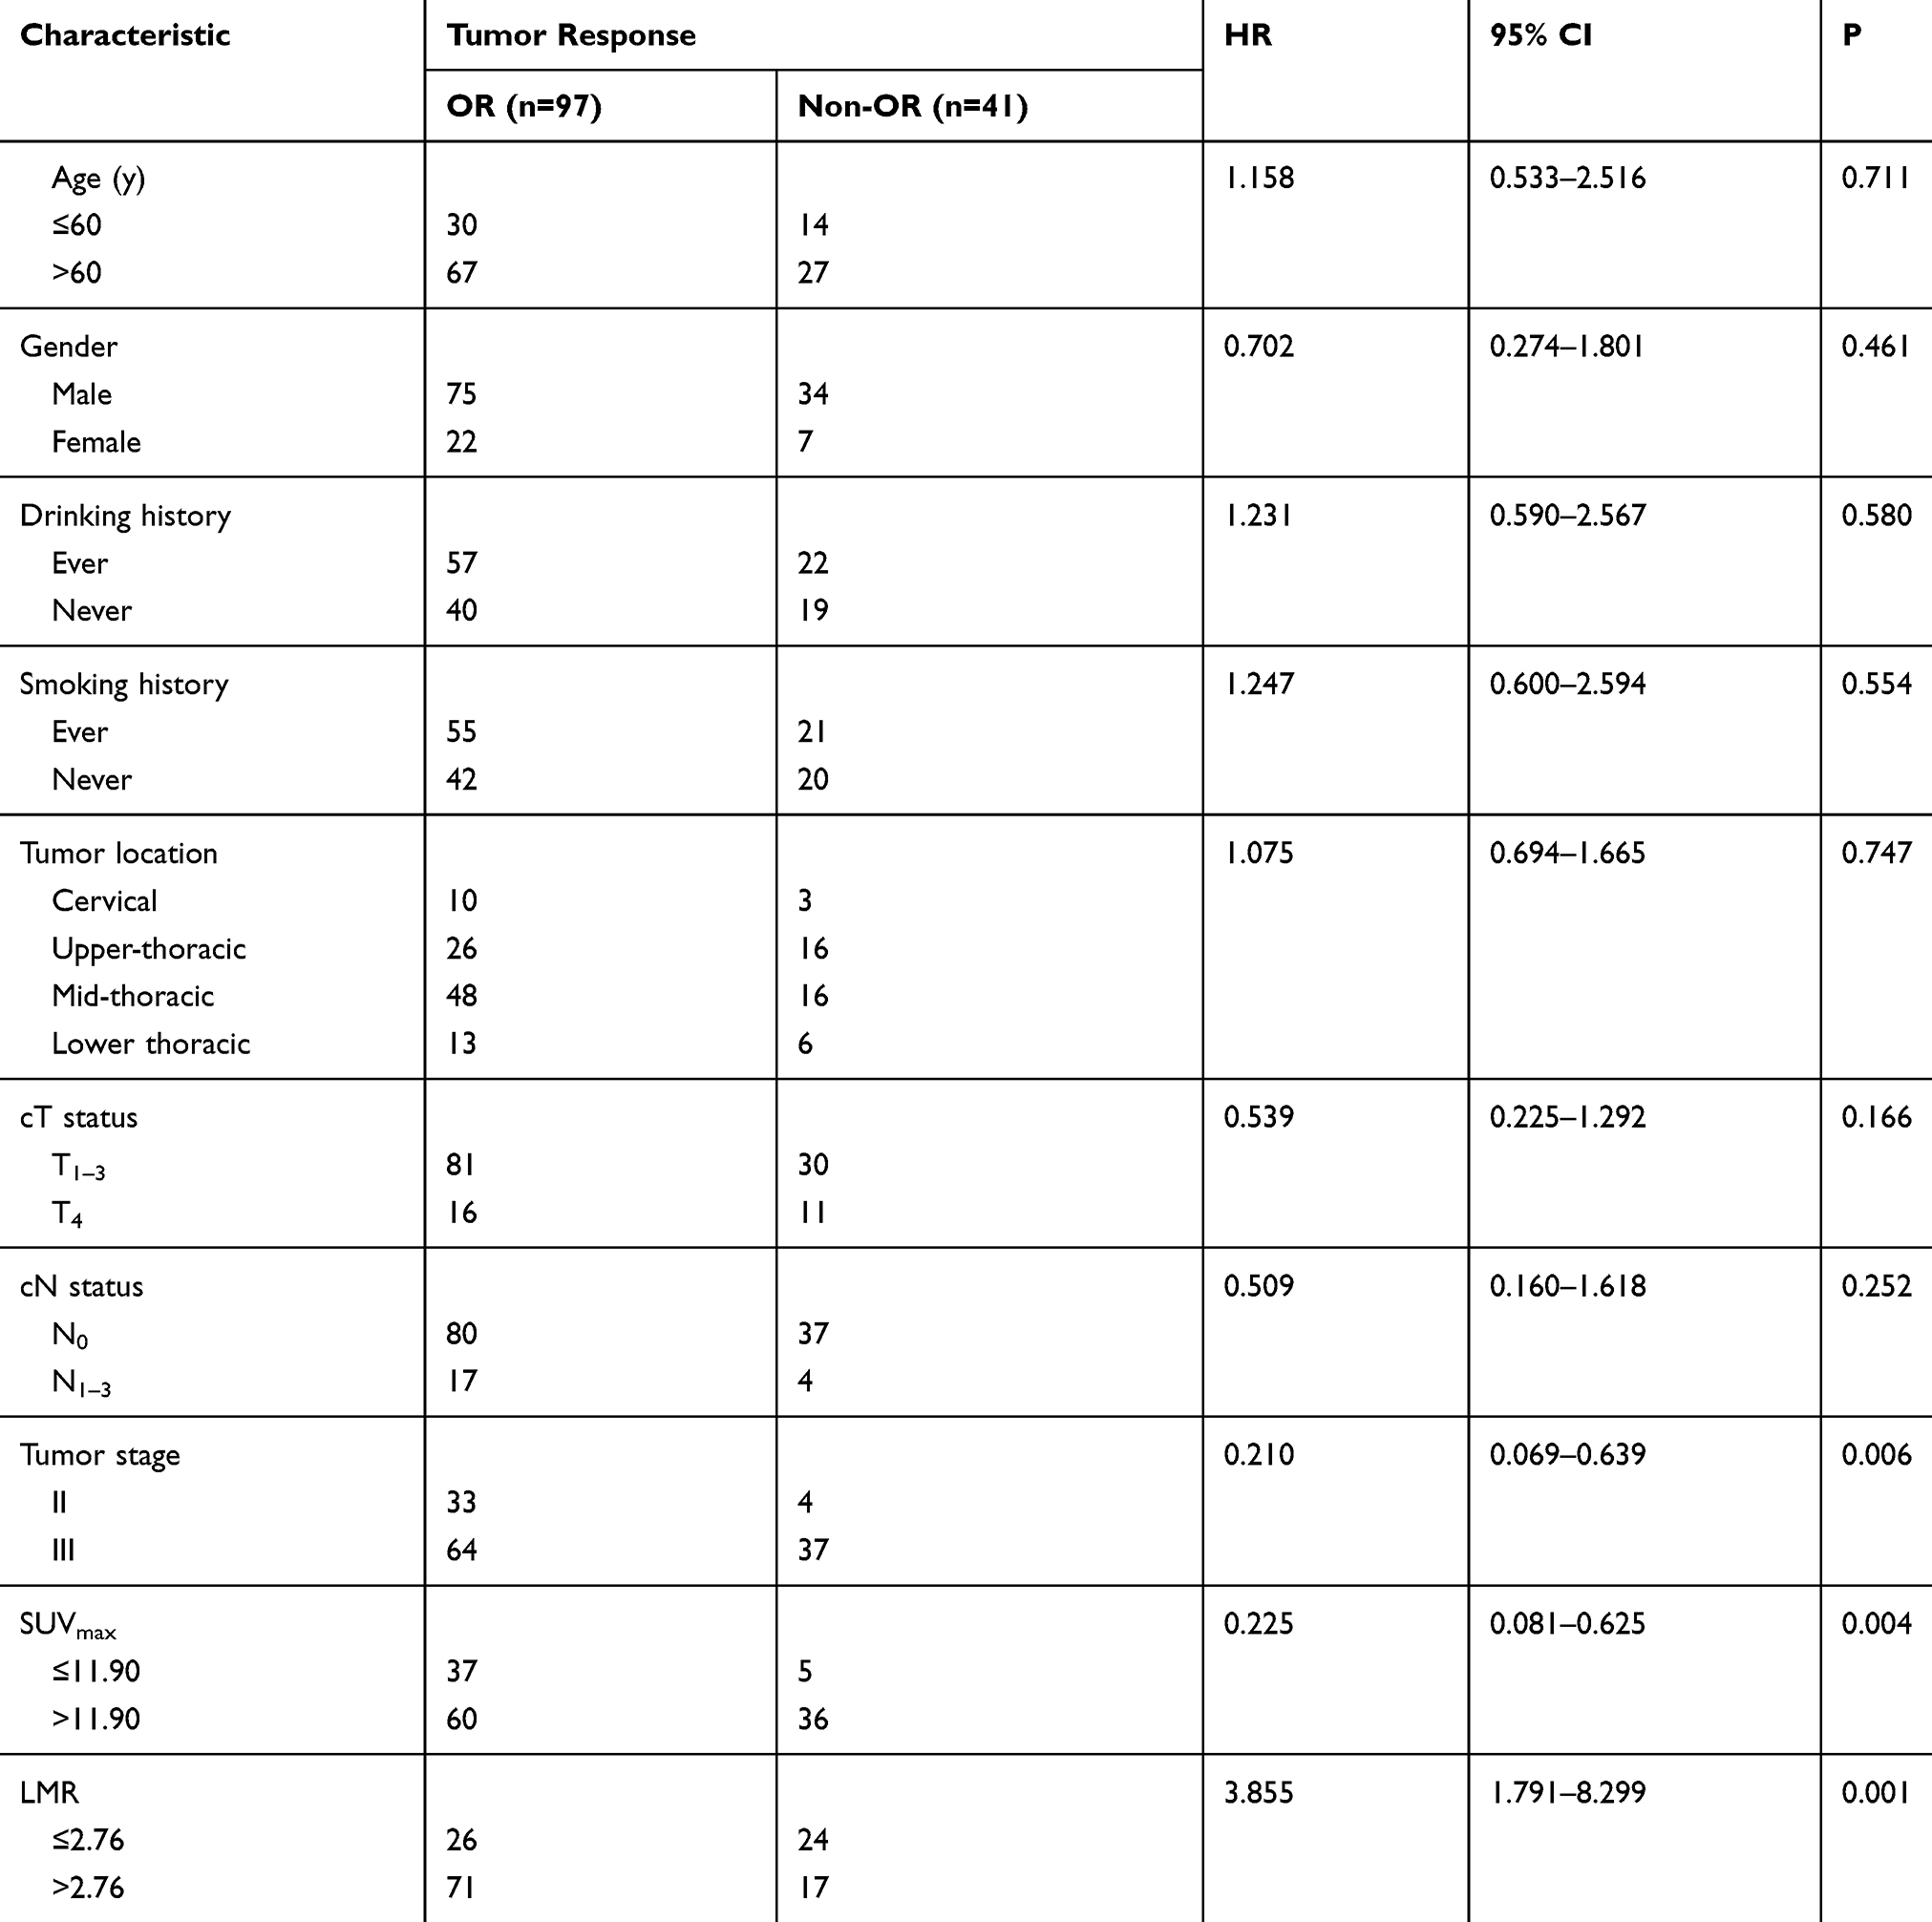 |
Table 2 Univariate Analysis For Primary Tumor Response (OR And Non-OR) |
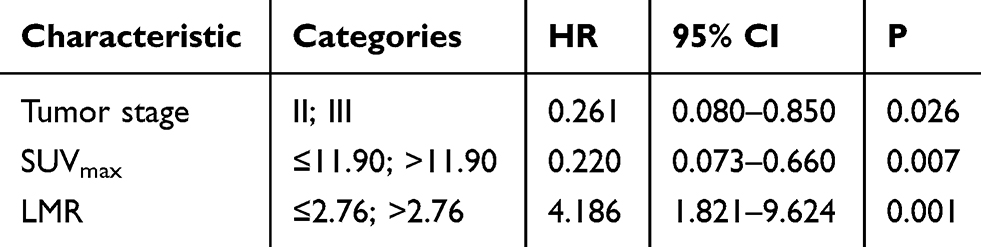 |
Table 3 Multivariate Analysis For Primary Tumor Response (OR And Non-OR) |
Combined Predictive Value Of Baseline SUVmax And Peripheral LMR
Based on the optimal cut-off values of SUVmax and LMR, we divided the patients into four different groups: a low-SUVmax-high-LMR group (Group 1, G1; n=27), a low-SUVmax-low-LMR group (Group 2, G2; n=15); a high-SUVmax-high-LMR group (Group 3, G3; n=61), and a high-SUVmax-low-LMR group (Group 4, G4; n=35). The number of patients who obtained OR types of primary tumor response was 27 in G1, 15 in G2, 44 in G3 and 16 in G4, with ORRs of 100%, 66.7%, 72.1% and 45.7%, respectively. These differences were statistically significant (P<0.001). We found that Group 1 had the highest ORR (100%), while Group 4 had the worst ORR (45.7%). To further explore whether there was a significant difference between the groups, we compared both Group 1 and Group 4 with the other three groups individually. The statistical analysis data showed that the P-values were 0.001, 0.002 and <0.001 when Group 1 was compared with Group 2, Group 3 and Group 4, respectively. According to the Bonferroni correction, all P-values needed to be less than 0.0167 (α=0.05/3); therefore, these differences were statistically significant. However, when Group 4 was compared with the other three groups, only the comparisons with Group 1 and Group 3 were statistically significant (P<0.001 and P=0.010), while the comparison with Group 2 was not (P=0.174) (Table 4).
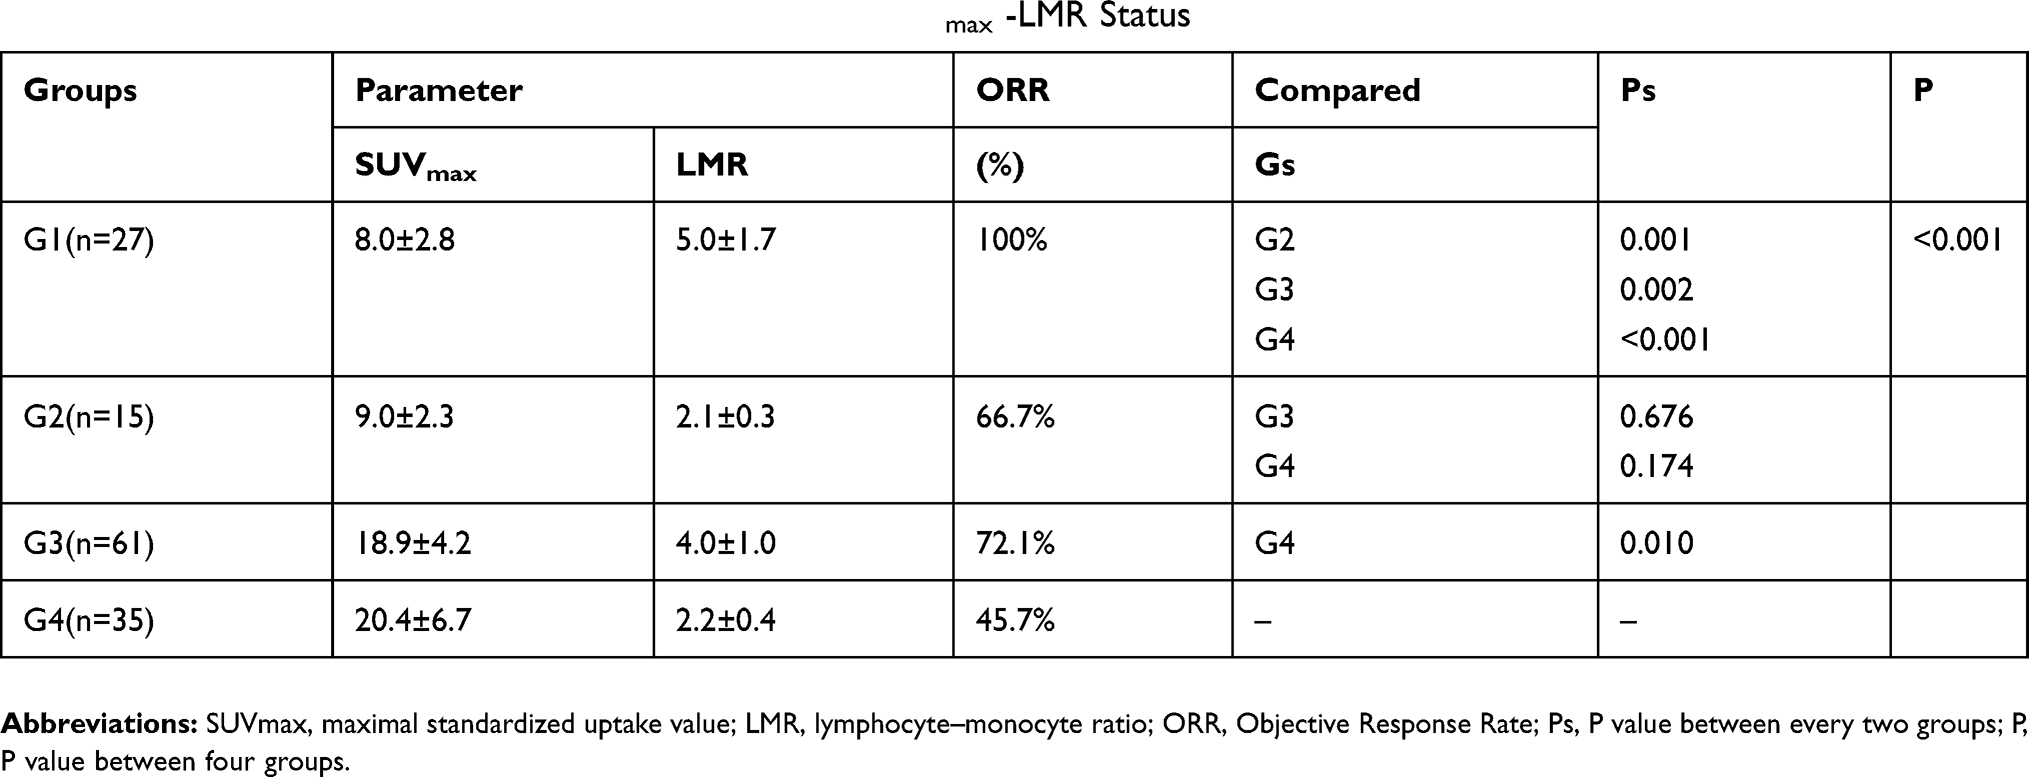 |
Table 4 Compare Between Different Groups Based On SUVmax -LMR Status |
Discussion
In this study, we retrospectively analyzed a series of newly diagnosed ESCC patients who underwent PET/CT and routine blood tests before treatment. Baseline SUVmax combined with peripheral LMR can be used as an effective indicator to predict the clinical primary tumor response for patients who are treated with CCRT. To the best of our knowledge, this is the first study to consider both abnormal glucose metabolism by tumor cells and the anti-tumor immune response of the host.
Approximately 100 years ago, Otto Warburg observed that, in order to survive and grow in host tissue, tumor cells had high rates of glycolysis despite the presence of oxygen.7,8 This increased glucose metabolism by tumor cells is considered an important factor affecting tumor biology and manifests as increased FDG uptake. Previous studies have shown that the baseline SUVmax of primary tumors has potential value for predicting treatment response in lung cancer, cervical cancer and lymphoma. In those studies, patients with higher SUVmax values are more likely to have poor primary tumor responses.10–14 In this study, we divided 138 newly diagnosed inoperable treated ESCC patients into a high-SUVmax group and a low-SUVmax group using a cut-off SUVmax value of 11.90. We found that the number of who achieved an OR in the low-SUVmax group was higher than that in the high-SUVmax group, and more patients were in the low-SUVmax group overall. Patients with lower SUVmax values had better primary tumor responses. These results are supported by the study by Suzuki A et al,15 in which the analysis of 179 esophageal or gastroesophageal carcinoma patients showed that patients who reached clinical complete response after definitive CCRT had a median SUV of 10.2, whereas those who did not achieve a clinical complete response had a median SUV of 15.3. Kato H et al16 have reported similar findings, reporting that the median SUV of the patients who reached a CR was 4.9, compared with 10.2 in non-CR patients. In our analysis, age, gender, drinking history, smoking history, tumor location, cT status, cN status, and peripheral LMR were not associated with baseline SUVmax. Univariate and multivariate analyses confirmed that baseline SUVmax is an independent predictor of primary tumor response.
The immune system and inflammation play an important role in the development, progression and metastasis of tumors.21,22 As an essential component of acquired immunity and innate immunity, lymphocytes can mediate the death of cytotoxic cells and inhibit the proliferation and metastasis of tumor cells.31,32 Changes in lymphocyte populations can reflect the condition of the immune system of the host, and a decrease in lymphocytes in the tumor microenvironment indicates a weak and insufficient anti-tumor immune response.32,33 Monocytes are also important immune cells in the host. They can change the tumor microenvironment by inhibiting local immunity and angiogenesis, thereby promoting the occurrence and distant metastasis of tumors.34,35 Moreover, as part of the host immune system, circulating immune cells play a critical role in tumor progression. Peripheral LMR can reflect the host immune status and immune response to tumors. Moreover, it has been reported that LMR, as a simple and accessible indicator of the circulating levels of lymphocytes and monocytes, is correlated with the tumor-infiltrating lymphocyte/tumor-associated macrophage ratio, suggesting that it may reflect the immune state of the tumor microenvironment.36 A low peripheral LMR was first reported to be associated with poor prognosis in Hodgkin’s lymphoma and diffuse large B cell lymphoma.23,24 Subsequently, the correlation of baseline peripheral LMR with primary tumor response was reported in other solid tumors, such as nasopharyngeal carcinoma, lung cancer, colorectal cancer, and ovarian cancer.25–28 Regarding esophageal cancer, Huang et al29 retrospectively analyzed data from 348 patients with esophageal squamous cell cancer who underwent radical surgery and found that the 5-year cancer-specific survival was significantly lower for patients with a peripheral LMR ≤ 2.93 than for patients with a peripheral LMR >2.93. Han et al30 reported that host peripheral LMR is an independent prognostic factor for long-term survival in ESCC patients who have undergone radical surgery. The disease-free survival and overall survival of patients in the low-peripheral-LMR group were significantly lower than those in the high-peripheral-LMR group. However, these two studies focused on surgical EC patients and the relationship between peripheral LMR and long-term survival. Our previous research37 analyzed the correlation between peripheral LMR and tumor response in 162 ESCC patients who received definitive CCRT. In this study, we used the median value of the pre-treatment LMR (4.02) as the cut-off value. It indicated that the baseline peripheral LMR was a significant prognostic factor for a better clinical tumor response. Thirty-six patients had a CR in the high-peripheral-LMR (>4.02) group, while twelve in the low-peripheral-LMR (≤4.02) group had a CR. Although we already knew that peripheral LMR could predict clinical tumor response, in this previous study we were unable to determine the sensitivity and specificity of this parameter because we used a median value as the cut-off point for peripheral LMR. In the present study, the optimal cut-off value for peripheral LMR was determined by ROC analysis, providing a better determination of sensitivity and specificity. Patients with a higher peripheral LMR were more likely to have an OR type of primary tumor response than those with a lower peripheral LMR. In univariate and multivariate analyses, peripheral LMR was a significant predictive factor for primary tumor response.
Definitive CCRT is the main treatment for patients with EC who cannot undergo surgery. However, there is a difference in the treatment response of individuals. The main reason is that it is difficult to make an “individualized” CCRT choice for patients. Therefore, early prediction of tumor response is necessary, as it can identify which patients are sensitive or insensitive to CCRT before treatment and more accurately classify these patients. We hypothesized that tumor cells and host immune status were the main factors affecting tumor response to CCRT. Accordingly, we explored the combined predictive value of baseline SUVmax and peripheral LMR for tumor response in patients with ESCC undergoing CCRT. In this study, the group containing patients who had lower SUVmax values accompanied by higher peripheral LMRs achieved the best primary tumor response compared with the other three groups, and their ORR was 100%. Meanwhile, although the ORRs were different, there were no statistical differences between the high-SUVmax-low-LMR group and the low-SUVmax-low-LMR group. This may be due to the small sample size of the low-SUVmax-low-LMR group. When the high-SUVmax-low-LMR group was compared with the low-SUVmax-high-LMR group and the high-SUVmax-high-LMR group, the differences were statistically significant, and both of these groups had larger sample sizes. In summary, for inoperable treated ESCC patients, those with lower FDG uptake accompanied by a higher peripheral LMR may be more sensitive to CCRT, and an aggressive treatment strategy is needed. However, those with higher FDG uptake accompanied by a lower peripheral LMR may be relatively insensitive to treatment, and their treatment strategies may need to be modified early on during treatment, such as tailoring the intensity of treatment or combining targeted therapies, and monitored more carefully of response.
The main limitations of this study are that it is a retrospective, single-center study with a small sample size. There are potential confounding factors that we cannot control. Therefore, a prospective, multicenter, clinical and large-scale trial is needed to confirm our results. Second, although we have applied endoscopic ultrasonography, enhanced CT and PET/CT, clinical TNM staging is still not as accurate as pathological TNM staging. Third, the possible relationship between SUVmax and peripheral LMR in our study was unclear. Thus, further research is needed to obtain a more detailed explanation.
Conclusion
ESCC patients who have lower FDG uptake accompanied by a higher peripheral LMR are more likely to have a good primary tumor response after CCRT, while those who have higher FDG uptake accompanied by a lower peripheral LMR are more likely to have a poor one. These findings may help clinicians identify subgroups of patients who are sensitive or insensitive to CCRT, thus allowing patients to receive individualized and accurate treatment.
Acknowledgments
The Natural Science Foundation of China (NSFC 81672995) and the Shandong Provincial Natural Science Foundation (ZR2015HZ004) supported this study.
Disclosure
The authors report no conflicts of interest in this work.
References
1. Siegel RL, Miller KD, Jemal A. Cancer statistics, 2016. CA Cancer J Clin. 2016;66(1):7–30. doi:10.3322/caac.21332
2. PC E, RJ M. Esophageal cancer. N Engl J Med. 2003;349(23):2241–2252. doi:10.1056/NEJMra035010
3. Cooper JS, Guo MD, Herskovic A, et al. Chemoradiotherapy of locally advanced esophageal cancer long-term follow-up of a prospective randomized trial (RTOG 85-01).Radiation Therapy Oncology Group. JAMA. 1999;281(17):1623–1627. doi:10.1001/jama.281.17.1623
4. Pöttgen C, Stuschke M. Radiotherapy versus surgery within multimodality protocols for esophageal cancer - A meta-analysis of the randomized trials. Cancer Treat Rev. 2012;38(6):599–604. doi:10.1016/j.ctrv.2011.10.005
5. Bockorny B, Pectasides E. The emerging role of immunotherapy in gastric and esophageal adenocarcinoma. Future Oncol. 2016;12(15):1833–1846. doi:10.2217/fon-2016-0103
6. Yoshimoto Y, Kono K, Suzuki Y. anti-tumor immune responses induced by radiotherapy: a review. Fukushima J Med Sci. 2015;61(1):13–22. doi:10.5387/fms.2015-6
7. Hsu PP, Sabatini DM. Cancer cell metabolism: warburg and beyond. Cell. 2008;134(5):703–707. doi:10.1016/j.cell.2008.08.021
8. Koppenol WH, Bounds PL, Dang CV. Otto Warburg’s contributions to current concepts of cancer metabolism. Nat Rev Cancer. 2011;11(5):325–337.
9. Deantonio L, Milia ME, Cena T, et al. Anal cancer FDG-PET standard uptake value: correlation with tumor characteristics, treatment response and survival. Radiol Med. 2016;121(1):54–59. doi:10.1007/s11547-015-0562-9
10. Suh C, Kang YK, Roh JL, et al. Prognostic value of tumor 18F-FDG uptake in patients with untreated extranodal natural killer/T-cell lymphomas of the head and neck. J Nucl Med. 2008;49(11):1783–1789. doi:10.2967/jnumed.108.053355
11. Kidd EA, Siegel BA, Dehdashti F, Grigsby PW. The standardized uptake value for F-18 fluorodeoxyglucose is a sensitive predictive biomarker for cervical cancer treatment response and survival. Cancer. 2007;110(8):1738–1744. doi:10.1002/cncr.22974
12. Chihara D, Oki Y, Onoda H, et al. High maximum standard uptake value (SUVmax) on PET scan is associated with shorter survival in patients with diffuse large B cell lymphoma. Int J Hematol. 2011;93(4):502–508. doi:10.1007/s12185-011-0822-y
13. Borst GR, Belderbos JS, Boellaard R, et al. Standardised FDG uptake: a prognostic factor for inoperable non-small cell lung cancer. Eur J Cancer. 2005;41(11):1533–1541. doi:10.1016/j.ejca.2005.03.026
14. Na F, Wang J, Li C, Deng L, Xue J, Lu Y. Primary tumor standardized uptake value measured on F18-fluorodeoxyglucose positron emission tomography is of prediction value for survival and local control in non–small-cell lung cancer receiving radiotherapy meta-analysis. J Thorac Oncol. 2014;9(6):834–842. doi:10.1097/JTO.0000000000000185
15. Suzuki A, Xiao L, Hayashi Y, et al. Prognostic significance of baseline positron emission tomography and importance of clinical complete response in patients with esophageal or gastroesophageal junction cancer treated with definitive chemoradiotherapy. Cancer. 2011;117(21):4823–4833. doi:10.1002/cncr.26122
16. Kato H, Fukuchi M, Miyazaki T, et al. Prediction of response to definitive chemoradiotherapy in esophageal cancer using positron emission tomography. Anticancer Res. 2007;27(4C):2727–2733.
17. Atsumi K, Nakamura K, Abe K, et al. Prediction of outcome with FDG-PET in definitive chemoradiotherapy for esophageal cancer. J Radiat Res. 2013;54(5):890–898. doi:10.1093/jrr/rrt021
18. Elimova E, Wang X, Etchebehere E, et al. 18-fluorodeoxy-glucose positron emission computed tomography as predictive of response after chemoradiation in oesophageal cancer patients. Eur J Cancer. 2015;51(17):2545–2552. doi:10.1016/j.ejca.2015.07.044
19. Hong D, Lunagomez S, Kim EE, et al. Value of baseline positron emission tomography for predicting overall survival in patient with nonmetastatic esophageal or gastroesophageal junction carcinoma. Cancer. 2005;104(8):1620–1626. doi:10.1002/cncr.21356
20. Javeri H, Xiao L, Rohren E, et al. Influence of the baseline 18F-fluoro-2-deoxy-D-glucose positron emission tomography results on survival and pathologic response in patients with gastroesophageal cancer undergoing chemoradiation. Cancer. 2009;115(3):624–630. doi:10.1002/cncr.24056
21. Landskron G, De la Fuente M, Thuwajit P, Thuwajit C, Hermoso MA. Chronic inflammation and cytokines in the tumor microenvironment. J Immunol Res. 2014;2014:149185. doi:10.1155/2014/394127
22. Elinav E, Nowarski R, Thaiss CA, Hu B, Jin C, Flavell RA. Inflammation-induced cancer: crosstalk between tumours, immune cells and microorganisms. Nat Rev Cancer. 2013;13(11):759–771. doi:10.1038/nrc3611
23. Porrata LF, Ristow K, Colgan JP, et al. Peripheral blood lymphocyte/monocyte ratio at diagnosis and survival in classical Hodgkin’s lymphoma. Haematologica. 2012;97(2):262–269. doi:10.3324/haematol.2011.050138
24. Li ZM, Huang JJ, Xia Y, et al. Blood lymphocyte-to-monocyte ratio identifies high-risk patients in diffuse large B-cell lymphoma treated with R-CHOP. PLoS One. 2012;7(7):e41658. doi:10.1371/journal.pone.0041658
25. Lin GN, Peng JW, Liu DY, Xiao JJ, Chen YQ, Chen XQ. Increased lymphocyte to monocyte ratio is associated with better prognosis in patients with newly diagnosed metastatic nasopharyngeal carcinoma receiving chemotherapy. Tumour Biol. 2014;35(11):10849–10854. doi:10.1007/s13277-014-2362-6
26. Hu P, Shen H, Wang G, Zhang P, Liu Q, Du J. Prognostic significance of systemic inflammation-based lymphocyte- monocyte ratio in patients with lung cancer: based on a large cohort study. PLoS One. 2014;9(9):e108062. doi:10.1371/journal.pone.0108062
27. Ozawa T, Ishihara S, Kawai K, et al. Impact of a lymphocyte to monocyte ratio in stage IV colorectal cancer. J Surg Res. 2015;199(2):386–392. doi:10.1016/j.jss.2015.06.014
28. Eo WK, Chang HJ, Kwon SH, et al. The Lymphocyte-Monocyte ratio predicts patient survival and aggressiveness of ovarian cancer. J Cancer. 2016;7(3):289–296. doi:10.7150/jca.13432
29. Huang Y, Feng JF. Low preoperative lymphocyte to monocyte ratio predicts poor cancer-specific survival in patients with esophageal squamous cell carcinoma. Onco Targets Ther. 2015;8:137–145. doi:10.2147/OTT.S73794
30. Han L-H, Jia Y-B, Song Q-X, Wang J-B, Wang -N-N, Cheng Y-F. Prognostic significance of preoperative lymphocyte-monocyte ratio in patients with resectable esophageal squamous cell carcinoma. Asian Pac J Cancer Prev. 2015;16(6):2245–2250. doi:10.7314/apjcp.2015.16.6.2245
31. Coussens LM, Werb Z. Inflammation and cancer. Nature. 2002;420(6917):860–867. doi:10.1038/nature01322
32. Mantovani A, Allavena P, Sica A, Balkwill F. Cancer-related inflammation. Nature. 2008;454(7203):436–444. doi:10.1038/nature07205
33. Hoffmann TK, Dworacki G, Tsukihiro T, et al. Spontaneous apoptosis of circulating t lymphocytes in patients with head and neck cancer and its clinical importance. Clin Cancer Res. 2002;8(8):2553–2562.
34. Diaz-Montero CM, Finke J, Montero AJ. Myeloid-derived suppressor cells in cancer: therapeutic, predictive, and prognostic implications. Semin Oncol. 2014;41(2):174–184. doi:10.1053/j.seminoncol.2014.02.003
35. Chanmee T, Ontong P, Konno K, Itano N. Tumor-associated macrophages as major players in the tumor microenvironment. Cancers (Basel). 2014;6(3):1670–1690. doi:10.3390/cancers6031670
36. Zhu Y, Li M, Bo C, et al. Prognostic significance of the lymphocyte-to-monocyte ratio and the tumor-infiltrating lymphocyte to tumor-associated macrophage ratio in patients with stage T3N0M0 esophageal squamous cell carcinoma. Cancer Immunol. 2016;66(3):343–354. doi:10.1007/s00262-016-1931-5
37. Liu X, Li M, Zhao F, et al. The lymphocyte-monocyte ratio predicts tumor response and survival in patients with locally advanced esophageal cancer who received definitive chemoradiotherapy. Onco Targets Ther. 2017;10:871–877. doi:10.2147/OTT.S124915
 © 2019 The Author(s). This work is published and licensed by Dove Medical Press Limited. The
full terms of this license are available at https://www.dovepress.com/terms
and incorporate the Creative Commons Attribution
- Non Commercial (unported, 3.0) License.
By accessing the work you hereby accept the Terms. Non-commercial uses of the work are permitted
without any further permission from Dove Medical Press Limited, provided the work is properly
attributed. For permission for commercial use of this work, please see paragraphs 4.2 and 5 of our Terms.
© 2019 The Author(s). This work is published and licensed by Dove Medical Press Limited. The
full terms of this license are available at https://www.dovepress.com/terms
and incorporate the Creative Commons Attribution
- Non Commercial (unported, 3.0) License.
By accessing the work you hereby accept the Terms. Non-commercial uses of the work are permitted
without any further permission from Dove Medical Press Limited, provided the work is properly
attributed. For permission for commercial use of this work, please see paragraphs 4.2 and 5 of our Terms.