Back to Journals » International Journal of Chronic Obstructive Pulmonary Disease » Volume 10 » Issue 1
Automated continuous quantitative measurement of proximal airways on dynamic ventilation CT: initial experience using an ex vivo porcine lung phantom
Authors Yamashiro T ![]() , Tsubakimoto M, Nagatani Y, Moriya H, Sakuma K, Tsukagoshi S, Inokawa H, Kimoto T, Teramoto R, Murayama S
, Tsubakimoto M, Nagatani Y, Moriya H, Sakuma K, Tsukagoshi S, Inokawa H, Kimoto T, Teramoto R, Murayama S
Received 29 April 2015
Accepted for publication 16 June 2015
Published 25 September 2015 Volume 2015:10(1) Pages 2045—2054
DOI https://doi.org/10.2147/COPD.S87588
Checked for plagiarism Yes
Review by Single anonymous peer review
Peer reviewer comments 3
Editor who approved publication: Prof. Dr. Richard Russell
Supplementary video showing the the Ai of the trachea gradually decreased.
Views: 773
Tsuneo Yamashiro,1 Maho Tsubakimoto,1 Yukihiro Nagatani,2 Hiroshi Moriya,3 Kotaro Sakuma,3 Shinsuke Tsukagoshi,4 Hiroyasu Inokawa,5 Tatsuya Kimoto,5 Ryuichi Teramoto,6 Sadayuki Murayama1
1Department of Radiology, Graduate School of Medical Science, University of the Ryukyus, Nishihara, Okinawa; 2Department of Radiology, Shiga University of Medical Science, Otsu; 3Department of Radiology, Ohara General Hospital, Fukushima; 4CT Systems Division, 5Center for Medical Research and Development, Toshiba Medical Systems Corporation, Otawara; 6Corporate Manufacturing Engineering Center, Toshiba Corporation, Yokohama, Japan
Background: The purpose of this study was to evaluate the feasibility of continuous quantitative measurement of the proximal airways, using dynamic ventilation computed tomography (CT) and our research software.
Methods: A porcine lung that was removed during meat processing was ventilated inside a chest phantom by a negative pressure cylinder (eight times per minute). This chest phantom with imitated respiratory movement was scanned by a 320-row area-detector CT scanner for approximately 9 seconds as dynamic ventilatory scanning. Obtained volume data were reconstructed every 0.35 seconds (total 8.4 seconds with 24 frames) as three-dimensional images and stored in our research software. The software automatically traced a designated airway point in all frames and measured the cross-sectional luminal area and wall area percent (WA%). The cross-sectional luminal area and WA% of the trachea and right main bronchus (RMB) were measured for this study. Two radiologists evaluated the traceability of all measurable airway points of the trachea and RMB using a three-point scale.
Results: It was judged that the software satisfactorily traced airway points throughout the dynamic ventilation CT (mean score, 2.64 at the trachea and 2.84 at the RMB). From the maximum inspiratory frame to the maximum expiratory frame, the cross-sectional luminal area of the trachea decreased 17.7% and that of the RMB 29.0%, whereas the WA% of the trachea increased 6.6% and that of the RMB 11.1%.
Conclusion: It is feasible to measure airway dimensions automatically at designated points on dynamic ventilation CT using research software. This technique can be applied to various airway and obstructive diseases.
Keywords: computed tomography, dynamic ventilation CT, airway, luminal area, wall area percent, COPD
Introduction
Dynamic ventilation computed tomography (CT), also called four-dimensional chest CT or dynamic pulmonary CT, is a new concept for chest CT, and can depict abnormal airway or lung movement during tidal breathing or forced inspiration/expiration. Although a limited number of relevant publications are available,1–3 pathophysiological movement of the central or peripheral airways could be observed exclusively on dynamic ventilation CT, which can be applied to chronic obstructive pulmonary disease (COPD) or other obstructive diseases.
This scanning method is solely plausible using a multi-detector CT (MDCT) scanner with a very long scanning field and powerful iterative reconstruction techniques. Currently, dynamic ventilation CT can be provided by Aquilion ONE scanners (320-row MDCT scanner, Toshiba Medical Systems, Otawara, Japan) and Revolution CT scanners (256-row MDCT scanner, GE Healthcare, Milwaukee, WI, USA). Both scanner models can cover a very long scanning field in the craniocaudal axis (maximum 160 mm in length) by a single gantry rotation, and are equipped with new iterative reconstruction techniques that enable CT fluoroscopy for a longer time.
When using dynamic ventilatory scan data for clinical or research purposes, a major limitation is the difficulty in performing quantitative airway measurements. Since the whole lung and airways dynamically change their shape and location during ventilation, an airway point to measure a certain respiratory phase would be dislocated at the next phase, resulting in difficulty with the measurement of the corresponding points at the other phases with common two-dimensional viewing. Thus, currently available software and workstations that are dedicated to measuring airways on static chest CT are not suitable for investigating dynamic ventilation CT.
If software were available that could automatically trace a designated airway point throughout dynamic ventilation CT and provide quantitative airway measurements on corresponding airway points at all respiratory phases, it would be of great use for monitoring respiratory airway movement in COPD and airway diseases. Based on this idea, we have developed new research software that can be applied to dynamic ventilation CT.
Thus, the aims of this technical note are to introduce our research software, and to evaluate the feasibility of continuous quantitative measurement of proximal airways using dynamic ventilation CT.
Materials and methods
This study was conducted as part of the Area-detector Computed Tomography for the Investigation of Thoracic Diseases (ACTIve) study, an ongoing multicenter research project in Japan. The research committee for the study project outlined and approved all study protocols. Since no human subjects or live animals were needed for this study, we did not apply for approval of the institutional review boards at each institution.
Based upon a request from the ACTIve Study Group, a working group consisting of members of the research group and engineers of Toshiba Medical Systems started creating new research software in 2012. This study was planned as a preliminary investigation to estimate the stability and reliability of the software, which was designed for fully automatic continuous measurement of human airways on dynamic ventilation CT.
Summary of the software
For continuous airway analysis using dynamic ventilation CT, it is essential that a selected airway point can be reproduced and measured at all respiratory phases on the crosscut sections that are perpendicular to the airway centerlines. For the software presented here, this process is facilitated by locating the anatomical position in one phase (frame) and automatically transferring the same position to all the other phases. When a crosscut section is manually selected on the centerline at one phase, the software automatically reproduces and measures the corresponding crosscut sections at all other phases. The algorithm of the software has basic four steps (Figure 1): in the first and second steps, the airway lumen segmentation and centerline construction are implemented on the reference phase. In the third step, the anatomical locations are synchronized from the reference phase to all the other phases. Finally, wall contours are estimated on all phases. By following these steps, the software is able to trace the designated airway point (Figure 2) and to demonstrate crosscut sections at all respiratory phases. Detailed information on the algorithm and software is available in the Supplementary materials section.
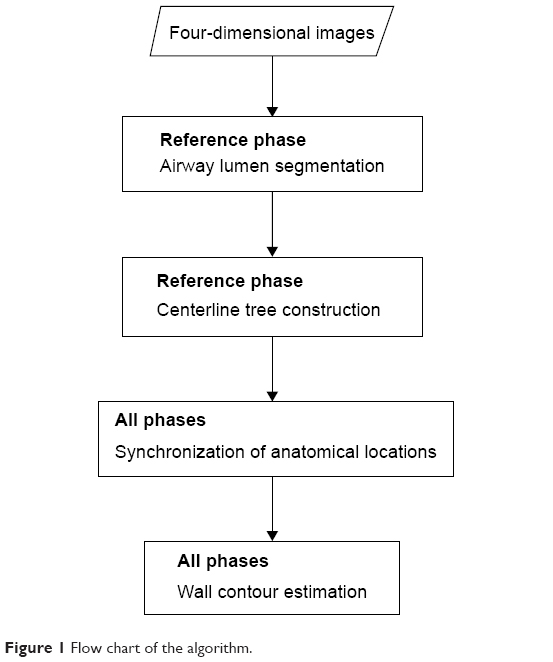 | Figure 1 Flow chart of the algorithm. |
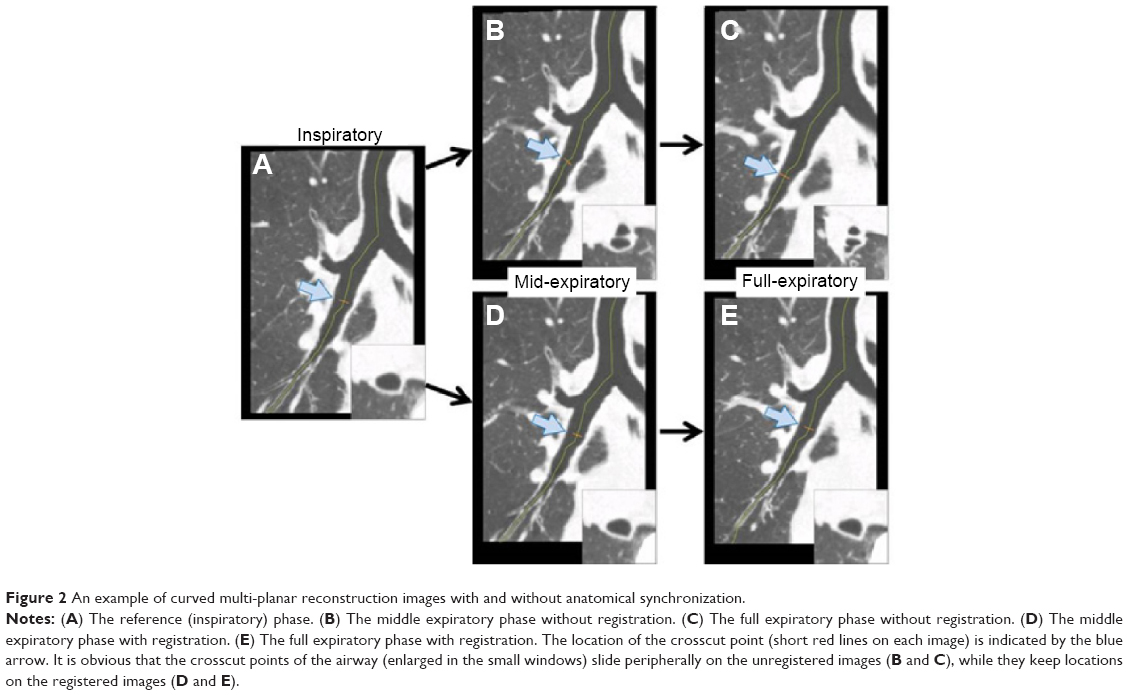 | Figure 2 An example of curved multi-planar reconstruction images with and without anatomical synchronization. |
Porcine lung phantom
A commercially available chest phantom was used for the experiment (artiCHEST trainer, MiMEDA Corporation, Heidelberg, Germany, http://www.mimeda.de/). The chest phantom was originally developed for training in bronchoscopic interventions.4 One fresh porcine heart–lung specimen was obtained from a meat processing factory. The specimen was lubricated with ultrasound gel and placed in the cavity of the phantom. The trachea of the specimen was connected to an outlet of the imitated chest wall, and thus the whole airway was open to room air. The porcine lung was inflated by evacuation of the artificial pleural space through the other outlets of the phantom cavity, similar to pleural drainage for a pneumothorax. For the experiment, a negative pressure cylinder was connected to the phantom, which was able to create imitated respiratory movements by changing negative pressure automatically (from −500 hPa to 1,013 hPa, 7.5 seconds per cycle [eight cycles per minute], and ratio of inspiratory time to expiratory time, 3:5, respectively). Thus, the porcine lung inflated and deflated periodically, similarly to mechanical ventilation using a negative pressure ventilator (Figure 3 and Supplementary Video S1).
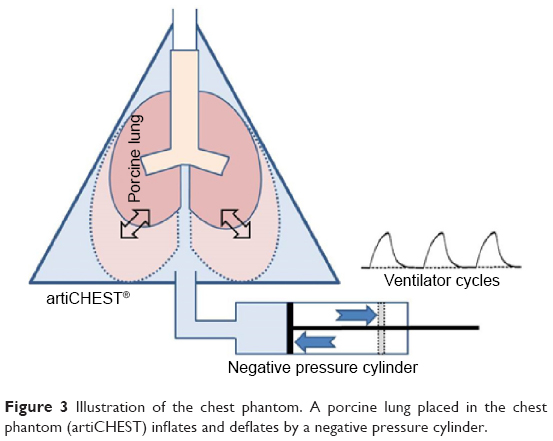 | Figure 3 Illustration of the chest phantom. A porcine lung placed in the chest phantom (artiCHEST) inflates and deflates by a negative pressure cylinder. |
Dynamic ventilation CT
After confirming that the porcine lung inflated and deflated regularly, the entire chest phantom was scanned by a 320-row area-detector CT scanner (Aquilion ONE). Using the wide volume mode (non-helical mode),5 dynamic scanning at a fixed scanning field was performed for 9.1 seconds (rotation time, 0.35 seconds). During the scanning, the gantry rotated at a fixed point without bed movement, resulting in a CT fluoroscopy of 160 mm in length.
Other scanning and reconstruction parameters were set as follows: tube currents, 20 mA; tube voltage, 120 kVp; field of view, 320 mm (medium); collimation, 0.5 mm; slice thickness, 1 mm (without image interval or overlapping); reconstruction kernel, FC13 (for mediastinum); reconstruction interval, 0.35 seconds per frame; and time for image synthesis, 8.4 seconds (0.35 seconds ×24 frames), reconstruction method, half reconstruction, respectively. Scan data were converted to CT images using an iterative reconstruction method (adaptive iterative dose reduction using three-dimensional processing, standard setting).6
Image analysis
Quantitative airway measurement on dynamic ventilation CT
All scan data were stored in a research computer. Using the research software, the continuous image data (320 images per frame × total 24 frames) were at first synthesized and displayed as a cine-CT series (Supplementary Video S2). The software automatically created a centerline from the trachea to all tractable peripheral airways on the full inspiratory phase (reference frame) using three-dimensional techniques, and then expanded the anatomical information to all the other frames. The operators could select a measurement point by dragging the centerline (with approximate 0.6 mm intervals on the centerline). Once the measurement point was determined by the operator, the software automatically measured and displayed the following airway indices on corresponding points on all 24 frames: the airway luminal area (Ai), wall thickness, outer/inner perimeters, shortest/longest axes, and the wall area percent (WA%; Figure 4). If the operators were not satisfied with the crosscut sections or the contours that were made by the software, they could be adjusted manually on any or all of the frames. For this experiment, the Ai and WA% were measured at a single point of the middle trachea and at the middle right main bronchus (RMB). No manual correction was applied for the experiment.
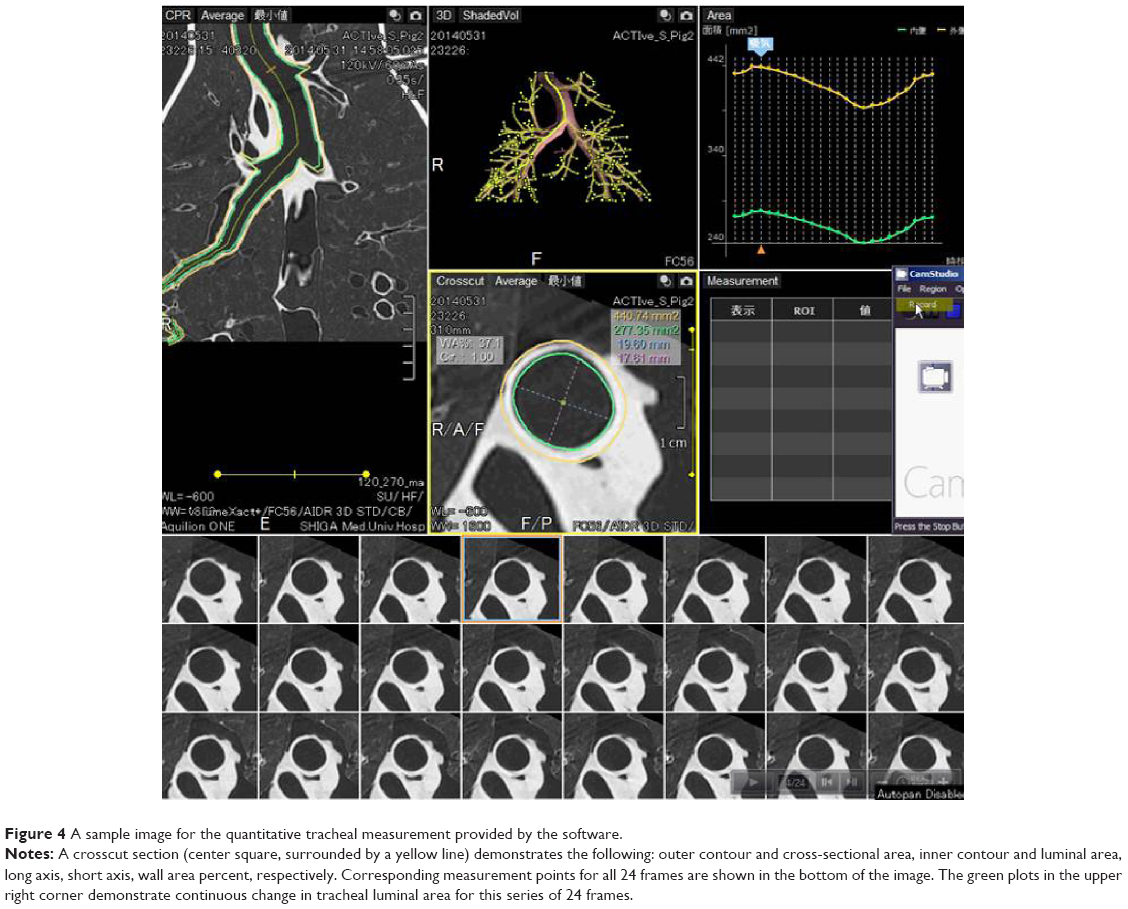 | Figure 4 A sample image for the quantitative tracheal measurement provided by the software. |
In addition, to investigate the time correlation between movements of the lung and of the proximal airways, the mean lung density (MLD) on a single axial section at the height of the carina was measured on each frame. Since the whole porcine lung could not be scanned within the 160 mm scanning length, the MLD was used instead of lung volume. A close correlation between change of the lung volume and that of the MLD has been reported in a previous study.7 The time correlation between the MLD and the airway Ai was evaluated by a cross-correlation coefficient (−1≤ R ≤1) using a commercially available statistical software package (JMP 8.0 software; SAS Institute, Cary, NC, USA).
Qualitative evaluation for airway traceability of the software
A qualitative analysis was made by two board-certified radiologists of the Japan Radiological Society in cooperation (TY and MT, 13 and 8 years of experience in thoracic radiology, respectively). Using a three-point scale, the observers assessed whether or not the software correctly selected the corresponding measurement points on all 24 frames (score 3, no manual correction was needed in any of the frames; score 2, minimum manual correction was recommended in some frames; score 1, large manual correction was mandatory, respectively). Since the measurement points could be placed along the centerline with approximate 0.6 mm intervals, all measurable points on the reference frame (full inspiratory phase) were assessed from the upper trachea to the end of the RMB. Bronchial branching points were not assessed since the airway measurements were largely skewed at the branching points.
Results
Airway traceability of the software
Eighty-four measurement points on the centerline of the trachea and 19 points of the RMB were scored. The mean score for the trachea was 2.64, whereas that of the RMB was 2.84. No measurement point was scored as 1 (ie, large manual correction was mandatory) throughout the airway from the trachea to the RMB.
Continuous quantitative measurement of the airway
From the maximum inspiratory frame to the maximum expiratory frame, the Ai of the trachea gradually decreased from 300.9 mm2 to 247.7 mm2 (17.7%) and the WA% increased from 36.1% to 38.5% (6.6%). The Ai of the RMB decreased from 186.4 mm2 to 132.4 mm2 (29.0%), whereas the WA% increased from 43.4% to 47.7% (11.1%; Supplementary Video S3).
The MLD also changed from −987.8 HU to −949.9 HU (from the maximum inspiratory to the maximum expiratory phase). Large cross-correlation coefficients were obtained between the time curve of the MLD and that of the airway Ai, suggesting that inflation/deflation of the lung and dilation/contraction of the airway occurred simultaneously (−0.96 between the MLD and the tracheal Ai [Figure 5]; −0.96 between the MLD and the RMB Ai, respectively).
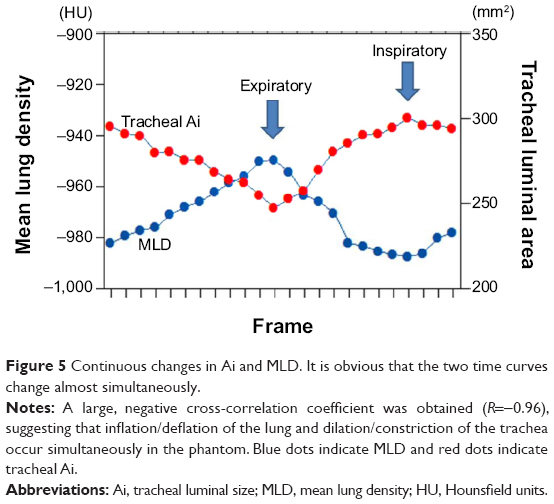 | Figure 5 Continuous changes in Ai and MLD. It is obvious that the two time curves change almost simultaneously. |
Radiation dose assessment
For a single gantry rotation of 160 mm (0.35 seconds), the CT dose index volume was 15.9 mGy and the dose-length product value was 254.5 mGy·cm. The total estimated radiation exposure for 9.1 seconds was 3.6 mSv.
Discussion
In this study, using a porcine lung phantom with imitated respiratory movement, we first demonstrated that the research software successfully traced a designated airway point on dynamic ventilation CT, and that the continuous quantitative airway measurements were plausibly estimated by the software. Although this experiment was limited to the proximal airways of the porcine lung, we strongly believe that this novel combination of dynamic ventilation CT and software enables researchers to observe movement of the airways in COPD and airway diseases that was previously impossible, as a new frontier in chest imaging.
It has already been reported that, in tracheobronchomalacia, dynamic expiratory CT is recommended to observe the proximal airways, since a significantly greater degree of airway collapse has been seen on dynamic CT than on conventional end-expiratory CT.8,9 However, this dynamic ventilation (dynamic expiratory) CT has not been applied to other obstructive diseases, since conventional CT scanners cover a very limited length of scanning field in the z-axis by a single gantry rotation (from 32 to 40 mm for 64-row MDCT scanners), and therefore helical scanning is necessary for observation of a larger lung field. Thus, the use of dynamic ventilation CT or CT fluoroscopy, which is not feasible with helical scanning, has been very limited using conventional CT scanners. After 320-row or 256-row MDCT scanners became commercially available, dynamic ventilation CT has been adopted gradually to observe some airway diseases, such as tracheobronchomalacia or congenital tracheal stenosis.1–3 However, since no software or workstation has been developed for measuring the airways on dynamic ventilation CT, the published papers utilizing CT have simply demonstrated abnormal movements of the proximal airways or stenotic airway points, which have not been measured or analyzed quantitatively. Our software was first designed and developed for tracking and measuring a selected airway point that was moving during respiratory cycles on dynamic ventilation CT, which was of great use for the evaluation of airway dimensions and movements during ventilation.
In COPD, the definition of the respiratory changes in airway dimensions on combined inspiratory and expiratory CT scans is still controversial. While one study concluded that higher respiratory collapsibility of the more peripheral bronchi suggested worse airflow limitation in COPD,10 another recent paper emphasized the importance of lung volume changes between inspiratory and expiratory scans on bronchial collapsibility.11 Further, an almost opposite observation was also reported,12 which found higher collapsed central airways in smokers with better pulmonary function. These various observations have suggested that, in COPD, changes in airway dimension by respiratory movement are not straightforward and that a novel approach for assessing airway movement is required to comprehend the meaning of bronchial collapse or size change. Although this technical note only evaluated the software reliability on central airways because of differences in airway trees between human and porcine lungs,13 the software has been improved to observe more peripheral bronchi while tracking the exact locations on the original CT scan. Thus, this software could be expanded to use generation-based quantitative bronchial measurement, which has frequently been investigated by conventional (static) CT.10,14
It is also of interest to note that the airway Ai and MLD had a close time correlation to each other on dynamic ventilation CT, suggesting that both the lung and proximal airways inflated and deflated simultaneously in a healthy pig. Although our experiment was performed using a mechanical ventilator, it would be an interesting question as to whether or not this correlation between lung and airway movements is maintained in patients with severe emphysema or COPD. A recent COPD study has confirmed that both emphysema and airway disease have independent effects on respiratory resistance during respiratory cycles,15 which may be reproduced as a disconnection between airway and lung movements or paradoxical airway movements on dynamic ventilation CT.
In conclusion, using a porcine lung phantom with imitated ventilation, we examined continuous airway measurements with specialized software on dynamic ventilation CT. The software tracked the designated airway points during imitated ventilation and successfully measured the airway dimensions and wall indices continuously on dynamic ventilation CT.
Acknowledgments
This paper is published on behalf of the ACTIve Study Group investigators, which currently include the following: Kotaro Sakuma, Hiroshi Moriya (Ohara General Hospital, Fukushima, Japan); Yukihiro Nagatani, Norihisa Nitta, Kiyoshi Murata (Shiga University of Medical Science, Shiga, Japan); Osamu Honda, Noriyuki Tomiyama (Osaka University, Osaka, Japan); Mitsuhiro Koyama (Osaka Medical College, Osaka, Japan); Yuko Nishimoto, Satoshi Noma (Tenri Hospital, Nara, Japan); Hisanobu Koyama, Yoshiharu Ohno, Kazuro Sugimura (Kobe University, Hyogo, Japan); Akihiro Tada (Okayama University, Okayama, Japan); Tsuneo Yamashiro, Maho Tsubakimoto, Tetsuhiro Miyara, Sadayuki Murayama (University of the Ryukyus, Okinawa, Japan).
The authors thank Yasuo Saito, Ayumi Uranishi, Megumi Nishigaki, and Tomohiro Koyano (Toshiba Medical Systems) for their technical support with the phantom experiment. The advice from Dr Tatsuya Fuchigami (Department of Anesthesiology, University of the Ryukyus) is greatly appreciated. The authors also thank Yusuke Yonemura (Harada Corporation) for arranging the phantom used in this study.
Disclosure
University of the Ryukyus, Shiga University of Medical Science, and Ohara General Hospital received a research grant from Toshiba Medical Systems. ST, HI, TK, and RT are employees of Toshiba Medical Systems Corporation or Toshiba Corporation. The authors report no other conflicts of interest in this work.
References
Greenberg SB. Dynamic pulmonary CT of children. Am J Roentgenol. 2012;199(2):435–440. | ||
Lee EY, Zucker EJ, Restrepo R, Daltro P, Boiselle PM. Advanced large airway CT imaging in children: evolution from axial to 4-D assessment. Pediatr Radiol. 2013;43(3):285–297. | ||
Tan JZ, Crossett M, Ditchfield M. Dynamic volumetric computed tomographic assessment of the young paediatric airway: Initial experience of rapid, non-invasive, four-dimensional technique. J Med Imaging Radiat Oncol. 2013;57(2):141–148. | ||
Fabel M, Biederer J, Jochens A, et al. Semi-automated volumetric analysis of artificial lymph nodes in a phantom study. Eur J Radiol. 2011;80(3):e451–e457. | ||
Yamashiro T, Miyara T, Takahashi M, et al. Lung image quality with 320-row wide-volume CT scans: the effect of prospective ECG-gating and comparisons with 64-row helical CT scans. Acad Radiol. 2012;19(4):380–388. | ||
Yamashiro T, Miyara T, Honda O, et al. Adaptive iterative dose reduction using three dimensional processing (AIDR3D) improves chest CT image quality and reduces radiation exposure. PLoS One. 2014;9(8):e105735. | ||
Yamashiro T, Matsuoka S, Bartholmai BJ, et al. Collapsibility of lung volume by paired inspiratory and expiratory CT scans: correlations with lung function and mean lung density. Acad Radiol. 2010;17(4):489–495. | ||
Baroni RH, Feller-Kopman D, Nishino M, et al. Tracheobronchomalacia: comparison between end-expiratory and dynamic expiratory CT for evaluation of central airway collapse. Radiology. 2005;235(2):635–641. | ||
Ferretti GR, Jankowski A, Perrin MA, et al. Multi-detector CT evaluation in patients suspected of tracheobronchomalacia: comparison of end-expiratory with dynamic expiratory volumetric acquisitions. Eur J Radiol. 2008;68(2):340–346. | ||
Matsuoka S, Kurihara Y, Yagihashi K, Hoshino M, Nakajima Y. Airway dimensions at inspiratory and expiratory multisection CT in chronic obstructive pulmonary disease: correlation with airflow limitation. Radiology. 2008;248(3):1042–1049. | ||
Kambara K, Shimizu K, Makita H, et al. Effect of lung volume on airway luminal area assessed by computed tomography in chronic obstructive pulmonary disease. PLoS One. 2014;9(2):e90040. | ||
Yamashiro T, San Jose Estepar R, Matsuoka S, et al. Intrathoracic tracheal volume and collapsibility on inspiratory and end-expiratory ct scans correlations with lung volume and pulmonary function in 85 smokers. Acad Radiol. 2011;18(3):299–305. | ||
Nakakuki S. Bronchial tree, lobular division and blood vessels of the pig lung. J Vet Med Sci. 1994;56(4):685–689. | ||
Hasegawa M, Nasuhara Y, Onodera Y, et al. Airflow limitation and airway dimensions in chronic obstructive pulmonary disease. Am J Respir Crit Care Med. 2006;173(12):1309–1315. | ||
Hasegawa K, Sato S, Tanimura K, et al. Emphysema and airway disease affect within-breath changes in respiratory resistance in COPD patients. Respirology. 2015;20(5):775–781. |
Supplementary materials
Multi-level airway tree segmentation with internal feedback mechanism
To obtain a well-segmented airway tree including peripheral bronchi, our method consists of three steps. For the first step, the trachea and partial main bronchi are segmented with a two-dimensional to three-dimensional region growing method controlled by voxel CT values and spatial coordinates. In the second step, the large (proximal) bronchi is initialized by the result of the first level segmentation and segmented by adaptive region growing. In the third step, after morphological reconstruction,1 threshold processing is performed with optimized parameters to detect small peripheral bronchi and consequently generate a complete airway tree.
After the lumen segmentation, a three-dimensional thinning algorithm2 is applied to extract the centerline. Based on the observation that several degrees of leakage (failure at processing) are encountered at peripheral bronchi, a novel tree refinement process is implemented by using feedback from the centerline extraction. First, a leakage score is obtained from features of the centerline. Second, we classify the leakage type into serious leakage and minor leakage according to the score. If it is a serious leakage, re-segmentation will be conducted with the parameters adaptively tuned according to the leakage score. Basically, the peripheral bronchi refinement process will be applied as follows:
- Obtaining the accurate centerline path of each branch from the root (proximal) point to the end point, with accurately marked branching points.
- Re-growing the airway tree until the final branching point of each path; thus, the last segment of each branch is not reached.
- Processing each last segment.
- Merging the airway tree and the last segments to obtain a complete airway tree.
Figure S1 shows an example of airway lumen segmentation on CT images.
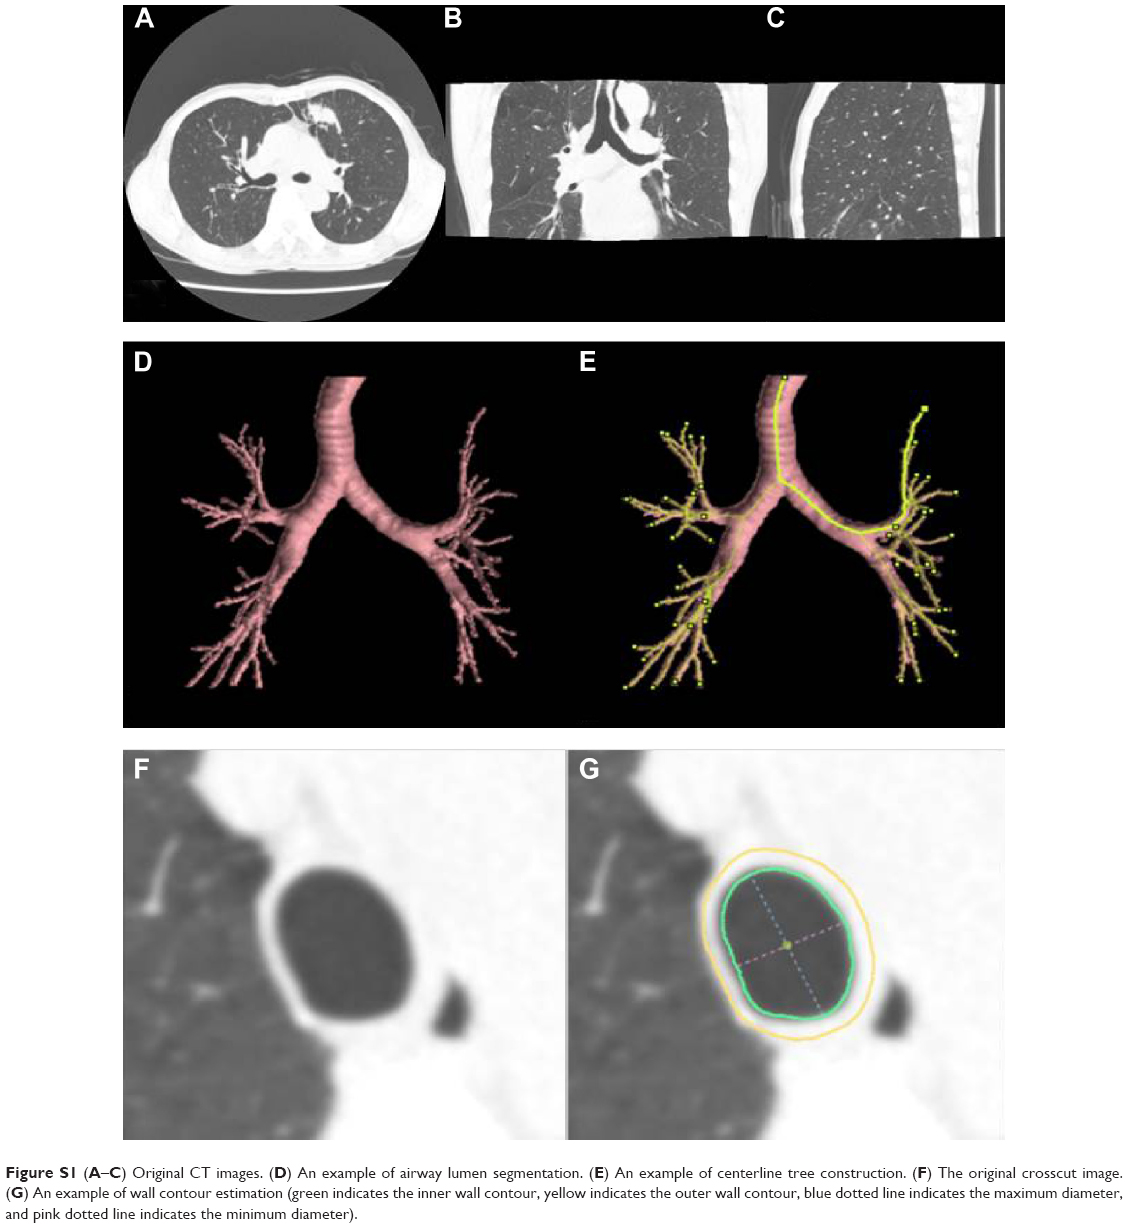 | Figure S1 (A–C) Original CT images. (D) An example of airway lumen segmentation. (E) An example of centerline tree construction. (F) The original crosscut image. (G) An example of wall contour estimation (green indicates the inner wall contour, yellow indicates the outer wall contour, blue dotted line indicates the maximum diameter, and pink dotted line indicates the minimum diameter). |
Centerline construction and optimization
The centerline is extracted from the airway tree by a binary three-dimensional thinning algorithm.2 By considering each voxel as a vertex and its 26-surrounding voxels as the edge, the centerline volume is firstly converted into a graph. The centerline path is identified by locating the shortest path from the root point to the terminal point using Dijkstra’s algorithm.3 The root point is determined according to both anatomical information and airway tree morphology. Since the binary three-dimensional thinning algorithm is very sensitive to image noise, false paths can sometimes be generated. The centerline is optimized by removing these false centerline paths, using several geometric features. For instance, the Euclidean and geodesic distance between the terminal vertex and the root vertex are calculated to exclude these false paths. Using a special structure to hold the centerline tree as a patient coordinate system, the whole centerline tree is generated by merging all centerline paths.
To further improve the accuracy, re-centering, and smoothing are performed. Re-centering is an iterative post-processing operation. It includes calculating both external and internal forces and applying to the existing centerline tree. Parameters required in the re-centering process, such as the timing of the iterative cycle and weights for calculating internal force, are determined according to the average radius of the segment.
After re-centering, B-spline fitting4 is used to smooth the centerline. In order to maintain airway tree structure, both re-centering and smoothing are conducted independently. Figure S1 shows an example of the output image for the centerline construction of the airway lumen.
Synchronization for anatomical location
The synchronization is decomposed into two steps: synchronization of the centerline path and synchronization of the target location on the path.
A non-rigid registration algorithm facilitates the transformation of the airway tree and centerline from one phase to the other phases. The registration algorithm uses a dense deformation field and a multi-scale iterative system with fluid and elastic regularization based on Gaussian filtering. Lung segmentation is applied to ensure that only the region of the lung is included in the registration process.5 The output deformation fields are then used to dictate the voxel movement of the airway trees among all phases.
In general, segmenting the airway tree at the full-inspiration phase (frame) provides better performance than segmenting at the other phases. Therefore, it is recommended to select the full-inspiration phase as the reference phase for the registration. Although the shapes and sizes are different among all phases, the whole process enables the transformed airway tree to keep a similar structure and the same branching points in all phases. Re-centering and smoothing are also performed on the transferred trees to improve the accuracy. After the corresponding centerline is identified, re-locating the target point (measurement point) is performed as a next step. This is achieved by locating the point on the centerline that is nearest to the reference position.
Figure 2 shows a curved multi-planar reconstruction (MPR) image along the constructed centerline in the reference phase. The crosscut image is sampled from the three-dimensional image volume with a linear projection, so that the plane of the crosscut image is perpendicular to the centerline near that vertex. These examples indicate that the registration is effective for anatomical location synchronization in measuring a certain airway point throughout a respiration cycle.
Context constrained wall contour estimation
A phase congruency algorithm6 is used to estimate the inner/outer wall contours. As a model free approach, the phase congruency identifies the edges by finding the points with a maximal local phase coherency. This is considered a robust approach for wall contour estimation. However, due to higher image noise and lower spatial resolution on low-dose images, the accuracy is considerably reduced, particularly for small bronchi. Therefore, in our method, an edge identification process is also adopted to enhance the lumen segmentation. After the location of the wall is roughly estimated by lumen segmentation, a phase congruency algorithm is applied to locate the inner/outer contours within the region. The local density distribution is also used to define the wall contour.
References
Aykac D, Hoffman EA, McLennan G, Reinhardt JM. Segmentation and analysis of the human airway tree from three-dimensional X-ray CT Images. IEEE Trans Med Imaging. 2003;22(8):940–950. | ||
Lee TC, Kashyap RL, Chu CN. Building skeleton models via 3-D medial surface/axis thinning algorithms. CVGIP Graphical Models and Image Processing. 1994;56 (6):462–478. | ||
Dijkstra EW. A note on two problems in connexion with graphs. Numer Math. 1959;1:269–271. | ||
Gallier J. Curves and Surfaces in Geometric Modeling: Theory and Algorithms. San Francisco, CA, USA: Morgan Kaufmann Publishers; 1999. | ||
Goatman K, Plakas C, Schuijf J, Beveridge E, Prokop M. Computed tomography lung iodine contrast mapping by image registration and subtraction. Proc SPIE 9034, Medical Imaging. 2014: Image Processing, 90343I. | ||
San Jose Estepar R, Washko GR, Silverman EK, Reilly JJ, Kikinis R, Westin CF. Accurate airway wall estimation using phase congruency. Lect Notes Comput Sci. 2006;4191:125–134. |
 © 2015 The Author(s). This work is published and licensed by Dove Medical Press Limited. The
full terms of this license are available at https://www.dovepress.com/terms
and incorporate the Creative Commons Attribution
- Non Commercial (unported, 3.0) License.
By accessing the work you hereby accept the Terms. Non-commercial uses of the work are permitted
without any further permission from Dove Medical Press Limited, provided the work is properly
attributed. For permission for commercial use of this work, please see paragraphs 4.2 and 5 of our Terms.
© 2015 The Author(s). This work is published and licensed by Dove Medical Press Limited. The
full terms of this license are available at https://www.dovepress.com/terms
and incorporate the Creative Commons Attribution
- Non Commercial (unported, 3.0) License.
By accessing the work you hereby accept the Terms. Non-commercial uses of the work are permitted
without any further permission from Dove Medical Press Limited, provided the work is properly
attributed. For permission for commercial use of this work, please see paragraphs 4.2 and 5 of our Terms.