Back to Journals » Biologics: Targets and Therapy » Volume 19
ATF3 Knockdown Exacerbates Astrocyte Activation by Inhibiting Phosphorylation of Drp1 in Ischemic Stroke
Authors Huang R, Huang X, Yang H, Wu H, Liu F, Saw PE ![]() , Cao M
, Cao M
Received 7 September 2024
Accepted for publication 29 January 2025
Published 12 February 2025 Volume 2025:19 Pages 15—29
DOI https://doi.org/10.2147/BTT.S486597
Checked for plagiarism Yes
Review by Single anonymous peer review
Peer reviewer comments 4
Editor who approved publication: Dr Shein-Chung Chow
Rong Huang,1 Xiaoyan Huang,1 Hongmei Yang,1 Haixuan Wu,1 Fan Liu,1 Phei Er Saw,2,3 Minghui Cao1,4
1Department of Anesthesiology, Sun Yat-Sen Memorial Hospital, Sun Yat-Sen University, Guangzhou, 510120, People’s Republic of China; 2Medical Research Center, Sun Yat-Sen Memorial Hospital, Sun Yat-Sen University, Guangzhou, 510120, People’s Republic of China; 3Guangdong Provincial Key Laboratory of Malignant Tumor Epigenetics and Gene Regulation, Sun Yat-Sen Memorial Hospital, Sun Yat-Sen University, Guangzhou, 510120, People’s Republic of China; 4Department of Anesthesiology, Shenshan Medical Center, Sun Yat-Sen Memorial Hospital, Sun Yat-sen University, Shanwei, 516600, People’s Republic of China
Correspondence: Phei Er Saw; Minghui Cao, Email [email protected]; [email protected]
Introduction: ATF3, a stress-induced transcription factor, has been implicated in the injury processes of various cell types, including neurons. It is recognized as a common marker for neuronal damage following neurotrauma. However, its role in other types of glial cells, particularly astrocytes, in response to ischemic injury remains unclear. Mitochondrial dysfunction is a key factor in the pathogenesis of ischemic stroke, and impaired mitochondrial function in astrocytes is associated with astrocyte activation. This study aimed to explore the relationship between mitochondrial damage and ischemic stroke and to investigate how ATF3 regulates mitochondrial dysfunction and astrocyte activation in the context of ischemic injury.
Methods: In a transient middle cerebral artery occlusion (tMCAO) mouse model, we knocked down ATF3 and assessed infarct size, motor deficits, astrocyte activation, and mitochondrial damage. In vitro, we used oxygen-glucose deprivation and reoxygenation (OGD-R) to simulate ischemia and evaluated the impact of ATF3 knockdown on astrocyte activation and mitochondrial function.
Results: ATF3 knockdown exacerbated infarct size, motor deficits, and astrocyte activation in vivo, with increased mitochondrial damage. In vitro, ATF3 depletion worsened mitochondrial dysfunction and astrocyte activation. ATF3 interacted with Drp1 via Akt2, inhibiting mitochondrial fission and protecting astrocytes.
Conclusion: ATF3 regulates mitochondrial fission and protects astrocytes in ischemic stroke, highlighting its potential as a therapeutic target for stroke recovery.
Keywords: activating transcription factor 3, ATF3, acute ischemic stroke, AIS, astrocytes, mitochondrial dysfunction, dynamics-related protein 1, Drp1, threonine/serine kinase 2, Akt2
Introduction
Stroke is a condition distinguished by cerebral hemorrhagic injury or ischemia, primarily manifests as acute ischemic stroke (AIS), which is the prevailing form.1 AIS, a neurological condition, stands as a significant contributor to permanent morbidity and disability on a global scale.2 Currently, tissue plasminogen activator (tPA) remains the sole beneficial treatment for AIS patients,3 yet only 5% of patients effectively respond to tPA.4 Despite prior research efforts focusing on rescuing brain neurons from irreversible damage, these interventions, while promising in experimental stroke models, have not translated into significant clinical benefits.5 To explore new therapeutic avenues, it is crucial to consider treatments that target a broader range of cell types. Notably, astrocytes, the most abundant cells in the nervous system, have garnered attention in our research endeavors. These cells play a vital role in maintaining normal brain function through their interactions with and influence on parenchymal cells.6,7 Recent studies have shown that activated astrocytes can enhance the secretion of inflammatory factors, leading to a worsening of the local inflammatory response.8,9 Interestingly, there is a lack of obvious neuronal death in the initial stages of ischemic injury, with an observed increase in glial fibrillary acidic protein (GFAP) expression under these conditions.10 Furthermore, it has been demonstrated that treatments aimed at reducing infarct size often result in a decrease in astrocyte responses.11,12 As a result, targeting specific pathways that either enhance the beneficial effects or reduce the detrimental functions of astrocytes could serve as promising therapeutic strategies for stroke.
According to the sequencing map, certain studies have identified potential molecular targets of AIS through bioinformatics analysis. One of the genes that shows significant differential expression is the activating transcription factor 3 (ATF3), which belongs to the ATF/cAMP response element-binding protein transcription factor family.13 While ATF3 is typically minimally expressed under normal conditions, it shows a rapid increase in expression during the early stages of inflammation when induced by stress factors like ischemia, endotoxin, and cytokines, particularly in the brain. ATF3 also serves as a neuronal marker for nerve damage.14,15 After permanent cerebral ischemia, studies indicate that there is an initial, temporary increase in the expression of ATF3 in the core region of ischemia. Conversely, a delayed, sustained, and lower level of induction is noted in the penumbra region.16 Furthermore, studies indicate that the immunoreactivity of ATF3 overlaps with damage-induced neuronal endopeptidase, which can enhance antioxidant activity and potentially act as a neuroprotective agent under ischemic injury.17 Additionally, bioinformatics analysis has indicated that ATF3 could potentially offer a protective effect against ischemic stroke.18,19 However, the precise molecular mechanisms that underlie ATF3-related signaling pathways in ischemic stroke are not well elucidated. Therefore, investigating the influence of ATF3 on astrocyte activation during ischemic stroke could have significant implications.
Reactive astrocytes in AIS exhibit an imbalance in mitochondrial energy metabolism, leading to an inflammatory response that exacerbates ischemic injury.20 Mitochondria are essential for preserving cellular homeostasis as they regulate numerous metabolic processes and stress response mechanisms.21,22 Following ischemia-reperfusion, mitochondrial fission in astrocytes emerges as an early trigger for neuronal death post-cerebral ischemia.23 Recent studies have revealed that transient global ischemia activates mitochondrial dynamics-related protein 1 (Drp1) in rat brain tissue, promoting mitochondrial fission.24 Phosphorylation of Drp1 (p-Drp1) is a key mechanism for regulating excessive mitochondrial fission.25 This overactive fission indicates mitochondrial impairment, marked by increased levels of reactive oxygen species (ROS) and the opening of mitochondrial permeability transition pores, which results in dysfunctional mitochondria.26 However, the molecular signals received by mitochondria during astrocyte activation and the regulatory mechanisms involved remain unclear. Given that ATF3 is upregulated during early inflammation, we hypothesized that mitochondria function might contribute to the physiological function of ATF3 in AIS.
Therefore, in this study, we hypothesize that ATF3 in astrocytes of AIS plays a role in reducing astrocyte activation by suppressing mitochondrial fission, ultimately slowing down the progression of AIS-induced damage. Investigating these mechanisms will enhance our understanding of the pathogenesis of AIS and identify promising therapeutic strategies.
Methods and Materials
Animals
Animal experiments were conducted in compliance with laws regarding the use and care of laboratory animals, the animal protocol was approved by Sun Yat-sen Memorial Hospital, Sun Yat-sen University Laboratory Animal Research Platform (AP20240052). The procedure for creating an animal model of acute ischemic stroke (AIS) involved subjecting male C57BL/6 mice (8–12 weeks old) to transient middle cerebral arterial occlusion (tMCAO) surgery, as described in previous studies.27 In summary, the mice were anesthetized and kept under 2% isoflurane in 60% oxygen, with the surgery carried out using a stereomicroscope. A midline skin incision measuring 2 cm in length was made in the neck region to expose and carefully dissect the right common carotid artery (CCA), external carotid artery (ECA), and internal carotid artery (ICA) from the surrounding nerves. The distal ECA was tied off with a 6–0 suture after temporarily clamping the CCA. Subsequently, a 0.22–0.23 mm nylon suture was inserted into the ECA and advanced 9–10 mm through the ICA to the middle cerebral artery origin. After 60 minutes of occlusion, the nylon suture was removed and blood flow was restored by releasing the CCA clamp. The control group, represented by sham-operated mice, underwent the same procedure without vessel occlusion. Throughout the procedure, the mice were kept warm using a thermal blanket to maintain their body temperature.
Microinjection of ATF3 shRNA Lentivirus
The Con and ATF3 shRNA-GFP lentiviruses were injected into the left lateral ventricle of eight-week-old C57BL/6J mice at specific coordinates. The injection was done using 1 μL of 1×10⁹ viral genomes/µL. The coordinates for the microinjection were as follows: anteroposterior, −0.3 mm; lateral, 1.0 mm; and ventral, 2.2 mm. Two weeks following the lentivirus microinjection, the mice were split into four groups to assess the impact of shRNA ATF3 in the tMCAO model: shRNA Con + Sham; shRNA ATF3 + Sham; shRNA Con + tMCAO; and shRNA ATF3 + tMCAO.
Measurements of Neurological Deficit and Rotarod Tests
The neurological deficit was evaluated 24 hours post tMCAO using the mNSS method, which assesses motor function, sensory perception, and reflex issues.28 This scoring system ranges from 0 to 18, with higher scores indicating more severe injuries. Specifically, a score of 13 to 18 indicates severe injury, 7 to 12 indicates moderate injury, and 0 to 6 indicates mild injury. Each point on the scale reflects the inability to perform a test or the absence of a reflex, emphasizing the correlation between score and injury severity. This method provides a comprehensive assessment of neurological deficits post tMCAO, offering valuable insights into the extent of brain damage and potential functional impairments.
Mice were subjected to a motor coordination assessment by being placed on an accelerated rotary bar (Harvard Apparatus, MA, USA) for five minutes. The rod speed ranged from 4 to 40 rpm. The time taken for each mouse to descend from the rotarod to the plate was recorded. Prior to the formal test on the third day, all mice underwent training for three days, five times a day.
TTC Staining and Measurement of Cerebral Infarction
The volume of the infarction was assessed 24 hours following tMCAO. Anesthetizing mice was done with 5% isoflurane before perfusing intracardially with 0.9% saline solution. Following the removal of the brains, they were coronally sliced into sections that were 2mm thick, and then immersed in a 1% TTC solution (MP Biomedicals, California) for 15 minutes at 37°C in the absence of light. Following this, the sections were fixed in a phosphate buffer with 4% PFA for a duration of 30 minutes. Healthy brain tissues appeared red, while infarcted tissues remained unstained (white). The TTC-stained brain sections were then captured in photographs, which were later analyzed using ImageJ software. The calculation of infarct volume was done through the integration of the infarcted areas found in all slices from each brain.29
Transmission Electron Microscopy
Brain tissues were freshly collected and then fixed with a solution of 2.5% glutaraldehyde in 0.1 M phosphate buffer. After the fixation process, a 1% osmium tetroxide solution in 0.1 M phosphate buffer was used. Dehydration of the tissues was achieved using ethanol, followed by infiltration with propylene oxide. Thin sections were prepared with an ultramicrotome, followed by staining with uranyl acetate and lead citrate. Mitochondria visualization was achieved through transmission electron microscopy (Tecnai G 20 TWIN). Digital images were captured to facilitate the quantitative analysis of the mitochondrial area, perimeter, and roundness.
Immunofluorescence
To visualize the expression of target proteins within mouse brain tissues, immunostaining was performed. The brain tissue samples were harvested and then fixed in a 4% paraformaldehyde solution for a duration of 24 hours. After fixation, the tissues were embedded in paraffin, and subsequently, paraffin blocks were sectioned into 4 μm slices for the immunostaining process. For the immunofluorescence technique, sections and cell slides were prepared, after which fluorescein isothiocyanate (FITC)-conjugated secondary antibodies were applied to highlight specific primary antibody bindings. A laser scanning confocal microscope (Olympus FluoView™ FV1000, Tokyo, Japan) was used to observe the stained sections and cell slides, and images were obtained for subsequent statistical analysis.
Cell Culture and Stable Cell Lines
Mouse astrocytes (C8-D1A cells) used in this study were procured from Wuhan Procell Life Science and Technology Company, located in China. At 37 °C and 5% CO2, the cells were grown in DMEM (Gibco, Grand Island, NY, USA) with 10% FBS and 1% P/S solution (penicillin/streptomycin).
C8-D1A cells were subjected to transfection using lentivirus particles that either carried ATF3-specific shRNA or an unrelated shRNA as a negative control. These particles were sourced from GZSCBIO (Guangzhou, China). This procedure aimed to generate stable cell lines with reduced ATF3 protein expression. For the knockdown of ATF3, the shRNA sequence used was GCATCCTTTGTCTCACCAATT.
Oxygen–Glucose Deprivation/Reoxygenation Model
The oxygen-glucose deprivation/reoxygenation (OGD/R) model was performed according to a methodology described in a prior publication.30 Cells were subjected to OGD by culturing them in deoxygenated DMEM without glucose and FBS. Subsequently, the cells were exposed to a gas mixture of 95% nitrogen and 5% carbon dioxide in an incubator for 3 hours. Following this, the cells were transferred to an incubator containing 95% air and 5% carbon dioxide, and the glucose-free DMEM was exchanged for a complete medium. In contrast, the control cells were maintained in standard DMEM supplemented with 10% FBS for the same duration.
Chromatin Immunoprecipitation
Chromatin immunoprecipitation (ChIP) analysis was conducted utilizing the Chromatin Immunoprecipitation Assay Kit (GZSCBIO, Guangzhou, China) and protocols recommended by the manufacturer. C8-D1A cells underwent OGD/R treatment, then were fixed with 1% formaldehyde at 37°C for 10 minutes. Subsequently, cell lysates were obtained and sonicated to produce DNA fragments ranging from 500 to 100 base pairs in length. Immunoprecipitation was carried out with rabbit anti-ATF (Abcam, Cat# ab207434), rabbit anti-H3 (Abcam, Cat# ab4729), and rabbit anti-IgG antibodies. After immunoprecipitation, DNA was isolated, purified, and subjected to quantitative PCR analysis using specific primers targeting the promoter regions of ATF3 and GAPDH (control). Normal immunoglobulin G served as a negative control, whereas anti-histone H3 was utilized as a positive control. The total input was derived from the supernatant of the no-antibody control.
Western Blot and Co-Immunoprecipitation Assays
Mouse tissues or C8-D1A cells underwent lysis using a RIPA buffer that was enhanced with a 1% protease and phosphatase inhibitor cocktail. Post-lysis, the samples were subjected to separation via SDS-PAGE and subsequently transferred onto polyvinylidene fluoride membranes through electro-transfer. These membranes were then blocked using a 5% non-fat dry milk solution for one hour at room temperature. Following the blocking step, they were incubated overnight at 4°C with primary antibodies, then washed, and further incubated in a blocking solution containing the appropriate HRP-conjugated secondary antibody for 2 hours at room temperature. To determine protein expression levels, the electrochemiluminescence detection system from Tanon, China, was employed. The specific antibodies utilized for Western blotting in this study included ATF3 from Abcam (Catalog #ab207434), Phospho-Drp1 (Ser637) from Cell Signaling Technology (Catalog #4867), GFAP from Cell Signaling Technology (Catalog #3670), Drp1 from Cell Signaling Technology (Catalog #8570), Akt2 from Proteintech (Catalog #28113-1-AP), and Beta-actin from Proteintech (Catalog #66009-1-Ig).
Protein interactions were examined using co-immunoprecipitation assays. The C8-D1A cells subjected to OGD/R treatment were collected and lysed using the specified lysis buffer. The lysates were then incubated with Protein A/G PLUS agarose beads that were conjugated with either an anti-Akt2 antibody (Proteintech, Cat# 28113-1-AP) or an IgG isotype control antibody at 4°C overnight. Subsequently, Western blot analysis was carried out with an anti-DRP1 antibody (Cell Signaling Technology, Cat# 8570) to identify the target protein.
Mitochondrial Membrane Potential and ROS Production
The C8-D1A cells were used for the analysis of mitochondrial membrane potential (ΔΨm) using a JC-1 dye kit obtained from Beyotime Biotechnology, Shanghai, China, according to the manufacturer’s instructions. Post-treatments, cells were harvested from 6-well plates. Changes in ΔΨm were evaluated by measuring the emission of red or green fluorescence, corresponding to the J-aggregates or monomers of JC-1, respectively. Flow cytometry was used to quantify the reduction in ΔΨm specifically in early apoptotic cells.
To determine the levels of ROS in C8-D1A cells, an assay kit for ROS from Beyotime Biotechnology in Shanghai, China was used. In brief, intracellular ROS oxidized the probe 2′,7′-dichlorodihydrofluorescein diacetate (DCF-DA), leading to the production of fluorescent DCF.The fluorescence emitted by DCF was measured with a fluorescence spectrophotometer (CytoFLEX LX) to evaluate the ROS levels.
Statistics
The mean ± standard error of the mean (SEM) was used to express the data. Student’s t-tests were used for two-group comparisons, and comparisons involving three or more groups employed ANOVA followed by Holm-Sidak tests. Statistical significance was determined as p < 0.05. Statistical analysis and graphical representation were performed using GraphPad Prism.
Results
ATF3 Upregulation Associated with Mitochondrial Damage and Astrocyte Activation in the tMCAO Model
After establishing the tMCAO model in mice, we performed immunofluorescence staining and observed a significant increase in the expression of ATF3 and GFAP (astrocyte markers) in the brain tissue (Figure 1A). Concurrently, using transmission electron microscopy, we identified distinct alterations in mitochondrial morphology and cristae structure. In the Sham, elongated mitochondria with intact mitochondrial cristae were observed, whereas the tMCAO model mice exhibited fragmented mitochondria, characterized by shortened rods or spherical shapes, and disrupted mitochondrial cristae (Figure 1B). Furthermore, morphometric analysis of the electron micrograph images revealed notable reductions in mitochondrial area, perimeter, and roundness in tMCAO mice compared to the Sham (Figure 1C–E). Western blot analysis of tMCAO mice brain tissue indicated changes in the expression of the phosphorylated form of the mitochondrial fission-related protein Drp1 at Ser637. Specifically, there was a decrease in the levels of p-Drp1 (Ser637), accompanied by a significant upregulation of ATF3 and GFAP expression in tMCAO mice when compared to the Sham (Figure 1F–H). Combined, the results present convincing proof that the tMCAO model induces increased expression of ATF3 and GFAP in the brain tissue, accompanied by mitochondrial damage and astrocyte activation.
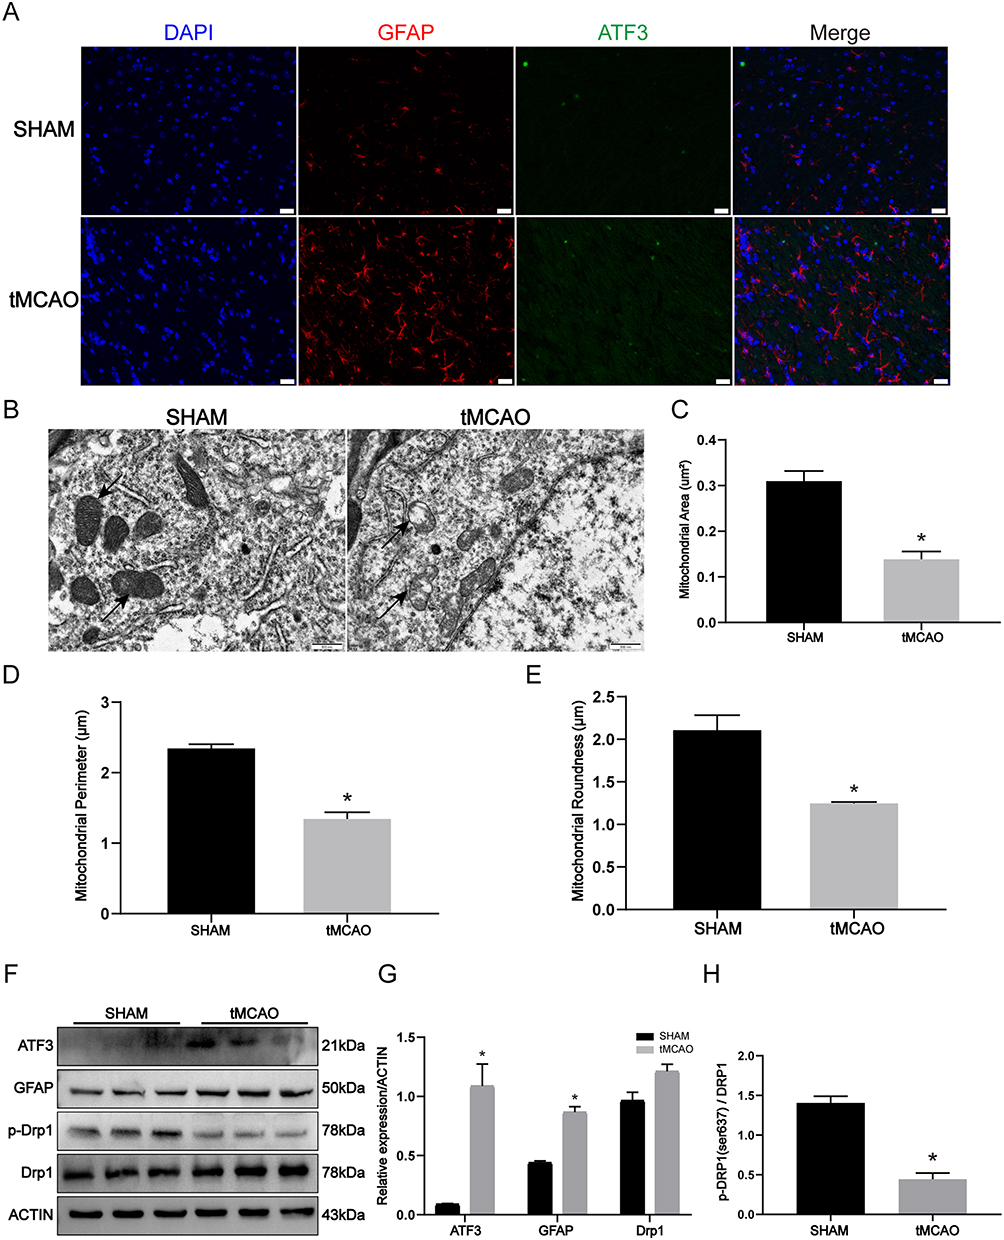 |
Figure 1 ATF3 upregulation associated with mitochondrial damage and astrocyte activation in the tMCAO model. (A) Immunofluorescence for GFAP and ATF3 expression in the brain of SHAM and Transient middle cerebral arterial occlusion (tMCAO)-operated mice. Red, GFAP; Green, ATF3; Blue, DAPI. Scale bars: 20 μm. (B-E) Representative transmission electron micrographs of the ultrastructure of mouse brain obtained from SHAM and tMCAO mice (the arrows indicate the elongated mitochondria in SHAM mice and the shots and fragments of damaged mitochondria in tMCAO mice), and quantification of mitochondrial area, perimeter, and roundness by morphometric analysis. Scale bars: 500 nm. (n=3, * p < 0.05) (F-H) Western blot and densitometric analysis of ATF3, GFAP, and mitochondria dynamic proteins in the brain of sham and tMCAO mice. (n=3, * p < 0.05). |
Knockdown of ATF3 Expression Aggravates Cerebral Ischemia in Mice
To investigate the role of ATF3 in the pathogenesis of stroke, ATF3 lentivirus was microinjected into the lateral ventricle of mice (Figure 2A). Lentiviral transfection efficacy was confirmed in vivo by widespread GFP detection in the cortex (Figure 2B). Following two weeks post lentivirus injection, the mice underwent tMCAO surgery. Infarct size and brain damage severity were assessed 24 hours post-surgery using TTC staining. Knocking down ATF3 resulted in a larger brain obstruction area in mice subjected to tMCAO, indicating more severe damage (Figure 2C and D). Behavioral assessments were conducted to support the aforementioned observations. Mice in the ATF3-shRNA group showed a significant decrease in neurological deficit scores compared to the Con-shRNA group after tMCAO surgery (Figure 2E). Moreover, the time spent on the rotarod by mice in the tMCAO group decreased significantly after ATF3 knockdown, indicating a decline in their exercise ability (Figure 2F). These results collectively suggest that downregulation of ATF3 exacerbates brain infarction and injury, leading to neurological deficits and impaired motor abilities in mice following stroke.
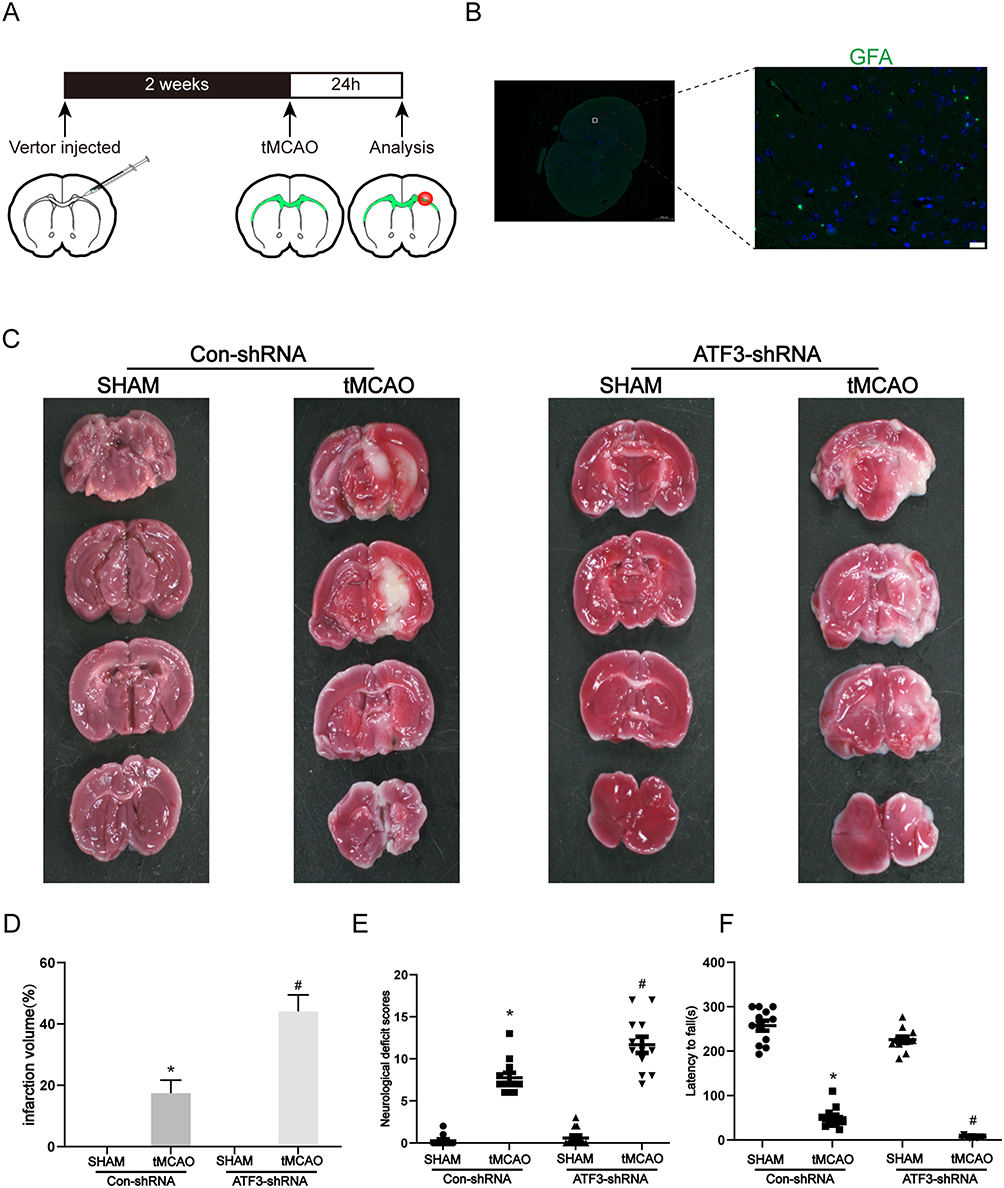 |
Figure 2 Knockdown of ATF3 expression aggravates cerebral ischemia in mice. (A) Schematic diagram illustrating the experimental process. (B) Representative images are shown of the distribution of ATF3-GFP lentivirus shRNA in the cerebral cortex following microinjection of lentivirus. The microinjection of ATF3 shRNA into the lateral ventricle was performed, and the images were captured 2 weeks post-microinjection. Scale bars: 20 μm. (C-D) Representative images of TTC-stained brain slices. After lentivirus microinjection, the mice were subjected to tMCAO for 60 min and reperfusion for 24 h. (n=6, * p < 0.05 compared with Con-shRNA + SHAM group, # p < 0.05 compared with Con-shRNA + tMCAO group) (E) The effects of lentivirus-mediated ATF3 shRNA on the neurological deficit score were assessed at 24 hours after reperfusion. (n=12, * p < 0.05 compared with Con-shRNA + SHAM group, # p < 0.05 compared with Con-shRNA + tMCAO group) (F) Motor coordination and balance were assessed by rotarod tests in the ATF3-shRNA treated at 24 hours after reperfusion. (n=12, * p < 0.05 compared with Con-shRNA + SHAM group, # p < 0.05 compared with Con-shRNA + tMCAO group). |
Knockdown of ATF3 Expression Aggravates Mitochondrial Damage and Astrocyte Activation in vivo
Our study aimed to investigate the regulatory pathways associated with ATF3 in stroke, building upon previous research that has shown a significant correlation between ATF3 and mitochondrial damage as well as astrocyte activation.31,32 Consistent with these findings, we observed mitochondrial damage and astrocyte activation in the tMCAO model. Building on this, our study utilized a tMCAO model to investigate the impact of ATF3 in stroke. Initially, ATF3 was knocked down in brain tissue followed by the establishment of the tMCAO model. Transmission electron microscopy analysis revealed severe mitochondrial damage in ATF3-shRNA mice compared to Con-shRNA mice following tMCAO surgery. Mitochondrial cristae structures were almost absent, indicating pronounced disruption (Figure 3A). Subsequent morphometric analysis of electron micrograph images indicated a significant reduction in the area, perimeter, and roundness of mitochondria in the brain tissue of mice with ATF3 knockdown (Figure 3B–D). Immunofluorescence staining of brain sections showed elevated GFAP expression, indicating astrocyte activation, in ATF3-shRNA mice after tMCAO, while ATF3 expression was virtually undetectable (Figure 3E). To investigate the role of ATF3 in mitochondrial damage in tMCAO mice, we analyzed the expression of p-Drp1 (Ser637). Western blot analysis revealed that the ATF3-shRNA group in tMCAO mice exhibited significantly lower levels of p-Drp1 (Ser637) compared to the Con-shRNA group. Additionally, the expression of GFAP was consistent with the immunofluorescence results (Figure 3F–H). These findings suggest that the downregulation of ATF3 leads to astrocyte activation and mitochondrial damage through the promotion of mitochondrial fission.
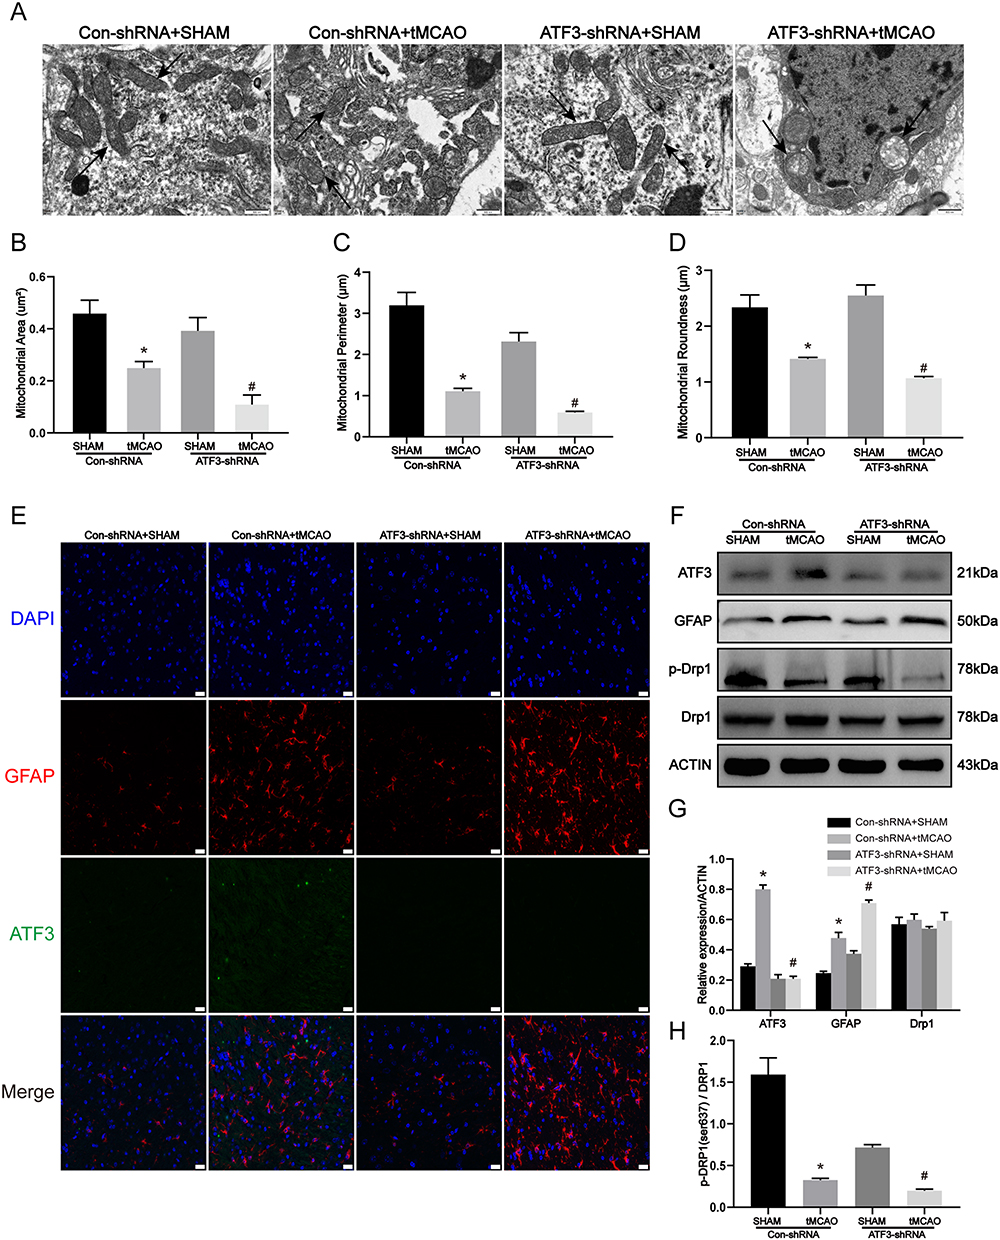 |
Figure 3 Knockdown of ATF3 expression aggravates mitochondrial damage and astrocyte activation in vivo. (A-D) Representative transmission electron micrographs of the ultrastructure of the mouse brain. Mice were treated with tMCAO at 2 weeks after ATF3-shRNA lentivirus microinjection. (The arrows indicate that mitochondrial integrity was compromised by the knockdown of ATF3), and quantification of mitochondrial area, perimeter, and roundness by morphometric analysis. Scale bars: 500 nm. (n=3, * p < 0.05 compared with Con-shRNA + SHAM group, # p < 0.05 compared with Con-shRNA + tMCAO group) (E) Immunofluorescence for the visualization of GFAP and ATF3 expressions in the brain slices. Red, GFAP; Green, ATF3; Blue, DAPI. Scale bars: 20 μm. (F-H) Western blot and densitometric analysis of ATF3, GFAP, and mitochondria dynamic proteins in the brain. (n=3, * p < 0.05 compared with Con-shRNA + SHAM group, # p < 0.05 compared with Con-shRNA + tMCAO group). |
Knockdown of ATF3 Expression Aggravates Mitochondrial Damage and Astrocyte Activation in vitro
To investigate the ATF3-mediated regulation of mitochondrial damage, we conducted in vitro experiments using C8-D1A cells transfected with Con-shRNA or ATF3-shRNA, followed by treatment with OGD-R. Consistent with our in vivo observations, following treatment of C8-D1A cells with OGD-R, a decrease in p-Drp1 (Ser637) protein expression was observed upon knocking down ATF3, along with an increase in GFAP protein expression (Figure 4A–C). Immunofluorescence staining was performed to assess the cellular localization and expression of ATF3, GFAP, and p-Drp1 (Ser637) in OGD-R-treated cells. The staining revealed an increase in the fluorescence intensity of ATF3 and GFAP (Figure 4D), we further quantified the number of GFAP-positive cells and observed an increasing trend in the GFAP positivity rate. (Figure 4E). The fluorescence intensity of p-Drp1 (Ser637) was attenuated (Figure 4F). Notably, ATF3 knockdown further augmented the fluorescence intensity of GFAP and significantly diminished that of p-Drp1 (Ser637). To elucidate the link between ATF3 and mitochondrial damage, we evaluated cellular levels of ROS (Figure 4G) and mitochondrial membrane potential (Figure 4H) as indicators of mitochondrial function. Our results demonstrated an elevation in ROS levels and a decline in mitochondrial membrane potential in C8-D1A cells following OGD-R treatment. Remarkably, the knockdown of ATF3 exacerbated the rise in ROS levels and further compromised the mitochondrial membrane potential. In summary, our experiments conducted in vitro offer more proof that ATF3 is involved in controlling mitochondrial impairment and triggering astrocyte activation during a stroke.
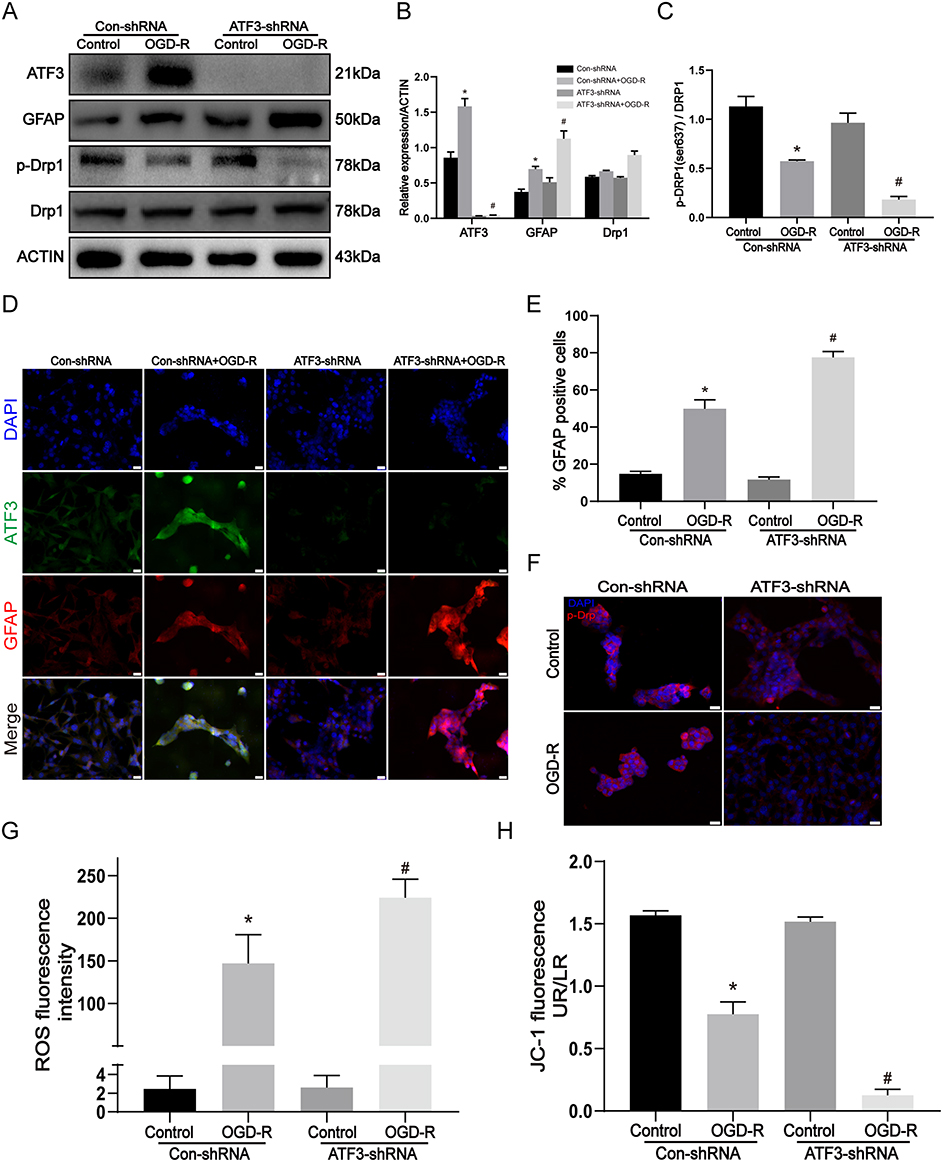 |
Figure 4 Knockdown of ATF3 expression aggravates mitochondrial damage and astrocyte activation in vitro. C8-D1A astrocyte cells were transfected by Con-shRNA or ATF3-shRNA and were treated with OGD-R (OGD for 3 h and reperfusion for 3h). (A-C) Western blot and densitometric analysis of ATF3, GFAP, and mitochondria dynamic proteins in C8-D1A astrocyte cells. (n=3, * p < 0.05 compared with Con-shRNA + Control group, # p < 0.05 compared with Con-shRNA + OGD-R group) (D) Immunofluorescence for the visualization of GFAP and ATF3 expressions in C8-D1A astrocyte cells. Red, GFAP; Green, ATF3; Blue, DAPI. Scale bars: 20 μm. (E) The % GFAP positive cells using Image J software. (n=3, * p < 0.05 compared with Con-shRNA + Control group, # p < 0.05 compared with Con-shRNA + OGD-R group) (F) Immunofluorescence for p-Drp1 (Ser637) expression in C8-D1A astrocyte cells. Red, p-Drp1 (Ser637); Blue, DAPI. Scale bars: 20 μm. (G) Intracellular reactive oxygen species (ROS) generation. (n=3, * p < 0.05 compared with Con-shRNA + Control group, # p < 0.05 compared with Con-shRNA + OGD-R group) (H) Mitochondrial membrane potential was determined by JC-1 fluorescence. (n=3, * p < 0.05 compared with Con-shRNA + Control group, # p < 0.05 compared with Con-shRNA + OGD-R group). |
ATF3 Activation of Akt2 Induces Mitochondrial Damage and Astrocyte Activation
To further elucidate the mechanism by which ATF3 regulates mitochondrial damage, we identified potential target genes of ATF3 through the UCSC. Among these, threonine/serine kinase 2 (Akt2) has been shown to be involved in the phosphorylation of the mitochondrial fission protein Drp1. We speculate that Akt2, as a target gene of ATF3, plays a crucial role in the regulation of mitochondrial damage. To investigate this hypothesis, we initially conducted a ChIP experiment, which revealed a strong affinity of ATF3 for the promoter region of Akt2, with site 2 showing the most significant association (Figure 5A). Subsequent co-IP experiments (Figure 5B) demonstrated an interaction between Akt2 and drp1 proteins in astrocytes under OGD-R conditions. To further confirm the involvement of Akt in the ATF3-mediated mechanism of stroke, we performed immunofluorescence staining (Figure 5C) and observed a significant enhancement of Akt2 fluorescence signal in astrocytes treatment with OGD-R. However, knockdown of ATF3, the signal of Akt2 noticeably weakened. Concurrently, Western blotting results (Figure 5D–E) substantiated an evident increase in Akt protein levels in the OGD-R group, which significantly decreased upon ATF3 knockdown. Lastly, our in vivo experiments provided validation, as both immunofluorescence and Western blotting analyses (Figure 5F–H) consistently indicated a notable rise in Akt2 levels within the Con-shRNA group when compared to the tMCAO and Sham groups. However, Akt2 expression significantly decreased upon ATF3 knockdown. Our findings suggest that ATF3 regulates mitochondrial fission through the activation of the target gene Akt2, thereby contributing to stroke-induced damage.
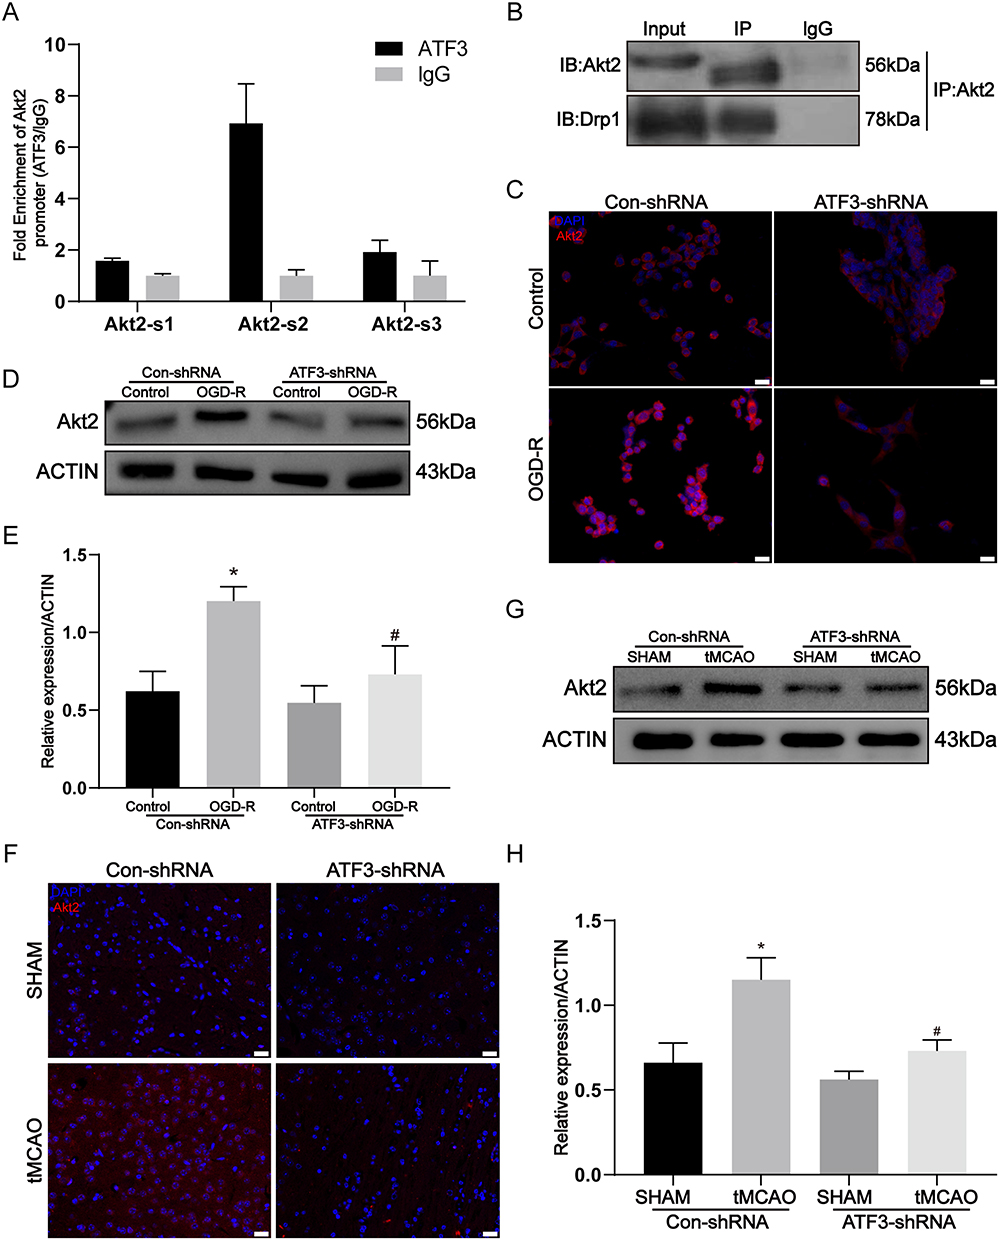 |
Figure 5 ATF3 activation of Akt2 induces mitochondrial damage and astrocyte activation. (A) The interaction between ATF3 and Akt2 promoter region was determined by ChIP assay, site-2 is the most bound. (B) co-immunoprecipitation assay for Akt2 and Drp1 interaction. (C) Immunofluorescence for p-Drp1 (Ser637) expression in C8-D1A astrocyte cells were transfected by Con-shRNA or ATF3-shRNA and treated with OGD-R. Red, Akt2; Blue, DAPI. Scale bars: 20 μm. (D and E) intracellular protein expressions of Akt2 in C8-D1A astrocyte cells (n=3, * p < 0.05 compared with Con-shRNA + Control group, # p < 0.05 compared with Con-shRNA + OGD-R group) (F) Immunofluorescence for the visualization of Akt2 expressions in the brain slices. Mice were treated with tMCAO at 2 weeks after ATF3-shRNA lentivirus microinjection. Red, Akt2; Blue, DAPI. Scale bars: 20 μm. (G and H) Western blot and densitometric analysis of Akt2 in the brain. (n=3, * p < 0.05 compared with Con-shRNA + SHAM group, Δ p < 0.05 compared with Con-shRNA + tMCAO group). |
Discussion
Our study revealed that ATF3 was upregulated in brain tissue, accompanied by mitochondrial damage and astrocyte activation. Knocking down ATF3 exacerbated mitochondrial damage and astrocyte activation, resulting in increased infarct size, brain damage, and neurological deficits in mice. In vitro experiments also showed that ATF3 knockdown worsened activation and mitochondrial damage in astrocytes treated with OGD-R. Furthermore, the study suggested that ATF3 may inhibit mitochondrial fission through the activation of Akt2.
ATF3, an essential gene in response to stress, is involved in multiple cellular functions including stress response, healing wounds, immune response, cancer development, and signaling transduction pathways.33–35 In a recent study,36 ATF3 was found to be significantly overexpressed in cerebral ischemia and its deletion exacerbated brain damage and inflammatory response. Upregulation of ATF3 expression in astrocytes has been shown to effectively alleviate their pro-inflammatory state and limit excessive inflammation.37 Additionally, studies have indicated that the size of the infarct area in brain tissue is associated with astrocytes, and a reduction in astrocyte reactivity is often observed in therapies aimed at reducing infarcted tissue.11 This study identified astrocyte activation in the brain tissue of tMCAO mice. Knocking down ATF3 in the brain tissue resulted in significantly enhanced astrocyte activation, exacerbating brain tissue infarction, neurological deficits, and motor impairments in mice. In vitro, astrocyte activation was also increased with ATF3 knockdown. To the best of our knowledge, this report presents the first evidence that downregulation of ATF3 enhances OGD-R-induced astrocyte activation, revealing a novel function of ATF3 in regulating astrocyte activation.
Astrocytes, which are the most common glial cells scattered across the brain,38 react to a wide range of stresses or injuries by changing their expression profiles, a phenomenon known as “astrocyte activation”. Representing 20% of the brain’s oxygen usage, astrocytes have shown, through previous studies, changes in their metabolic pathways during reactions to inflammation and tissue damage.39,40 In organotypic hippocampal cultures, OGD leads to increased mitochondrial fission and decreased mitochondrial length, followed by mitochondrial damage in astrocytes hours after the onset of injury.41 Clearly, the changes in inflammatory and injury-related gene expression patterns in astrocytes are associated with alterations in mitochondrial dynamics.42,43 Meanwhile, in models of pulmonary fibrosis, ATF3 has been identified as a crucial gene in the mitophagy pathway.31 In this study, the knockdown of ATF3 significantly exacerbated mitochondrial injury. Through electron microscopy analysis of tMCAO mice brain tissue, we observed a significant reduction in mitochondrial area, perimeter, and roundness after ATF3 knockdown. In astrocytes treated with OGD-R in vitro, the dysfunction of mitochondrial function in astrocytes was further aggravated by ATF3 knockdown, as evidenced by increased levels of intracellular ROS and altered JC-1 staining. This study presents novel findings demonstrating that ATF3 plays a role in inducing mitochondrial damage in astrocytes under OGD-R conditions. Further elucidation of ATF3’s involvement in astrocyte activation may offer valuable insights for the development of new therapeutic approaches for diseases associated with astrocyte activation.
Mitochondria, as dynamic organelles, undergo processes of movement, fission, and fusion to maintain mitochondrial dynamics and ensure normal mitochondrial function.44 The recruitment of the mitochondrial fission protein Drp1 to mitochondria induces fission and leads to mitochondrial damage. The activation state of Drp1 is regulated by phosphorylation, with activation of the phosphorylation site Ser637 resulting in Drp1 inactivation and subsequent mitigation of mitochondrial damage.45 In this study, we observed a decrease in p-Drp1 (Ser637) levels in tMCAO mice and astrocytes subjected to OGD-R following knockdown of ATF3. This suggests that ATF3 may influence mitochondrial function by regulating the expression of p-Drp1 (Ser637). Subsequently, through genome bioinformatics analysis (http://genome.ucsc.edu/), we found a significant enrichment of ATF3 in the promoter region of Akt2. ChIP experiments confirmed the enrichment of ATF3 in the promoter region of Akt2 in astrocytes. Furthermore, literature reports have indicated that Akt2 is able to phosphorylate Drp1 at Ser637 to prevent mitochondrial fission.46 Our coIP results confirmed the interaction between Akt2 and Drp1 in astrocytes under OGD-R conditions. Upon ATF3 knockdown, we observed a decrease in Akt2 expression in both in vivo tMCAO mice and astrocytes subjected to OGD-R. This provides evidence that ATF3 activates p-Drp1 (Ser637) through Akt2, thus mitigating mitochondrial damage.
In conclusion, this study demonstrates that ischemic stroke significantly induces the expression of ATF3 in astrocytes, and ATF3 plays a crucial role in the process of astrocyte activation following stroke. Furthermore, the deficiency of ATF3 leads to increased mitochondrial fission and exacerbates mitochondrial damage in astrocytes, which is associated with ATF3’s target gene, Akt2 (Figure 6). Therefore, ATF3 emerges as an important protective factor in stroke, and our research reveals the therapeutic potential of targeting ATF3 in the activation of astrocytes in stroke patients.
 |
Figure 6 The deduced schematic illustration of ATF3 regulating astrocyte activation in stroke. Schematic representation of ATF3 regulation in stroke progression. As depicted in the dashed box above, upregulated ATF3 activates Akt2, promoting the activity of p-Drp1 (Ser637), reducing mitochondrial damage, inhibiting astrocyte activation, and improving cerebral infarction. In the dashed box below, knocking down ATF3 inhibits Akt2 activity and downregulates p-Drp1 (Ser637), which leads to mitochondrial damage, promoting astrocyte activation, and consequently cerebral infarction. |
Abbreviations
AIS, acute ischemic stroke; tPA, tissue plasminogen activator; GFAP, glial fibrillary acidic protein; ATF3, activating transcription factor 3; Drp1, dynamics-related protein 1; p-Drp1, Phosphorylation of Drp1; ROS, reactive oxygen species; tMCAO, transient middle cerebral arterial occlusion; CCA, common carotid artery; ECA, external carotid artery; ICA, internal carotid artery; C8-D1A cells, Mouse astrocytes; OGD/R, oxygen-glucose deprivation/reoxygenation; ChIP, Chromatin immunoprecipitation; Akt2, threonine/serine kinase 2.
Data Sharing Statement
The datasets analyzed during the current study are available from the corresponding authors upon reasonable request.
Funding
This work was supported by the Natural Science Foundation of Guangdong Province (No. A1515010612 and No. A1515012939) and “Three million for Three Years” Project of the Academic Backbone of Shenshan Medical Center, Memorial Hospital of Sun Yat-sen University (No.1303000002).
Disclosure
The authors declare that they have no conflicts of interest in this work.
References
1. Campbell BCV, De Silva DA, Macleod MR, et al. Ischaemic stroke. Nat Rev Dis Primers. 2019;5:70. doi:10.1038/s41572-019-0118-8
2. Knowland D, Arac A, Sekiguchi KJ, et al. Stepwise recruitment of transcellular and paracellular pathways underlies blood-brain barrier breakdown in Stroke. Neuron. 2014;82:603–617. doi:10.1016/j.neuron.2014.03.003
3. He X, Liu Y, Lin X, et al. Netrin-1 attenuates brain injury after middle cerebral artery occlusion via downregulation of astrocyte activation in mice. J Neuroinflammation. 2018;15(1):268. doi:10.1186/s12974-018-1291-5
4. Campbell BCV, Meretoja A, Donnan GA, Davis SM. Twenty-year history of the evolution of stroke thrombolysis with intravenous alteplase to reduce long-term disability. Stroke. 2015;46:2341–2346. doi:10.1161/STROKEAHA.114.007564
5. Röther J. Neuroprotection does not work! Stroke. 2008;39:523–524. doi:10.1161/STROKEAHA.107.494799
6. Liu Z, Chopp M. Astrocytes, therapeutic targets for neuroprotection and neurorestoration in ischemic stroke. Prog Neurobiol. 2016;144:103–120. doi:10.1016/j.pneurobio.2015.09.008
7. Li M, Li Z, Yao Y, et al. Astrocyte-derived interleukin-15 exacerbates ischemic brain injury via propagation of cellular immunity. Proc Natl Acad Sci U S A. 2017;114:E396–E405. doi:10.1073/pnas.1612930114
8. Bylicky MA, Mueller GP, Day RM. Mechanisms of endogenous neuroprotective effects of astrocytes in brain injury. Oxid Med Cell Longev. 2018;2018:6501031. doi:10.1155/2018/6501031
9. Nam M-H, Cho J, Kwon D-H, et al. Excessive astrocytic GABA causes cortical hypometabolism and impedes functional recovery after subcortical stroke. Cell Rep. 2020;32:107861. doi:10.1016/j.celrep.2020.107861
10. Escartin C, Galea E, Lakatos A, et al. Reactive astrocyte nomenclature, definitions, and future directions. Nat Neurosci. 2021;24:312–325. doi:10.1038/s41593-020-00783-4
11. Wang W, Redecker C, Yu Z-Y, et al. Rat focal cerebral ischemia induced astrocyte proliferation and delayed neuronal death are attenuated by cyclin-dependent kinase inhibition. J Clin Neurosci. 2008;15:278–285. doi:10.1016/j.jocn.2007.02.004
12. Fang SH, Wei EQ, Zhou Y, et al. Increased expression of cysteinyl leukotriene receptor-1 in the brain mediates neuronal damage and astrogliosis after focal cerebral ischemia in rats. Neuroscience. 2006;140:969–979. doi:10.1016/j.neuroscience.2006.02.051
13. Lv W, Jiang J, Xu Y, et al. Re-exploring the inflammation-related core genes and modules in cerebral ischemia. mol Neurobiol. 2023;60:3439–3451. doi:10.1007/s12035-023-03275-1
14. Tsujino H, Kondo E, Fukuoka T, et al. Activating Transcription Factor 3 (ATF3) induction by axotomy in sensory and motoneurons: a novel neuronal marker of nerve injury. mol Cell Neurosci. 2000;15:170–182. doi:10.1006/mcne.1999.0814
15. Katz HR, Arcese AA, Bloom O, Morgan JR. Activating Transcription Factor 3 (ATF3) is a highly conserved pro-regenerative transcription factor in the vertebrate nervous system. Front Cell Dev Biol. 2022;10:824036. doi:10.3389/fcell.2022.824036
16. Ohba N, Maeda M, Nakagomi S, Muraoka M, Kiyama H. Biphasic Expression of Activating Transcription Factor-3 in Neurons after Cerebral Infarction. Brain Res mol Brain Res. 2003;115:147–156. doi:10.1016/s0169-328x(03)00181-5
17. Ohba N, Kiryu-Seo S, Maeda M, Muraoka M, Ishii M, Kiyama H. Expression of Damage-Induced Neuronal Endopeptidase (DINE) mRNA in Peri-Infarct Cortical and Thalamic Neurons Following Middle Cerebral Artery Occlusion. J Neurochem. 2004;91:956–964. doi:10.1111/j.1471-4159.2004.02784.x
18. Ma N, Li G, Fu X. Protective role of activating transcription factor 3 against neuronal damage in rats with cerebral ischemia. Brain Behav. 2022;12:e2522. doi:10.1002/brb3.2522
19. Zhai K, Kong X, Liu B, Lou J. Bioinformatics analysis of gene expression profiling for identification of potential key genes among ischemic stroke. Medicine. 2017;96:e7564. doi:10.1097/MD.0000000000007564
20. Vosler PS, Graham SH, Wechsler LR, Chen J. Mitochondrial targets for stroke: focusing basic science research toward development of clinically translatable therapeutics. Stroke. 2009;40:3149–3155. doi:10.1161/STROKEAHA.108.543769
21. Nunnari J, Suomalainen A. Mitochondria: in sickness and in health. Cell. 2012;148:1145–1159. doi:10.1016/j.cell.2012.02.035
22. Pekkurnaz G, Wang X. Mitochondrial heterogeneity and homeostasis through the lens of a neuron. Nat Metab. 2022;4:802–812. doi:10.1038/s42255-022-00594-w
23. Barsoum MJ, Yuan H, Gerencser AA, et al. Nitric oxide-induced mitochondrial fission is regulated by dynamin-related GTPases in Neurons. EMBO J. 2006;25:3900–3911. doi:10.1038/sj.emboj.7601253
24. Chen S-D, Lin T-K, Yang D-I, et al. Roles of PTEN-induced putative kinase 1 and dynamin-related protein 1 in transient global ischemia-induced hippocampal neuronal injury. Biochem Biophys Res Commun. 2015;460:397–403. doi:10.1016/j.bbrc.2015.03.045
25. Yang M, He Y, Deng S, et al. Mitochondrial quality control: a pathophysiological mechanism and therapeutic target for stroke. Front Mol Neurosci. 2021;14:786099. doi:10.3389/fnmol.2021.786099
26. He Z, Ning N, Zhou Q, Khoshnam SE, Farzaneh M. Mitochondria as a therapeutic target for ischemic stroke. Free Radic Biol Med. 2020;146:45–58. doi:10.1016/j.freeradbiomed.2019.11.005
27. Longa EZ, Weinstein PR, Carlson S, Cummins R. Reversible middle cerebral artery occlusion without craniectomy in rats. Stroke. 1989;20:84–91. doi:10.1161/01.str.20.1.84
28. Chen J, Sanberg PR, Li Y, et al. Intravenous administration of human umbilical cord blood reduces behavioral deficits after stroke in rats. Stroke. 2001;32:2682–2688. doi:10.1161/hs1101.098367
29. Arumugam TV, Chan SL, Jo D-G, et al. Gamma secretase-mediated notch signaling worsens brain damage and functional outcome in ischemic stroke. Nat Med. 2006;12:621–623. doi:10.1038/nm1403
30. Zhang X, Yuan Y, Jiang L, et al. Endoplasmic reticulum stress induced by tunicamycin and thapsigargin protects against transient ischemic brain injury: involvement of PARK2-dependent mitophagy. Autophagy. 2014;10:1801–1813. doi:10.4161/auto.32136
31. Wei Y, Sun L, Liu C, Li L. Naringin regulates endoplasmic reticulum stress and mitophagy through the ATF3/PINK1 signaling axis to alleviate pulmonary fibrosis. Naunyn Schmiedebergs Arch Pharmacol. 2023;396:1155–1169. doi:10.1007/s00210-023-02390-z
32. Kim K-H, Jeong J-Y, Surh Y-J, Kim K-W. Expression of stress-response ATF3 is mediated by Nrf2 in astrocytes. Nucleic Acids Res. 2010;38:48–59. doi:10.1093/nar/gkp865
33. Liang G, Wolfgang CD, Chen BP, Chen TH, Hai T. ATF3 gene. Genomic organization, promoter, and regulation. J Biol Chem. 1996;271:1695–1701. doi:10.1074/jbc.271.3.1695
34. Yin X, Wolford CC, Chang Y-S, et al. ATF3, an adaptive-response gene, enhances TGF{beta} Signaling and cancer-initiating cell features in breast cancer cells. J Cell Sci. 2010;123:3558–3565. doi:10.1242/jcs.064915
35. Gilchrist M, Henderson WRJ, Clark AE, et al. Activating transcription factor 3 is a negative regulator of allergic pulmonary inflammation. J Exp Med. 2008;205:2349–2357. doi:10.1084/jem.20072254
36. Wang L, Deng S, Lu Y, et al. Increased inflammation and brain injury after transient focal cerebral ischemia in activating transcription factor 3 knockout mice. Neuroscience. 2012;220:100–108. doi:10.1016/j.neuroscience.2012.06.010
37. Guan X, Wu J, Geng J, et al. A novel hybrid of telmisartan and borneol ameliorates neuroinflammation and white matter injury in ischemic stroke through ATF3/CH25H axis. Transl Stroke Res. 2024;15:195–218. doi:10.1007/s12975-022-01121-5
38. Bushong EA, Martone ME, Jones YZ, Ellisman MH. Protoplasmic astrocytes in CA1 stratum radiatum occupy separate anatomical domains. J Neurosci. 2002;22:183–192. doi:10.1523/JNEUROSCI.22-01-00183.2002
39. Blüml S, Moreno-Torres A, Shic F, Nguy C-H, Ross BD. Tricarboxylic acid cycle of glia in the in vivo human brain. NMR Biomed. 2002;15:1–5. doi:10.1002/nbm.725
40. Zamanian JL, Xu L, Foo LC, et al. Genomic analysis of reactive astrogliosis. J Neurosci. 2012;32:6391–6410. doi:10.1523/JNEUROSCI.6221-11.2012
41. O’Donnell JC, Jackson JG, Robinson MB. Transient oxygen/glucose deprivation causes a delayed loss of mitochondria and increases spontaneous calcium signaling in astrocytic processes. J Neurosci. 2016;36:7109–7127. doi:10.1523/JNEUROSCI.4518-15.2016
42. Jackson JG, Robinson MB. Regulation of mitochondrial dynamics in astrocytes: mechanisms, consequences, and unknowns. Glia. 2018;66:1213–1234. doi:10.1002/glia.23252
43. Gollihue JL, Norris CM. Astrocyte mitochondria: central players and potential therapeutic targets for neurodegenerative diseases and injury. Ageing Res Rev. 2020;59:101039. doi:10.1016/j.arr.2020.101039
44. Kageyama Y, Zhang Z, Sesaki H. Mitochondrial division: molecular machinery and physiological functions. Curr Opin Cell Biol. 2011;23:427–434. doi:10.1016/j.ceb.2011.04.009
45. Sharp WW, Fang YH, Han M, et al. Dynamin-related protein 1 (Drp1)-mediated diastolic dysfunction in myocardial ischemia-reperfusion injury: therapeutic benefits of drp1 inhibition to reduce mitochondrial fission. FASEB J. 2014;28:316–326. doi:10.1096/fj.12-226225
46. Wu B, Luo H, Zhou X, et al. Succinate-induced neuronal mitochondrial fission and hexokinase II malfunction in ischemic stroke: therapeutical effects of kaempferol. Biochim Biophys Acta Mol Basis Dis. 2017;1863:2307–2318. doi:10.1016/j.bbadis.2017.06.011
 © 2025 The Author(s). This work is published and licensed by Dove Medical Press Limited. The
full terms of this license are available at https://www.dovepress.com/terms
and incorporate the Creative Commons Attribution
- Non Commercial (unported, 3.0) License.
By accessing the work you hereby accept the Terms. Non-commercial uses of the work are permitted
without any further permission from Dove Medical Press Limited, provided the work is properly
attributed. For permission for commercial use of this work, please see paragraphs 4.2 and 5 of our Terms.
© 2025 The Author(s). This work is published and licensed by Dove Medical Press Limited. The
full terms of this license are available at https://www.dovepress.com/terms
and incorporate the Creative Commons Attribution
- Non Commercial (unported, 3.0) License.
By accessing the work you hereby accept the Terms. Non-commercial uses of the work are permitted
without any further permission from Dove Medical Press Limited, provided the work is properly
attributed. For permission for commercial use of this work, please see paragraphs 4.2 and 5 of our Terms.