Back to Journals » Diabetes, Metabolic Syndrome and Obesity » Volume 11
Astragalus polysaccharides inhibit oxidation in high glucose-challenged or SOD2-silenced H9C2 cells
Authors Chen W, Sun Q, Ju J, Chen W, Zhao X, Zhang Y, Yang Y
Received 14 June 2018
Accepted for publication 29 August 2018
Published 24 October 2018 Volume 2018:11 Pages 673—681
DOI https://doi.org/10.2147/DMSO.S177269
Checked for plagiarism Yes
Review by Single anonymous peer review
Peer reviewer comments 4
Editor who approved publication: Professor Ming-Hui Zou
Wei Chen,1 Qilin Sun,1 Jing Ju,1 Wenjie Chen,1 Xuelan Zhao,1 Yu Zhang,1 Yehong Yang2
1Department of Geriatrics, Huashan Hospital, Fudan University, Shanghai 200040, China; 2Department of Endocrinology, Huashan Hospital, Fudan University, Shanghai 200040, China
Introduction: Oxidative stress plays an important role in the development of diabetic cardiomyopathy (DCM). Previously, we reported that Astragalus polysaccharides (APS) improved DCM by inhibition of cardiac oxidative stress. In this study, we evaluated the beneficial effect of APS on high glucose-induced oxidative stress in cardiomyocytes in vitro.
Materials and methods: H9C2 cells were cultured in the presence of high concentration of glucose or transfected with siRNASOD2, followed by APS treatment. The cellular mitochondrial ultrastructure was observed using a transmission electron microscope. Cell apoptosis was detected using hairpin oligonucleotide probes and quantified by flow cytometry analysis. Superoxide production was determined by immunohistochemistry using the fluorescent dye dihydroethidium (DHE). Nitrotyrosine and 8-OH-dG antibodies were employed to detect oxidative damage to cytoplasmic proteins and oxidative stress in the nuclei, respectively. Superoxide dismutase (SOD) activity was measured utilizing the SOD Assay Kit, and SOD protein levels were analyzed by Western blotting.
Results: APS treatment protected cellular mitochondrial ultrastructure, reduced cell apoptosis (hairpin-1), inhibited cellular superoxide production (DHE), and reduced oxidative damage to cytoplasmic proteins (nitrotyrosine) and oxidative stress in the nuclei (8-OH-dG) in high glucose-induced and/or SOD2-silenced H9C2 cells, together with induction of SOD2 enzyme activity and increase of protein levels.
Conclusion: Our findings indicated the beneficial effect of APS on high glucose-challenged H9C2 cells, which was associated with inhibition of oxidative stress in vitro.
Keywords: superoxide dismutases, oxidative stress, apoptosis, cardiomyocyte, ROS, diabetic cardiomyopathy
Introduction
It is widely acknowledged that oxidation contributes to the development of diabetic cardiomyopathy (DCM), a kind of characteristic cardiomyopathy independent of coronary artery disease or elevated blood pressure in diabetes.1 Recent investigations have demonstrated that the major causes of DCM are activated oxidative stress, which enhances the formation of mitochondrial ROS, and the subsequent oxidation-mediated apoptosis by hyperglycemia.2 Superoxide dismutases (SODs) are essential anti-oxidative enzymes, which catalyze the conversion of highly reactive superoxides into hydrogen peroxide. Due to the localization within mitochondria, manganese SOD (Mn-SOD, coded by the SOD2 gene) is the most effective member of the SOD enzyme family which protects the mitochondria from oxidation.
Astragalus polysaccharides (APS) are the main bioactive hydrosoluble heterosaccharide component of Astragalus, a traditional Chinese herbal medicine, and is extracted utilizing direct water decoration with optimized techniques.3 Previously, we reported that APS therapy improved heart function and reduced cardiac oxidation in diabetic mice.4 We also demonstrated that APS treatment protected heart function and inhibited cardiac oxidation in heterozygous SOD2 knockout (SOD2+/−) mice.5 In our current study, we employed H9C2 rat cardiomyocytes cultured in the presence of high concentration of glucose or transfected with siRNASOD2 to further explore the beneficial effect of APS treatment on the inhibition of high glucose-induced oxidative stress in vitro.
Materials and methods
APS treatment
APS were acquired from Shanghai Institute of Physiology, Academia Sinica, China, utilizing direct water decoration with optimized techniques (97% purity).3 APS include three subtypes. One subtype is a heterosaccharide with an average molecular weight of 36.3 kDa and molar ratios of 1.75:1.63:1, and is composed of d-glucose, d-galactose, and l-arabinose. The other two subtypes are composed of high-molecular weight dextran with average molecular weights of 12.3 and 34.6 kDa bonded with α-(1→4)-d-glycosidic linkages, respectively. The optimal in vitro concentration of APS was decided on the basis of our earlier study.6
Cell culture, exposure to high glucose, knockdown experiment, and treatment
Embryonic rat heart-derived H9C2 cells obtained from American Type Culture Collection (Manassas, VA, USA; catalog # CRL-1446) were cultured in a growth medium composed of DMEM supplemented with 10% FBS. To simulate diabetic condition in vitro, H9C2 cells were cultured in the presence of high (30 mM) or normal concentration of glucose (5 mM) added with 25 mM of d-mannitol for osmotic control. After 72 hours, cells were transfected with siRNASOD2 (Dharmacon Technologies, Lafayette, CO, USA) to silence SOD2 or the relevant scrambled siRNA (20 pM/μL) as a control, using lipofectamine 2000 (Thermo Fisher Scientific, Waltham, MA, USA), and cultured in the same conditions for another 48 hours. Effective silencing was confirmed by assessing SOD2 activity and SOD2 protein levels. After transfection with siRNASOD2, SOD2 enzyme activity and SOD2 protein level were reduced by almost 85%–90% (Figure 1). Transfected H9C2 cells were exposed to APS (100 µg/mL) or vehicle (normal saline) for another 48 hours. The optimal in vitro concentration of APS was decided on the basis of our earlier studies.6 At the end of the experiment, the cultured cells were collected and processed for further analyses (six wells per each condition, n=4 samples per group). The cells were grouped as follows: 1) Ctrl: normal control group; cells that were cultured in normal concentration of glucose, transfected with scrambled siRNA, and treated with vehicle. 2) HG: high glucose-induced group; cells that were cultured in high concentration of glucose, transfected with scrambled siRNA, and treated with vehicle. 3) APS-HG: APS-treated high glucose-induced group; cells that were cultured in high concentration of glucose, transfected with scrambled siRNA, and treated with APS. 4) siRNASOD2: SOD2-knocked down group; cells that were cultured in normal concentration of glucose, transfected with siRNASOD2, and treated with vehicle. 5) APS-siRNASOD2: APS-treated SOD2-knocked down group; cells that were cultured in normal concentration of glucose, transfected with siRNASOD2, and treated with APS.
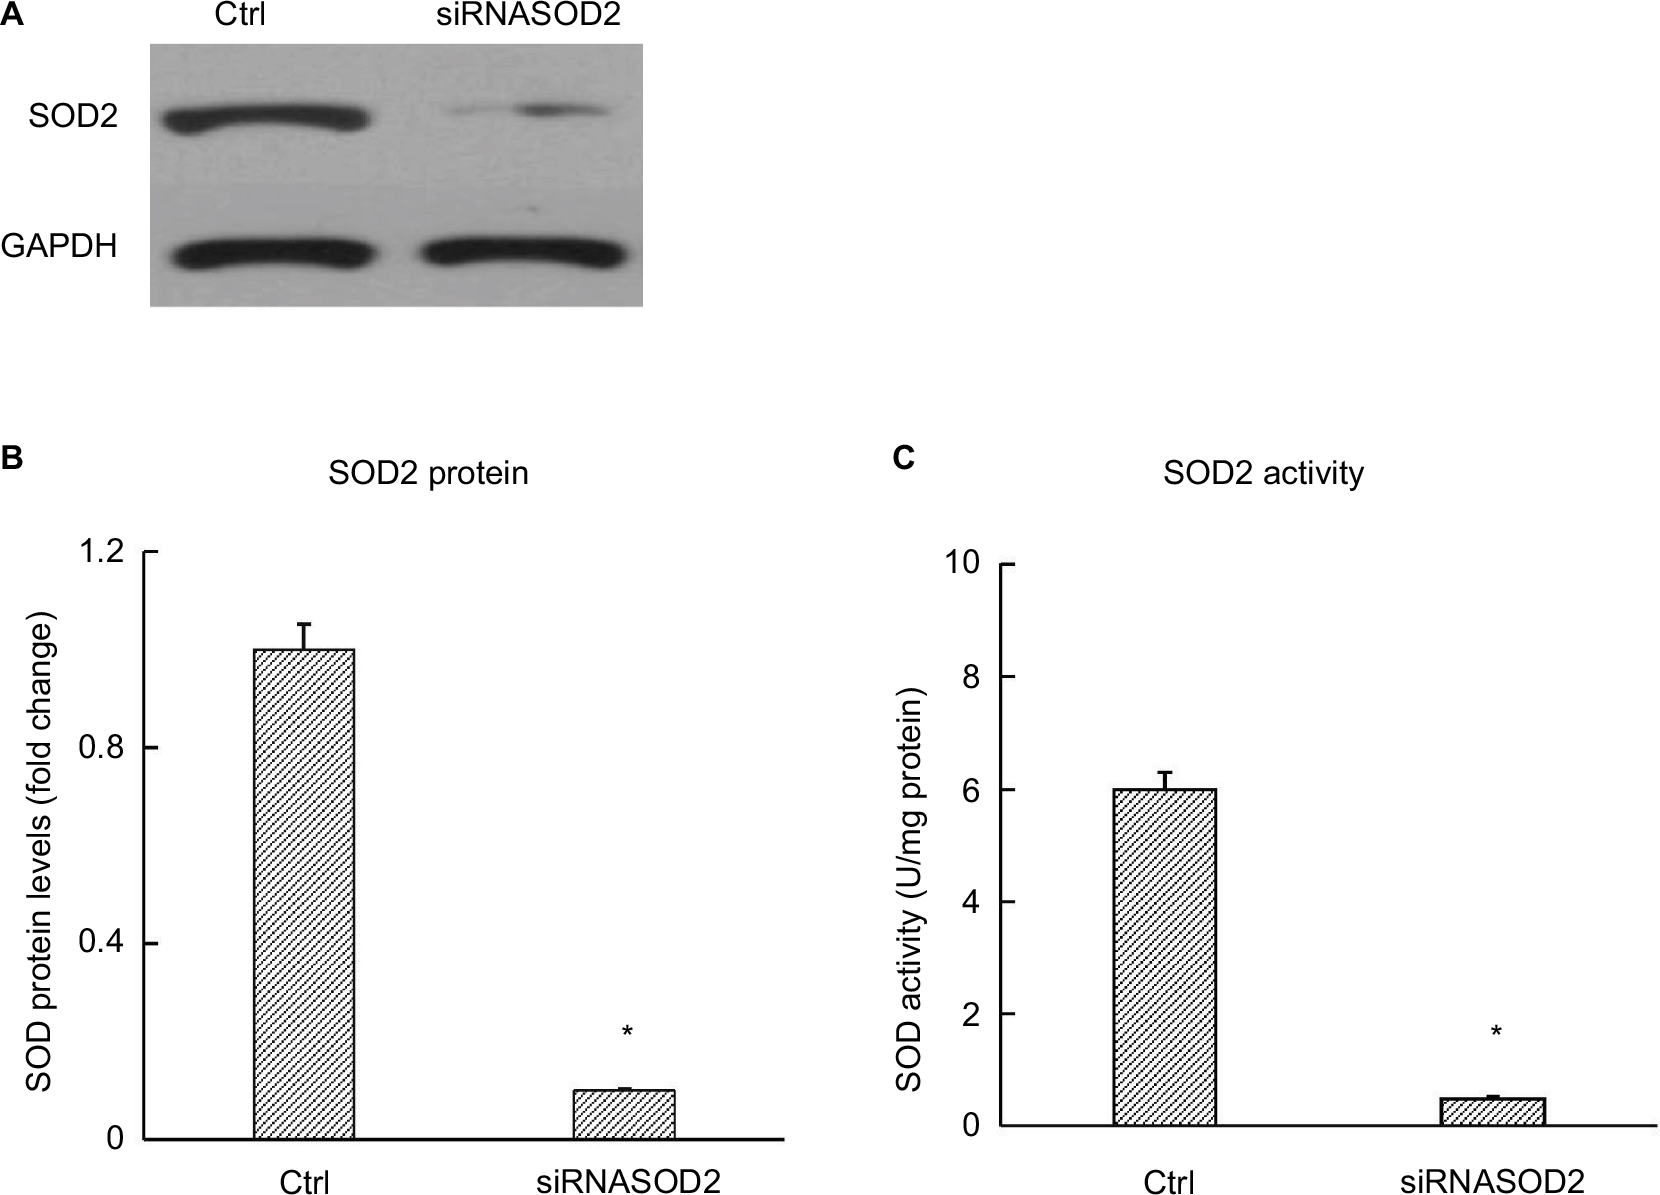 | Figure 1 SOD2 protein and activity in H9C2 cells after silencing of SOD2. Notes: (A) Representative autoradiographs of Western blots. (B) Bar graphs showing SOD2 protein levels. (C) Bar graphs showing SOD2 activities. H9C2 cells were transfected with siRNASOD2 or scrambled siRNA (n=4 per group). SOD activity was measured by the extent of reduction in the appearance of NBT-diformazan utilizing the SOD Assay Kit. SOD protein levels were analyzed by Western blotting. Values are presented as mean ± SEM. Two-group analysis was performed using t-test. *P<0.05 vs ctrl. Abbreviations: NBT, nitroblue tetrazolium; SOD, superoxide dismutase; Ctrl, normal control group. |
Ultrastructural evaluation
Cultured cells were collected and fixed in diluted Karnovsky’s fixative. After staining with uranyl acetate and lead citrate, the ultrastructural changes of cultured cells were viewed on a Philips Morgagni electron microscope (Philips, Amsterdam, Netherlands). The morphology of cultured cells was also evaluated with a confocal microscope.
Assessment of cell apoptosis
Hairpin oligonucleotide probes were employed to detect the magnitude of cell apoptosis. Cultured cells were incubated with T4 DNA ligase and hairpin-1 (biotinylated hairpin probe with a single-base 3′ overhang; Synthetic Genetics, Bayer, Leverkusen, Germany) overnight. Cells were filtered, and hairpin-1-stained positive cells were sorted by flow cytometry for characterization and quantification. Hairpin-1 was utilized for detection of double-strand DNA breaks in apoptotic cells, while ligated oligonucleotides were detected with fluoresceine isothiocyanate-avidin. Propidium iodide (PI) staining was used to identify nonviable cells. The level of fluorescence was calibrated, and images were taken with InSpeck Microscopy Image Intensity Calibration microspheres (Molecular Probes, Rochester, NY, USA). Each experiment was repeated four times in triplicate.
Detection of ROS
The fluorescent dye dihydroethidium (DHE; Thermo Fisher Scientific) was utilized to evaluate superoxide production in cultured cells. Cultured cells were incubated with 5 μM/L DHE at 37°C for 30 minutes. The mean DHE fluorescence intensity of nuclei was calculated by dividing the combined fluorescence value of the pixels by the total number of pixels in 15 randomly selected fields. Fluorescence images were taken respectively. The images were processed using a Bio-Rad Radiance 2100MP multiphoton microscope and ImagePro analysis software (Molecular Probes). Each experiment was repeated four times in triplicate.
Oxidative damage evaluation
Cultured cells were plated on an eight-chamber multi-well slide, fixed with freshly prepared 4% paraformaldehyde, and probed with specific antibodies. The 8-OH-dG mouse monoclonal antibody (QED Bioscience, San Diego, CA, USA) was utilized to detect oxidative stress in the nuclei, whereas the nitrotyrosine antibody (Upstate Biotechnology, Charlottesville, VA, USA) was used to evaluate the oxidative damage to cytoplasmic proteins. The intensity of the 8-OH-dG signal and nitrotyrosine signal was measured with ImagePro software and normalized for PI fluorescence to correct for the differences in nuclear fraction included in the section. Each experiment was repeated four times in triplicate.
Western blot analyses
The amount of protein was evaluated by Bio-Rad protein assay (Bio-Rad Laboratories Inc., Hercules, CA, USA) after extraction from cultured cells using the standard technique. After the separation of whole-cell extracts (50 µg) on 12% SDS-polyacrylamide gel by SDS-PAGE, proteins were transferred to polyvinylidene difluoride membranes (Amersham-Pharmacia, Little Chalfont, UK). Proteins were probed with primary antibodies against SOD1 and SOD2 (Upstate Biotechnology) after blocking. Following the application of horseradish peroxidase-conjugated anti-rabbit IgG as the secondary antibody, protein bands were scanned for quantification of protein expression levels. Glyceraldehyde 3-phosphate dehydrogenase was used as the loading control. The densities of bands in all samples were normalized to the densities of corresponding bands in the normal control. Each experiment was repeated four times in triplicate.
SOD enzyme activity assessment
SOD activities were determined by the Superoxide Dismutase Assay Kit (Trevigen, Gaithersburg, MD, USA). Cells were trypsinized and lysed with 500 µL of lysis solution. The resulting suspension was centrifuged at 14,000× g for 5 minutes at 4°C and then transferred to a clean 1.5 mL tube. The amount of protein was evaluated by the Bio-Rad protein assay as mentioned before. The enzyme activity was determined using a colorimetric assay based on the ability of SOD to form H2O2 from superoxide radicals generated by an exogenous reaction involving xanthine and xanthine oxidase that converts nitroblue tetrazolium (NBT) to NBT-diformazan. NBT-diformazan absorbs light at 550 nm. The extent of reduction in the appearance of NBT-diformazan is a measure of the total SOD activity. The activity was measured using 50–500 µg of total cellular protein in the presence of 5 mM sodium cyanide (NaCN) (Sigma-Aldrich, St. Louis, MO, USA) to inhibit SOD1 activity. Absorbance changes were recorded for 5 minutes, and the rate of increase in absorbance units per minute was calculated. The percentage inhibition was then calculated and plotted as a function of protein concentration for each group. The highest maximum percentage inhibition for each group of sample curves to be compared was determined and used to calculate the amount of protein that inhibited NBT reduction by 50% of this maximum value. Total SOD (reactions not containing NaCN) and SOD2 activities (reactions containing 5 mM NaCN) in U/mg protein were then calculated. SOD1 activities were determined by subtracting the SOD2 activity in each experimental sample from the total SOD activity. Each experiment was repeated four times in triplicate.
Statistical analysis
Results are represented as mean ± SEM. Two-group analysis was performed using t-test between HG and ctrl, APS-HG and HG, APS-siRNASOD2 and siRNASOD2, and siRNASOD2 and ctrl (Stata 14.0). P-value <0.05 was considered statistically significant.
Results
APS protected mitochondrial ultrastructure in high glucose-induced or SOD2-knocked down H9C2 cells
The confocal microscopy examination of H9C2 cells revealed no obvious cardiomyocyte abnormalities among different groups (Figure 2A).
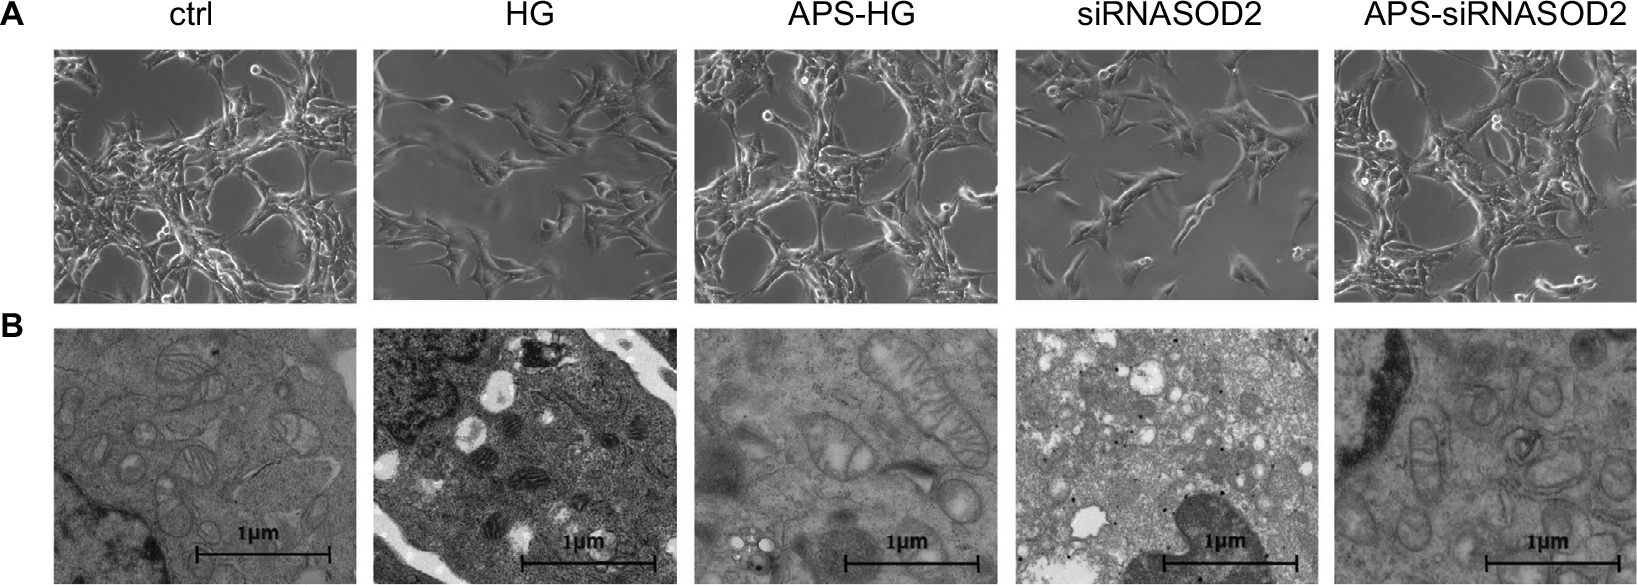 | Figure 2 APS abrogated the ultrastructural abnormalities of mitochondria induced by high glucose or silencing of SOD2. Notes: (A) Confocal microscopy images of cultured cells (×200 magnification). (B) Representative ultrastructural profiles of cultured cells observed using a transmission electron microscope (×23,300 magnification). H9C2 cells cultured in high or normal concentration of glucose were transfected with siRNASOD2 or scrambled siRNA and were further cultured in the presence of APS or vehicle. Cultured cells were observed by a confocal microscope and evaluated using a transmission electron microscope to define cardiac mitochondrial structural changes. Abbreviations: APS, Astragalus polysaccharides; APS-HG, APS-treated high glucose-induced group; Ctrl, normal control group; HG, high glucose-induced group.. |
To verify the role of glucotoxicity in DM-induced cardiomyocyte damage, we simulated the diabetic environment in vitro by exposing H9C2 cells to high glucose. As expected, high glucose induced the destruction of myocyte ultrastructure with serious damage of mitochondria. However, the abnormalities were mainly ameliorated and well improved after APS treatment, and the beneficial effects were characterized by neatly arranged mitochondria with intact mitochondrial membrane and crests (Figure 2B).
To verify the oxidation mechanism underlying high glucose-induced effects, we silenced SOD2 in H9C2 cells by transfection with siRNA. As predicted, the ultrastructural evaluation of SOD2-knocked down H9C2 cells revealed serious damage similar to those observed in high glucose-induced H9C2 cells. Mitochondria were varied in size and shape, with disruption and loss of structural integrity, whereas cristae were enlarged and partially edematous. Notably, the beneficial effects of APS treatment were largely observed in APS-treated SOD2-knocked down cells, characterized by integrated and well-shaped mitochondria containing regular cristae and intact mitochondrial membranes (Figure 2B).
In addition, as shown in Figure 2, 50% of control cells itself were in apoptosis which might mainly be due to the long time duration of incubation or the transfection with relevant scrambled siRNA.
APS inhibited cell apoptosis in high glucose-induced or SOD2-knocked down H9C2 cells
To determine whether APS exerts a protective effect on H9C2 cells against high glucose induction or silencing of SOD2, all cells were subjected to the ligation of hairpin oligonucleotide probes and then characterized and quantified by flow cytometry analysis.
As expected, the percentage of hairpin-1-positive cells in high glucose-induced cells was significantly higher than that in the normal control (88% in the HG group vs 54% the in ctrl group), whereas the increase of high glucose-induced apoptosis was significantly abrogated after APS treatment (56% in the APS-HG group), indicating the beneficial effect of APS on high glucose-induced apoptosis in vitro (Figure 3).
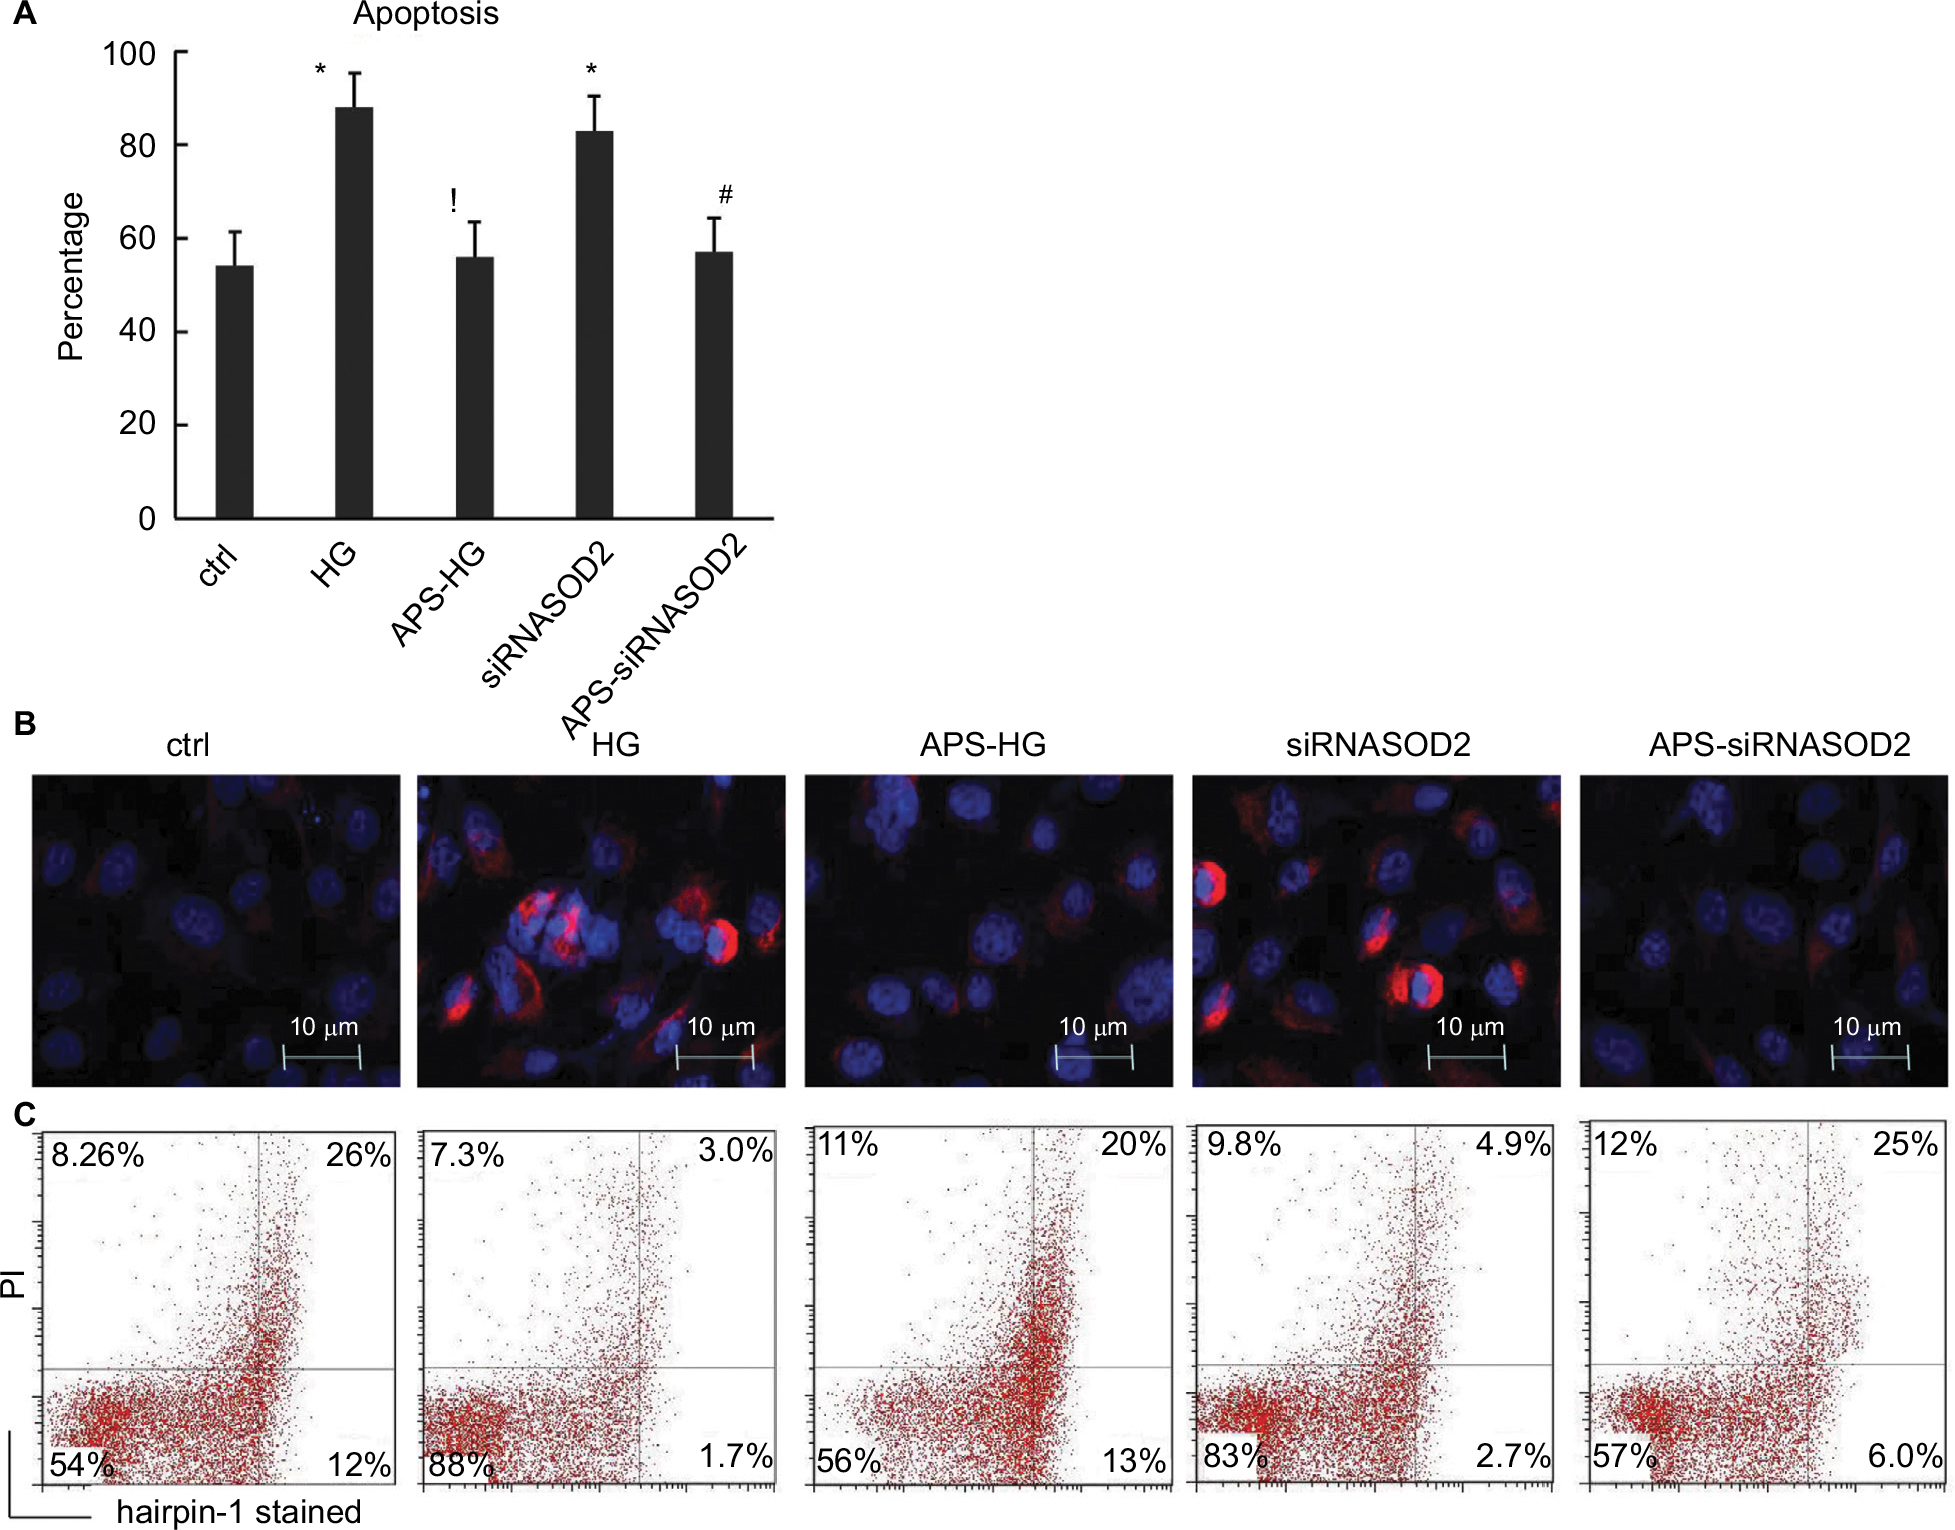 | Figure 3 APS reduced the cell apoptosis in H9C2 cells induced by high glucose or silencing of SOD2. Notes: (A) Bar graph showing the percentage of hairpin-1-stained positive cells in cultured cells by flow cytometry quantification. (B) Immunocytochemistry microphotographs showing the hairpin-1-stained positive (red) cells (×2,000 magnification). (C) Flow cytometry analysis for the quantification of hairpin-1-stained positive cells in cultured cells. H9C2 cells cultured in high or normal concentration of glucose were transfected with siRNASOD2 or scrambled siRNA and were further cultured in the presence of APS or vehicle (n=4 per group). Hairpin oligonucleotide probes were employed for the detection of cell apoptosis. Hairpin-1-positive cells were gated and quantified by flow cytometry analysis. Each experiment was performed in triplicate and repeated three times. Values are presented as mean ± SEM. Two-group analysis was performed using t-test between HG and ctrl, APS-HG and HG, APS-siRNASOD2 and siRNASOD2, and siRNASOD2 and ctrl. *P<0.05 vs ctrl, !P<0.05 vs HG, and #P<0.05 vs siRNASOD2, corresponding to all the repetitions in the study. Abbreviations: APS, Astragalus polysaccharides; APS-HG, APS-treated high glucose-induced group; Ctrl, normal control group; HG, high glucose-induced group.. |
Furthermore, the percentage of hairpin-1-positive cells in SOD2-knocked down cells was significantly higher than that in the normal control (83% in the siRNASOD2 group vs 54% in the ctrl group). However, the increase of hairpin-1-positive cells induced by silencing of SOD2 was significantly abrogated after APS treatment (57% in the APS-siRNASOD2 group), which suggested that APS could prevent SOD2 knockdown-induced apoptosis in H9C2 cells (Figure 3).
APS reduced ROS formation in high glucose-induced or SOD2-knocked down H9C2 cells
To evaluate the formation of ROS with high glucose induction or silencing of SOD2, superoxide production in H9C2 cells was determined by immunohistochemistry using the fluorescent dye DHE.
As predicted, the DHE fluorescence levels in high glucose-induced cells were increased by more than twofold in comparison with those in normal control cells. However, the increase of superoxide production induced by high glucose was significantly abrogated by APS treatment, indicating the protective effect of APS on high glucose-induced ROS formation in vitro (Figure 4A and B).
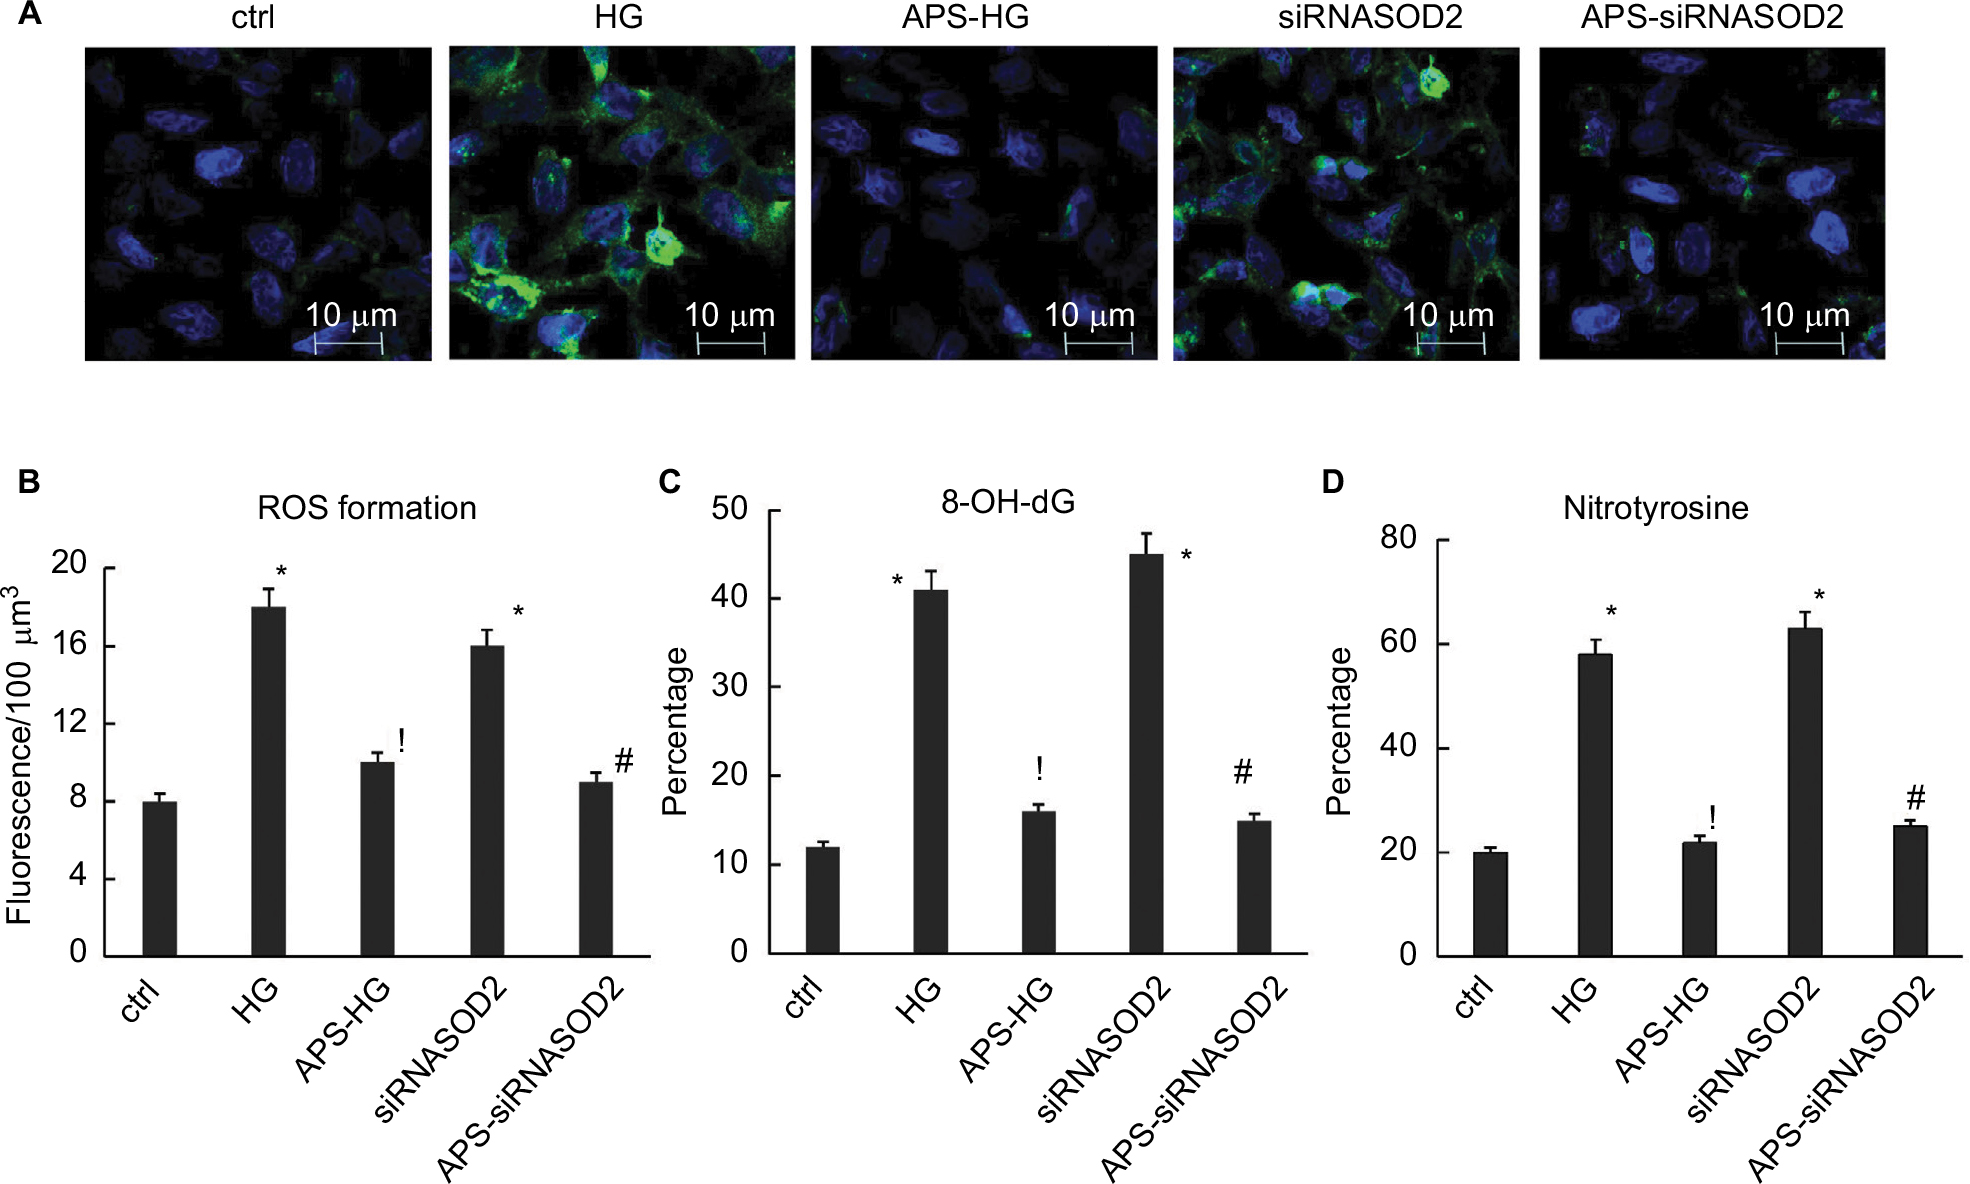 | Figure 4 APS inhibited ROS formation and oxidative damage induced by high glucose or silencing of SOD2. Notes: (A) Fluorescence microphotographs showing DHE-stained positive (green) cells (×2,000 magnification). (B) Bar graph showing the mean DHE fluorescence intensity of nuclei in culture cells. (C) Bar graph showing the intensity of 8-OH-dG signals in culture cells. (D) Bar graph showing the intensity of nitrotyrosine signals in culture cells. H9C2 cells cultured in high or normal concentration of glucose were transfected with siRNASOD2 or scrambled siRNA and were further cultured in the presence of APS or vehicle (n=4 per group). Superoxide production in cultured cells was determined using the fluorescent dye DHE. The images were processed, and the mean DHE fluorescence intensity of nuclei was evaluated using a Bio-Rad Radiance 2100MP multiphoton microscope and ImagePro advanced software. Nitrotyrosine antibodies were employed to detect oxidative damage to cytoplasmic proteins, whereas 8-OH-dG antibodies were utilized to detect oxidative stress in the nuclei. Each experiment was performed in triplicate and repeated three times. Values are presented as mean ± SEM. Two-group analysis was performed using t-test between HG and ctrl, APS-HG and HG, APS-siRNASOD2 and siRNASOD2, and siRNASOD2 and ctrl. *P<0.05 vs ctrl, !P<0.05 vs HG, and #P<0.05 vs siRNASOD2, corresponding to all the repetitions in the study. Abbreviations: APS, Astragalus polysaccharides; DHE, dihydroethidium; APS-HG, APS-treated high glucose-induced group; Ctrl, normal control group; HG, high glucose-induced group.. |
Moreover, the DHE fluorescence levels in SOD2-knocked down cells were increased by almost twofold compared with those in normal control cells, whereas the increase of superoxide production induced by silencing of SOD2 was significantly inhibited by APS treatment, suggesting the beneficial effect of APS on SOD2 knockdown-induced ROS formation in H9C2 cells (Figure 4A and B).
APS prevented oxidative damage in high glucose-induced or SOD2-knocked down H9C2 cells
To detect ROS-mediated oxidative damage with high glucose induction or silencing of SOD2, nitrotyrosine antibodies were utilized to detect oxidative damage to cytoplasmic proteins, whereas 8-OH-dG antibodies were used to detect oxidative stress in the nuclei.
As predicted, the percentages of both 8-OH-dG-labeled cells and nitrotyrosine-labeled cells were significantly increased by three- to fourfold in high glucose-induced cells in comparison with those in normal control cells. However, the increase of 8-OH-dG-labeled cells and nitrotyrosine-labeled cells induced by high glucose was significantly reversed by APS treatment, indicating the reductive effect of APS on high glucose-induced oxidative stress in cytoplasmic proteins and nuclei in vitro (Figure 4C and D).
Furthermore, the percentages of both 8-OH-dG-labeled cells and nitrotyrosine-labeled cells were increased by almost 3.5- to 4.5-fold in SOD2-knocked down cells compared with those in normal control cells. However, the enhancement of 8-OH-dG-labeled cells and nitrotyrosine-labeled cells induced by silencing of SOD2 was significantly prevented by APS treatment, suggesting the inhibiting effect of APS on SOD2 knockdown-induced oxidative stress in cytoplasmic proteins and nuclei in H9C2 cells (Figure 4C and D).
APS enhanced SOD2 enzyme activities and protein levels in high glucose-induced or SOD2-knocked down H9C2 cells
As is known, SOD2 is localized only within the mitochondria and its only function is to dismutate superoxide anion into hydrogen peroxide followed by conversion into water and oxygen in turn through the action of catalase or glutathione peroxidase. However, SOD1 is distributed throughout the cytoplasm, and SOD3 is found in extracellular regions. Therefore, SOD enzyme activities and protein levels were analyzed to evaluate the effect of APS on SOD2 expression in high glucose-induced or SOD2-knocked down H9C2 cells.
As predicted, both SOD2 enzyme activities and SOD2 protein levels were significantly reduced by 70%–50% in high glucose-induced cells in comparison with those in normal control cells. However, the decrease of SOD2 enzyme activities and protein levels induced by high glucose was significantly inhibited by APS treatment, indicating the inhibiting effect of APS on high glucose-induced reduction in SOD2 expression in vitro (Figure 5).
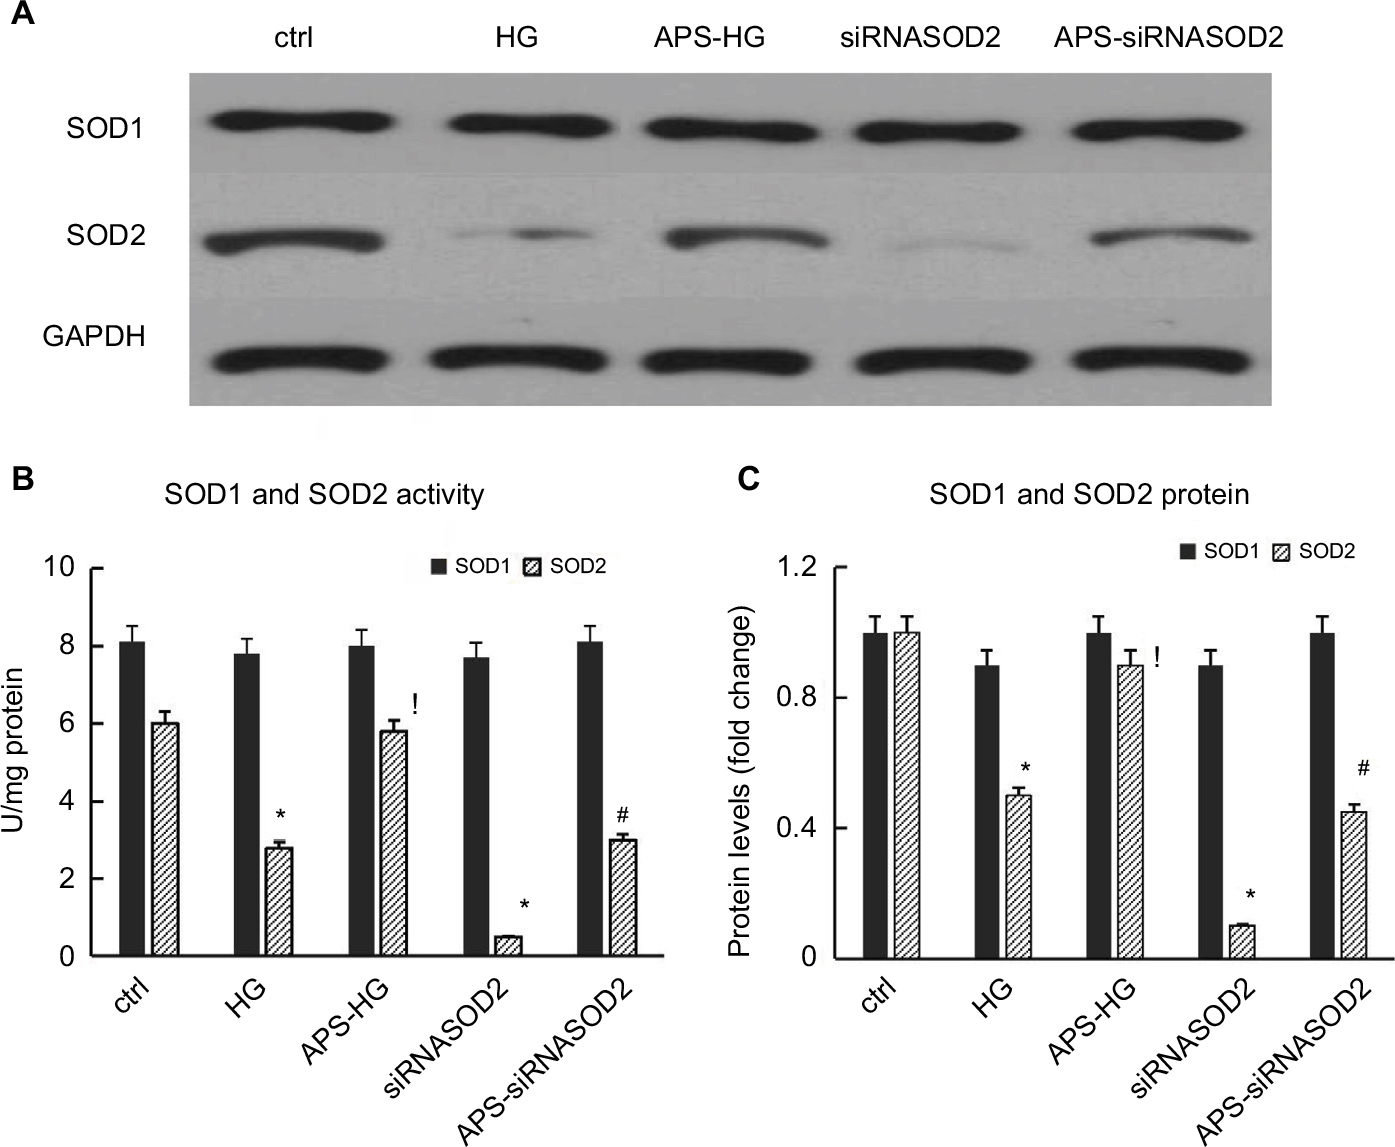 | Figure 5 APS enhanced the SOD2 protein expression and activity in H9C2 cells induced by high glucose or silencing of SOD2. Notes: (A) Representative autoradiographs of Western blots. (B) Bar graphs showing the activities of SOD1 and SOD2 in cultured cells. (C) Bar graphs showing the protein levels of SOD1 and SOD2 in cultured cells. H9C2 cells cultured in high or normal concentration of glucose were transfected with siRNASOD2 or scrambled siRNA and then exposed to APS or vehicle (n=4 per group). SOD activity was measured by the extent of reduction in the appearance of NBT-diformazan utilizing the SOD Assay Kit. SOD protein levels were analyzed by Western blotting. Each experiment was performed in triplicate and repeated three times. Values are presented as mean ± SEM. Two-group analysis was performed using t-test between HG and ctrl, APS-HG and HG, APS-siRNASOD2 and siRNASOD2, and siRNASOD2 and ctrl. *P<0.05 vs ctrl, !P<0.05 vs HG, and #P<0.05 vs siRNASOD2, corresponding to all the repetitions in the study. Abbreviations: APS, Astragalus polysaccharides; NBT, nitroblue tetrazolium; SOD, superoxide dismutase; APS-HG, APS-treated high glucose-induced group; Ctrl, normal control group; HG, high glucose-induced group.. |
Furthermore, both SOD2 enzyme activities and SOD2 protein levels were reduced by almost 85%–90% in SOD2-knocked down cells compared with those in normal control cells. However, the decrease of SOD2 enzyme activities and protein levels induced by the silencing of SOD2 was significantly prevented by APS treatment, suggesting the beneficial effect of APS on SOD2 knockdown-induced reduction in SOD2 expression in H9C2 cells (Figure 5).
Meanwhile, no significant changes in SOD1 enzyme activities and protein levels were observed in high glucose-induced or SOD2-knocked down H9C2 cells, compared with those in normal control cells (Figure 5).
Discussion
DCM is characterized by impaired systolic and diastolic ventricular function, leading to left ventricular dysfunction, which is directly associated with hyperglycemia independent of elevated blood pressure or coronary artery disease.2 Previously, we reported that APS therapy protected cardiac function and myocardial ultrastructure in diabetic mice.4,5 As shown in our current study, high glucose-challenged H9C2 cardiomyocytes exhibited serious damage in mitochondrial ultrastructure, together with a significant increase of cell apoptosis. In agreement with our previous study, APS treatment variably abrogated ultrastructural abnormalities of mitochondria and markedly reduced cell apoptosis in high glucose-induced H9C2 cells, which indicated the protective effect of APS on high glucose-challenged cardiomyocytes in vitro.
Emerging evidence demonstrated that hyperglycemia could induce intracellular ROS generation and apoptosis in multiple experimental models of diabetic heart dysfunction. The enhanced superoxide production by mitochondria and overactivation of oxidative stress is the central role contributing to DCM.7–9 The increase in ROS formation related to decreased antioxidant capacity of diabetic cardiomyocytes mainly results in apoptotic cell death.10 Previously, we reported that APS therapy reduced myocardial oxidation in diabetic mice in vivo.4,5 As shown in our current study, high glucose-induced H9C2 cells presented with highly activated oxidative stress, including enhanced levels of superoxide production, oxidative damage to cytoplasmic proteins, and oxidative stress in the nuclei. In agreement with our previous findings, APS treatment significantly abrogated the oxidative activation in high glucose-induced H9C2 cells, with reduction in superoxide production and oxidative damage in both cytoplasmic proteins and nuclei, which suggested the protective effect of APS on high glucose-challenged cardiomyocytes in vitro.
SOD family is a primary antioxidant system, which includes a cytoplasmic SOD (SOD1), a mitochondrial SOD (SOD2), and an extracellular SOD (SOD3).11–14 Mitochondria are the major intracellular sources of oxidative stress. The superoxide anion radicals exert their effects locally and fail to penetrate the mitochondrial membranes. Therefore, mitochondrial SOD (SOD2) is a crucial scavenger of superoxides.15–17 As shown in our current study, SOD2-silenced H9C2 cells presented with destroyed mitochondrial ultrastructure, enhanced cellular apoptosis, and increased superoxide production and oxidative damage in both cytoplasmic proteins and nuclei, comparable to those in high glucose-challenged H9C2 cells. In addition, high glucose-induced H9C2 cells exhibited reduced SOD2 enzyme activity and protein levels. These findings indicated that high glucose-induced oxidation in cardiomyocytes was partly associated with the reduction of SOD2 expression. Furthermore, our results showed that APS treatment mainly improved the ultrastructural abnormalities of mitochondria and cellular apoptosis in SOD2-knocked down H9C2 cells, together with the obvious reduction of superoxide production and oxidative damage in both cytoplasmic proteins and nuclei. These findings suggested that APS treatment could inhibit the overactivation of oxidative stress in cardiomyocytes directly, independent of its effect on high glucose in vitro, which might be associated with its induction of SOD2 expression.
Taking all these findings together, our current study revealed that APS treatment could protect cellular ultrastructure, prevent cell apoptosis, reduce oxidative damage, and increase SOD2 expression in both high glucose-induced and SOD2-silenced H9C2 cells. Thus, our findings suggest that APS could benefit high glucose-challenged cardiomyocytes by direct inhibition of oxidative stress, which may be partly associated with its impact on cardiac SOD2 activity. However, the direct relationship and mechanism of SOD2 induction by APS should be further investigated.
Conclusion
Our findings indicated the beneficial effect of APS on high glucose-challenged H9C2 cells, which was associated with inhibition of oxidative stress in vitro.
Acknowledgment
This study was supported by the Chinese State Natural Science Funds Commission (NSFC), grant No. 81473460 and 81670751.
Author contributions
Wei Chen and Yehong Yang acquired the grants. Wei Chen, Yu Zhang, and Yehong Yang conceived and designed the project. Wei Chen, Qilin Sun, Jing Ju, and Wenjie Chen proceeded with the experiment and acquired the data. Xuelan Zhao analyzed and interpreted the data. Wei Chen wrote the paper. All authors contributed to data analysis, drafting and revising the article, gave final approval of the version to be published, and agree to be accountable for all aspects of the work.
Disclosure
The authors report no conflicts of interest in this work.
References
Boudin S, Abel ED. Diabetic cardiomyopathy revisited. Circulation. 2007;115:3213–3223. | ||
Watanabe K, Thandavarayan RA, Harima M, et al. Role of differential signaling pathways and oxidative stress in diabetic cardiomyopathy Cur Cardiol Rev. 2010;6(4):280–290. | ||
Ni Y, Su Q, Liu X. Experimental study of optimized techniques of water decoration extraction of Astragalus polysaccharide. China J Chin Med. 1998;23(6):284–286. | ||
Chen W, Ju J, Yang Y, et al. Astragalus polysaccharides protect cardiac stem and progenitor cells by the inhibition of oxidative stress-mediated apoptosis in diabetic hearts. Drug Des Devel Ther. 2018;12:943–954. | ||
Ju J, Chen W, Lai Y, et al. Astragalus polysaccharides improve cardiomyopathy in STZ-induced diabetic mice and heterozygous (SOD2+/-) knockout mice. Braz J Med Biol Res. 2017;50(8):e6204. | ||
Chen W, Lai Y, Wang L, et al. Astragalus polysaccharides repress myocardial lipotoxicity in a PPAR alpha-dependent manner in vitro and in vivo in mice. J Diabetes Complications. 2015;29(2):164–175. | ||
Liu Z, Gou Y, Zhang H, et al. Estradiol improves cardiovascular function through up-regulation of SOD2 on vascular wall. Redox Biol. 2014;3:88–99. | ||
Aksakal E, Akaras N, Kurt M, et al. The role of oxidative stress in diabetic cardiomyopathy: an experimental study. Eur Rev Med Pharmacol Sci. 2011;15(11):1241–1246. | ||
Aroor AR, Mandavia C, Ren J, Sowers JR, Pulakat L. Mitochondria and oxidative stress in the cardiorenal metabolic syndrome. Cardiorenal Med. 2012;2(2):87–109. | ||
De Marchi E, Baldassari F, Bononi A, Wieckowski MR, Pinton P. Oxidative stress in cardiovascular diseases and obesity: role of p66Shc and protein kinase C. Oxid Med Cell Longev. 2013;2013:564961. | ||
Vats P, Sagar N, Singh TP, Banerjee M. Association of Superoxide dismutases (SOD1 and SOD2) and Glutathione peroxidase 1 (GPx1) gene polymorphisms with type 2 diabetes mellitus. Free Radic Res. 2015;49(1):17–24. | ||
Giacco F, Brownlee M. Oxidative stress and diabetic complications. Circ Res. 2012;107(9):1058–1070. | ||
Kang L, Dai C, Lustig ME, et al. Heterozygous SOD2 deletion impairs glucose-stimulated insulin secretion, but not insulin action, in high-fat-fed mice. Diabetes. 2014;63(11):3699–3710. | ||
Vincent AM, Russell JW, Sullivan KA, et al. SOD2 protects neurons from injury in cell culture and animal models of diabetic neuropathy. Exp Neurol. 2007;208(2):216–227. | ||
Van Remmen H, Williams MD, Guo Z, et al. Knockout mice heterozygous for sod2 show alterations in cardiac mitochondrial function and apoptosis. Am J Physiol Heart Circ Physiol. 2001;81(3):H1422–H1432. | ||
Liu C, Ogando D, Bonanno JA. SOD2 contributes to anti-oxidative capacity in rabbit corneal endothelial cells. Mol Vis. 2011;17:2473–2481. | ||
Kohler JJ, Cucoranu I, Fields E, et al. Transgenic mitochondrial superoxide dismutase and mitochondrially targeted catalase prevent antiretroviral-induced oxidative stress and cardiomyopathy. Lab Invest. 2009;89(7):782–790. |
 © 2018 The Author(s). This work is published and licensed by Dove Medical Press Limited. The
full terms of this license are available at https://www.dovepress.com/terms
and incorporate the Creative Commons Attribution
- Non Commercial (unported, 3.0) License.
By accessing the work you hereby accept the Terms. Non-commercial uses of the work are permitted
without any further permission from Dove Medical Press Limited, provided the work is properly
attributed. For permission for commercial use of this work, please see paragraphs 4.2 and 5 of our Terms.
© 2018 The Author(s). This work is published and licensed by Dove Medical Press Limited. The
full terms of this license are available at https://www.dovepress.com/terms
and incorporate the Creative Commons Attribution
- Non Commercial (unported, 3.0) License.
By accessing the work you hereby accept the Terms. Non-commercial uses of the work are permitted
without any further permission from Dove Medical Press Limited, provided the work is properly
attributed. For permission for commercial use of this work, please see paragraphs 4.2 and 5 of our Terms.