Back to Journals » International Journal of Chronic Obstructive Pulmonary Disease » Volume 11 » Issue 1
Asthma-chronic obstructive pulmonary disease overlap syndrome in the urban Chinese population: prevalence and disease burden using the 2010, 2012, and 2013 China National Health and Wellness Surveys
Authors Ding B ![]() , DiBonaventura M, Karlsson N, Ling X
, DiBonaventura M, Karlsson N, Ling X
Received 8 January 2016
Accepted for publication 20 March 2016
Published 9 June 2016 Volume 2016:11(1) Pages 1139—1150
DOI https://doi.org/10.2147/COPD.S103873
Checked for plagiarism Yes
Review by Single anonymous peer review
Peer reviewer comments 3
Editor who approved publication: Prof. Dr. Richard Russell
Bo Ding,1 Marco DiBonaventura,2 Niklas Karlsson,1 Xia Ling3
1Department of Global Medical Affairs, AstraZeneca, Gothenburg, Sweden; 2Department of Health Outcomes Practice, Kantar Health, New York, NY, USA; 3Department of Medical Affairs China, AstraZeneca, Shanghai, People’s Republic of China
Background: Research has suggested a significant burden for patients with asthma-chronic obstructive pulmonary disease (COPD) overlap syndrome (ACOS). However, few studies have studied this population in the People’s Republic of China, a region in the midst of rapid epidemiological change with respect to respiratory disease. The aim of this study was to assess the prevalence of ACOS and its association with patient outcomes in urban China.
Methods: Data from the 2010, 2012, and 2013 China National Health and Wellness Survey, an Internet-based survey of adults in urban China, were used (N=59,935). Respondents were categorized into one of four groups based on self-reported physician diagnoses: ACOS, asthma only, COPD only, or control (ie, no asthma or COPD). A propensity score matching procedure was conducted to cull the control group into a subgroup (ie, matched controls) who resembled patients with ACOS, asthma only, and COPD only. These four groups (ACOS, asthma only, COPD only, matched controls) were then compared with respect to health status (Short Form-12 version 2/Short Form-36 version 2), work productivity, and health care resource use using generalized linear models.
Results: Patients with ACOS (N=366) comprised 0.61% of the adult population, 30.73% of the asthma population, and 18.60% of the COPD population in the People’s Republic of China. Patients with ACOS reported significantly worse health status (eg, health utilities =0.63, 0.66, 0.63, and 0.69 for ACOS, COPD only, asthma only, and matched controls, respectively) and significantly greater work impairment (eg, overall work impairment =43.65%, 35.19%, 48.55%, and 29.80%, respectively) and health care resource use (eg, physician visits in the past 6 months =5.13, 3.84, 4.65, and 2.39, respectively) compared with matched controls and patients with COPD only. Few significant differences were observed between patients with ACOS and asthma only.
Conclusion: Patients with ACOS have a greater comorbidity burden and significantly worse health outcomes compared with COPD only patients and matched controls. Better management of these patients may help to improve their outcomes.
Keywords: ACOS, quality of life, work productivity, healthcare resource use
Background
Asthma is a chronic inflammatory condition that causes the airways to swell and narrow, leading to dyspnea, coughing, and tightening of the chest.1,2 Asthma has been found to be quite common, though its prevalence varies significantly by region, ranging from 1% to 18%.3–5 Using data from 2010 to 2011, a recent epidemiological survey study conducted across eight provinces in the People’s Republic of China estimated the prevalence of asthma in the population older than 14 years at 1.24%.6 This figure has increased dramatically in the past 20 years, however. A study in Shanghai found that the prevalence of asthma among those 6 years and older increased from 0.4% in 1997 to 1.8% in 2007.5 Evidence has also suggested increases in the prevalence of chronic obstructive pulmonary disease (COPD) over time.7 A recent review, which extracted data from 80 studies, found that the prevalence of COPD ranged from 0.2% to 37%, with significant variation across countries, populations, and methods to diagnose and classify COPD.7 In the People’s Republic of China, the prevalence of COPD among those 40 years and older was estimated at 8.2% based on a recent large-scale, population-based epidemiological study on COPD prevalence in the People’s Republic of China.8 Additional studies have produced similar estimates.9–11
In part, the increases in the prevalence of these two respiratory conditions may be due to high rates of smoking and environmental pollutants, among other factors; however, some of the variation is currently difficult to explain.8 Given the increasing incidence and prevalence of respiratory conditions in the People’s Republic of China and the high mortality rate of these patients,4,5 further research is necessary to understand the overlap between asthma and COPD (ie, asthma COPD overlap syndrome [ACOS]), which can be quite common.12,13
Research has suggested a significant burden for patients with ACOS. Pleasants et al14 reported that patients with ACOS had significantly more comorbidities and impairment than those with individual conditions. Similarly, Kauppi et al15 reported a significantly poorer quality of life among patients with ACOS. Studies have also found greater health care resource utilization and costs among these patients.16
The epidemiology of ACOS has not been studied in the People’s Republic of China. The current study had two objectives. The first objective was to estimate the prevalence and profile (with respect to demographics, health characteristics, and disease history) of patients with ACOS among the adult population in urban China. The second objective was to investigate the association among ACOS and health status, work productivity, and health care resource use.
Methods
Data source
This study included data from the 2010 (N=19,954), 2012 (N=19,994), and 2013 (N=19,987) China National Health and Wellness Survey (NHWS; no China NHWS was fielded in 2011). All the 3 years were combined for the purposes of analysis to maximize sample size for those with ACOS. The total sample size for 2010–2013 China NHWS was N=59,935.
The NHWS is a cross-sectional, self-administered, Internet-based survey of adults (aged 18 or older) intended to represent the urban adult population in the People’s Republic of China (ie, tier 1 and tier 2 cities). A comparison between the NHWS and the urban Chinese population with respect to age and sex distributions is shown in Table 1. Detailed information on the methods of the China NHWS is provided elsewhere.17 To briefly summarize, potential respondents were recruited through a combination of Internet panels and offline recruiting (the latter implemented to ensure adequate representation among the elderly and those without Internet access) using a random stratified sampling framework. Strata were based on age, sex, and region to match these characteristics to the total urban China population.
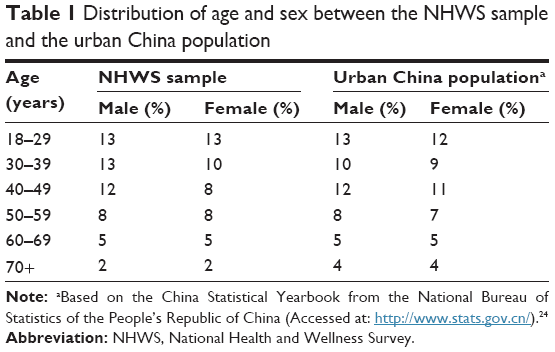 | Table 1 Distribution of age and sex between the NHWS sample and the urban China population |
A large majority of the China NHWS sample accessed the survey from an email invitation received through their panel membership and completed the survey using a web-based format (response rates were as follows: 2010=16.46%, 2012=15.78%, and 2013=4.89%). In order to achieve an adequate sample of respondents aged 50 and over (and account for those without reliable Internet access), computer-assisted web interviewing was also conducted for ~15% of the sample in a given year. Computer-assisted web interviewing was conducted in ten of the largest urban regions: Beijing, Shenyang, Xi’an, Hefei, Changsha, Chengdu, Shanghai, Jinan, Guiyang, and Guangzhou. In these cases, respondents were recruited offline and asked to complete the survey (using a computer) in a centralized facility. Permission to use the NHWS data for this study was granted by Kantar Health (New York, NY). The 2010, 2012, and 2013 China NHWS was reviewed and approved by an independent institutional review board (Essex IRB) and participants provided written informed consent to be included in this study. All respondents were compensated for their participation. No ethical review was sought for the current analysis as it was limited to secondary analysis of de-identified patient survey data. All principles outlined in the Declaration of Helsinki were followed.
Measures
ACOS
The key independent variable of interest was a four-level categorical variable indicating ACOS status: ACOS versus asthma without COPD (asthma only) versus COPD without asthma (COPD only) versus no asthma or COPD (ie, the control group). Each respondent in NHWS was placed into one of the four categories based on self-reported physician diagnoses. All respondents in the NHWS were asked, “Which of the following conditions have you ever experienced?” with a list of conditions to select (eg, anxiety, COPD, high blood pressure). For patients who selected “asthma”, “COPD”, “chronic bronchitis”, or “emphysema”, they were then asked (for each condition separately) whether the condition has been diagnosed by a health care professional (Has your [CONDITION] ever been diagnosed by a health care professional?). Respondents who self-reported a diagnosis of asthma and a diagnosis of COPD, chronic bronchitis, or emphysema were classified as “ACOS”. Respondents who self-reported a diagnosis of asthma but did not report a diagnosis of COPD, chronic bronchitis, or emphysema were classified as “asthma only”. Respondents who did not self-report a diagnosis of asthma but self-reported a diagnosis of COPD, chronic bronchitis, or emphysema were classified as “COPD only”. All remaining respondents (ie, those without a diagnosis of asthma, COPD, chronic bronchitis, or emphysema) were classified as “controls”.
Demographics
Demographic variables assessed in the NHWS include the year of the survey (2010, 2012, 2013), sex (male vs female), age, monthly household income (renminbi [RMB] 2,500–5,999, RMB 6,000–9,999, RMB 10,000+, or declined to answer, vs ≤RMB 2,499), and education (university or beyond+ vs lower).
Health history
Health history variables include smoking habits (current smoker, former smoker, vs never smoker), alcohol consumption (current alcohol use vs no alcohol use), exercise (≥1 times in the past month, vigorously for 20+ minutes, vs no vigorous exercise), and body mass index category (coded as based on the World Health Organization recommendation for Asian populations: underweight [<18.5 kg/m2], acceptable risk [18.5 to <23 kg/m2], increased risk [23 to <27.5 kg/m2], high risk [≥27.5 kg/m2] or decline to provide weight).18 The Charlson comorbidity Index (CCI), which represents a weighted sum of multiple comorbid conditions predictive of mortality, was also included.19 Greater scores indicate a greater comorbid burden on the patient. Since the CCI includes COPD as one of its conditions, an “adjusted” CCI was calculated removing COPD from the index (otherwise, controlling for the CCI as a covariate would result in inadvertently controlling for COPD, which is part of the main predictor of interest).
Disease history
For respondents who reported a diagnosis of asthma, the following information was also available: number of years they have been diagnosed, diagnosing physician (internist, allergist, nurse practitioner, pediatrician, pulmonologist, other), self-reported severity, frequency of asthma problems (daily to once a month or less), Asthma Control Test,20 the main causes of asthma attacks (allergic reactions, exercise/physical activity, illnesses, pollutants, secondhand smoke, stress/anxiety, weather/temperature, other), and current treatment (prescription medication and over-the-counter medication, prescription medication only, over-the-counter medication only, no treatment). For respondents who reported a diagnosis of COPD, the following information was also available: number of years they have been diagnosed, diagnosing physician specialty, self-assessed severity of COPD (mild, moderate, and severe), presence of exacerbations, duration of exacerbations in the past 6 months, main cause of episodes, frequency/severity of breathlessness, and current treatment (prescription medication and over-the-counter medication, prescription medication only, over-the-counter medication only, no treatment).
Health status
Health status was measured using the Short Form-36 version 2 in 2012 and 2013 and the Short Form-12 version 2 in 2010.21,22 The Short Form-12 version 2 is a subset of the Short Form-36 version 2 and both produce a normed physical component summary and mental component summary score. Additionally, both the Short Form-12 version 2 and Short Form-36 version 2 can be used to generate health state utilities for economic analysis by applying the Short Form-6D algorithm (which conceptually varies between 0 and 1 with higher values equating to better health states).
Work productivity
Productivity impairment was measured using the Work Productivity and Activity Impairment questionnaire.23 The Work Productivity and Activity Impairment questionnaire includes the following metrics: absenteeism (% work time missed because of one’s health in the past 7 days), presenteeism (% impairment experienced while at work in the past 7 days), overall work impairment (combination of absenteeism and presenteeism), and activity impairment (% impairment in daily activities in the past 7 days). Only respondents who reported being employed provided data for absenteeism, presenteeism, and overall work impairment. All respondents provided data for activity impairment.
Resource use
Health care utilization was defined by the number of health care provider visits, number of emergency room (ER) visits (How many times have you been to the ER for your own medical condition in the past 6 months?), and number of times hospitalized (How many times have you been hospitalized for your own medical condition in the past 6 months?) in the past 6 months.
Statistical analysis
The prevalence for ACOS among the total adult population, adult asthma population, and adult COPD population was calculated across sex and age group strata. These estimates were made both on the raw data and weighted data (the latter incorporated sampling weights). To calculate the sampling weights, the age, sex, and region distribution of our combined 2010, 2012, and 2013 China NHWS study sample was produced. We then examined the age, sex, and region distribution for the total adult urban China population as reported by the 2012 National Bureau of Statistics of China.24 A ranking procedure was then used to calculate a sample weight for each age by sex by region cell.25 These weights were then assigned to reach respondent based on their cell membership (ie, which sex, age group, and region they belonged to) and applied in relevant analyses.
The overall intent of this analysis was to compare those with ACOS versus those with asthma only versus those with COPD only versus controls. Given the anticipated sample size imbalance as it relates to the control group (which would have statistical implications including, but not limited to, overpowering the analyses), a preliminary propensity score match was undertaken to create a matched control group which is similar to those with COPD and/or asthma but do not have either condition.
Demographic and health history differences among groups (ACOS vs asthma only vs COPD only vs controls) were examined using chi-square tests and one-way analysis of variance tests for categorical and continuous variables, respectively (“prepropensity score matching” differences). Variables which differed between asthma/COPD and no asthma or COPD (ie, controls) at P<0.20 were considered as candidates for inclusion in the propensity score model to identify a matched control group. This list included the following variables: survey year, age, sex, education, household income, body mass index, alcohol use, exercise behavior, smoking habits, and the “adjusted” CCI (ie, the CCI excluding COPD as explained earlier). These variables were then all entered into a logistic regression model to predict asthma/COPD versus no asthma or COPD (ie, controls). Propensity score values were saved from this model. For each case (ie, respondent with asthma or COPD), a single control was identified whose propensity score value was closest using a greedy-matching algorithm.26
Upon completion of the match, two equally sized groups remained: asthma/COPD versus matched controls. The asthma/COPD group was then split into three groups: ACOS, those with asthma only and those with COPD only. The four groups (ACOS, asthma only, COPD only, and matched controls) were then compared with respect to demographic and health history variables (using chi-square tests and one-way analysis of variance tests for categorical and continuous variables, respectively) to identify covariates (“postpropensity score matching” differences).
A regression model approach was then undertaken to compare the four groups (ACOS vs asthma only vs COPD only vs matched controls) with respect to health status, work productivity, and health care resource use controlling for survey year, age, education, household income, body mass index, alcohol use, exercise behavior, smoking habits, and the adjusted CCI. Generalized linear models were used that specified the appropriate distribution (normal for health status variables, negative binomial for all other variables) and link function (identity for health status variables, log for all other variables) according to the best fit to the data.
Results
A total of N=59,935 respondents completed the 2010, 2011, and 2013 China NHWS. These respondents who represent the total urban population were 54.65% male and had a mean age of 41.52 years (standard deviation =14.99). A total of N=1,968 respondents met the definition of COPD (3.28% of the total adult population, 95% confidence interval [CI]: 3.14%, 3.43%), with the majority of respondents reporting a diagnosis of chronic bronchitis (Table 2). A total N=1,191 respondents met the definition of asthma (1.99% of the total adult population, 95% CI: 1.88%, 2.10%) and N=366 respondents met the definition for ACOS (0.61% of the total population [95% CI: 0.55%, 0.67%], 30.73% of those with asthma [95% CI: 28.11%, 33.35%], and 18.60% of those with COPD [95% CI: 16.88%, 20.32%]). The prevalence of these conditions by age and sex is reported in Table 3.
 | Table 2 Overlap of COPD conditions among patients with COPD (N=1,968) |
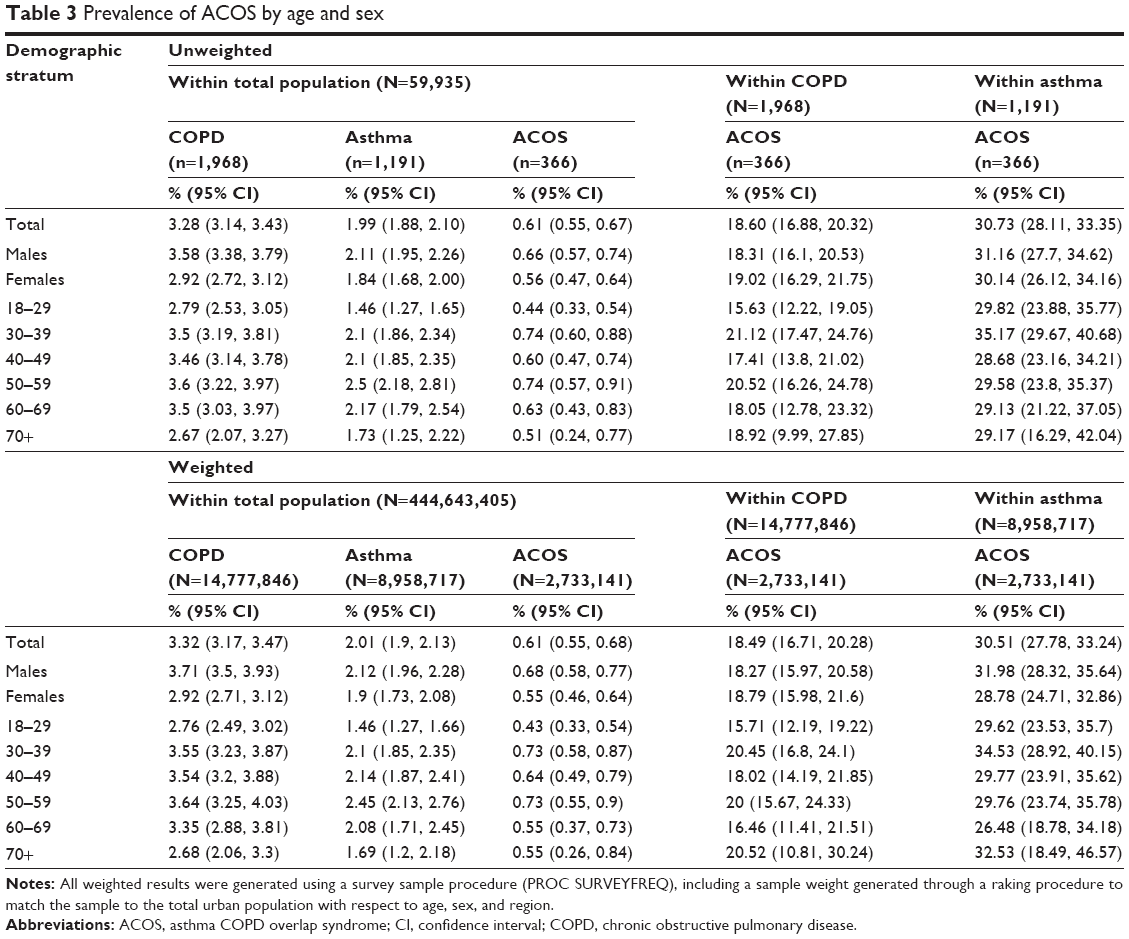 | Table 3 Prevalence of ACOS by age and sex |
Demographic and health history differences among the groups prior to the matching process were examined in Table 4 (prepropensity score matching). Although several differences between control respondents and the asthma/COPD groups were found, few significant differences were observed between patients with ACOS and those patients with asthma only or COPD only. Patients with ACOS were more likely to regularly exercise compared with patients with COPD only (67.76% vs 57.55%, P<0.05) and had a greater comorbidity burden (as measured using the “adjusted” CCI, which did not include COPD) compared with patients with COPD only (1.60 vs 0.42, P<0.05) and patients with asthma only (1.60 vs 0.71, P<0.05). No other significant differences were observed.
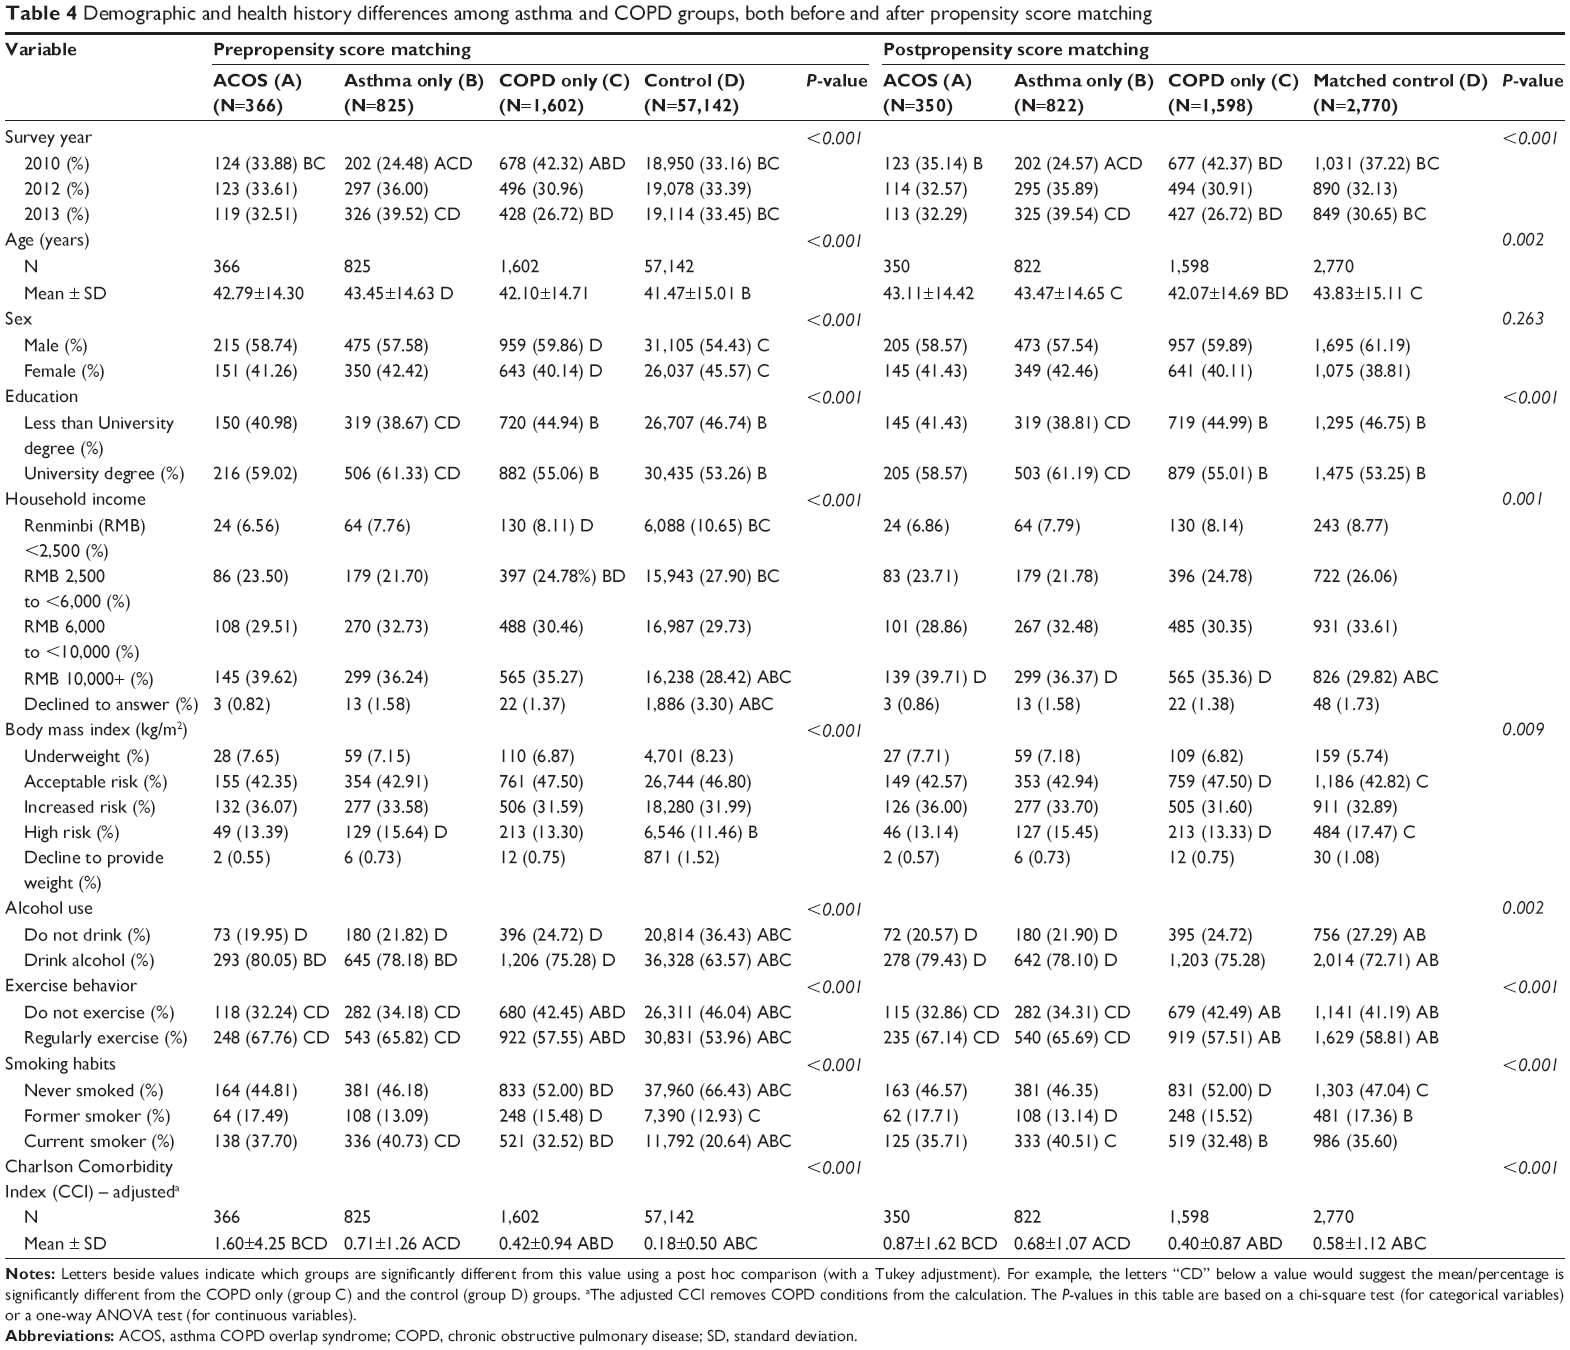 | Table 4 Demographic and health history differences among asthma and COPD groups, both before and after propensity score matching |
With respect to differences in asthma history, patients with ACOS have been diagnosed for longer (11.5 vs 9.9 years for ACOS and asthma only, respectively), reported themselves as more severe when not using their medication (28.69% vs 22.91% self-reported themselves as moderately or severely persistent), and were more likely to attribute the cause of their asthma to allergies, illness, pollutants, stress, and weather than patients with only asthma (all P<0.05; Table 5). Patients with ACOS also reported significantly higher levels of asthma control based on the ACT (18.8 vs 18.3, P<0.05; though both mean less than adequate control).
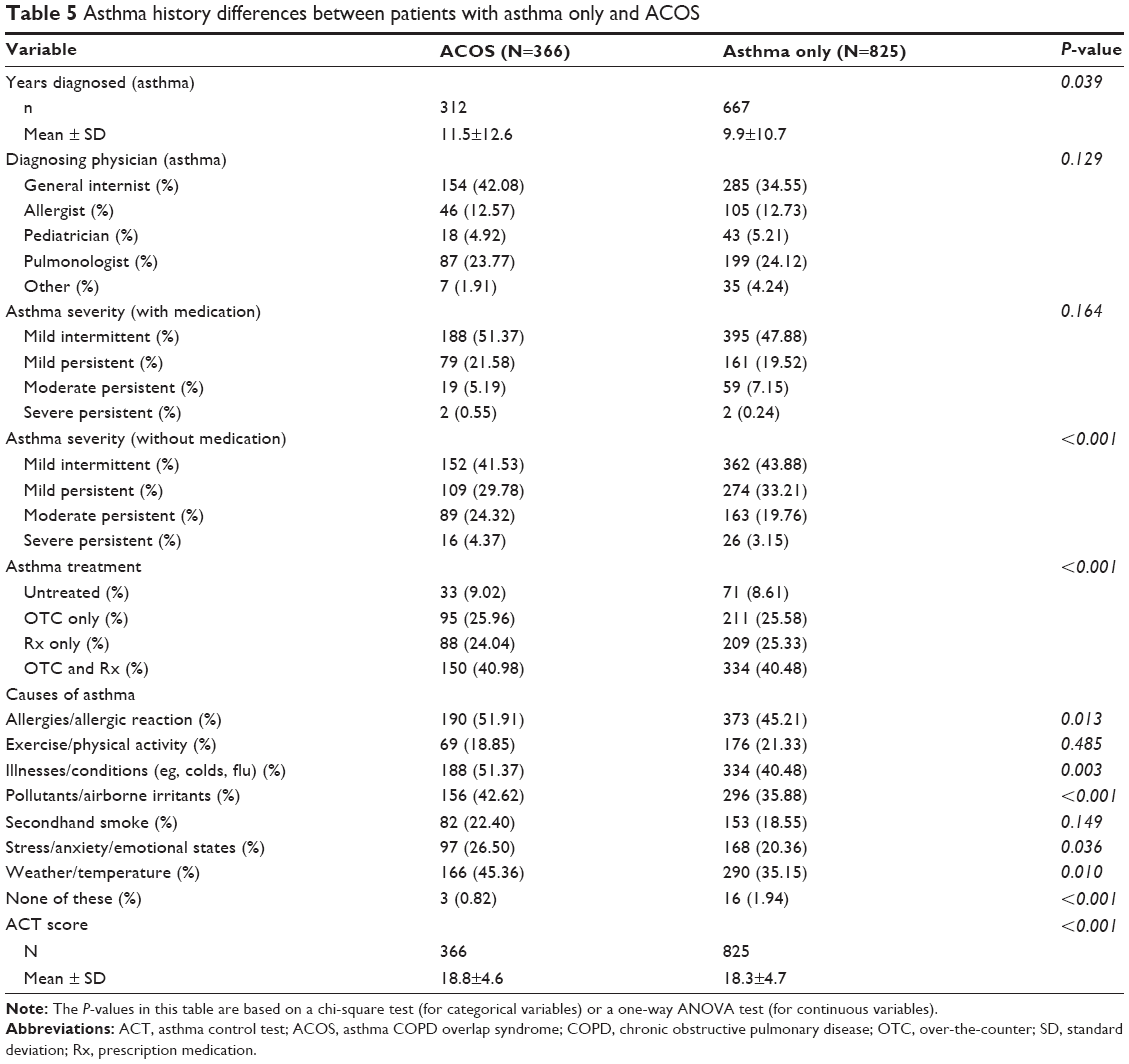 | Table 5 Asthma history differences between patients with asthma only and ACOS |
With respect to differences in COPD history, patients with ACOS were more likely to have been diagnosed by a pulmonologist (33.61% vs 23.28%), reported a greater severity (25.14% vs 24.41% self-reported as either moderate or severe), and experienced more frequent exacerbations and more severe breathlessness (all P<0.05; Table 6). Patients with ACOS were significantly more likely to be treated overall (88.80% vs 52.68%, P<0.05) and were more likely to use a prescription medication (either alone or in combination with a nonprescription treatment; 65.30% vs 52.55%, P<0.05).
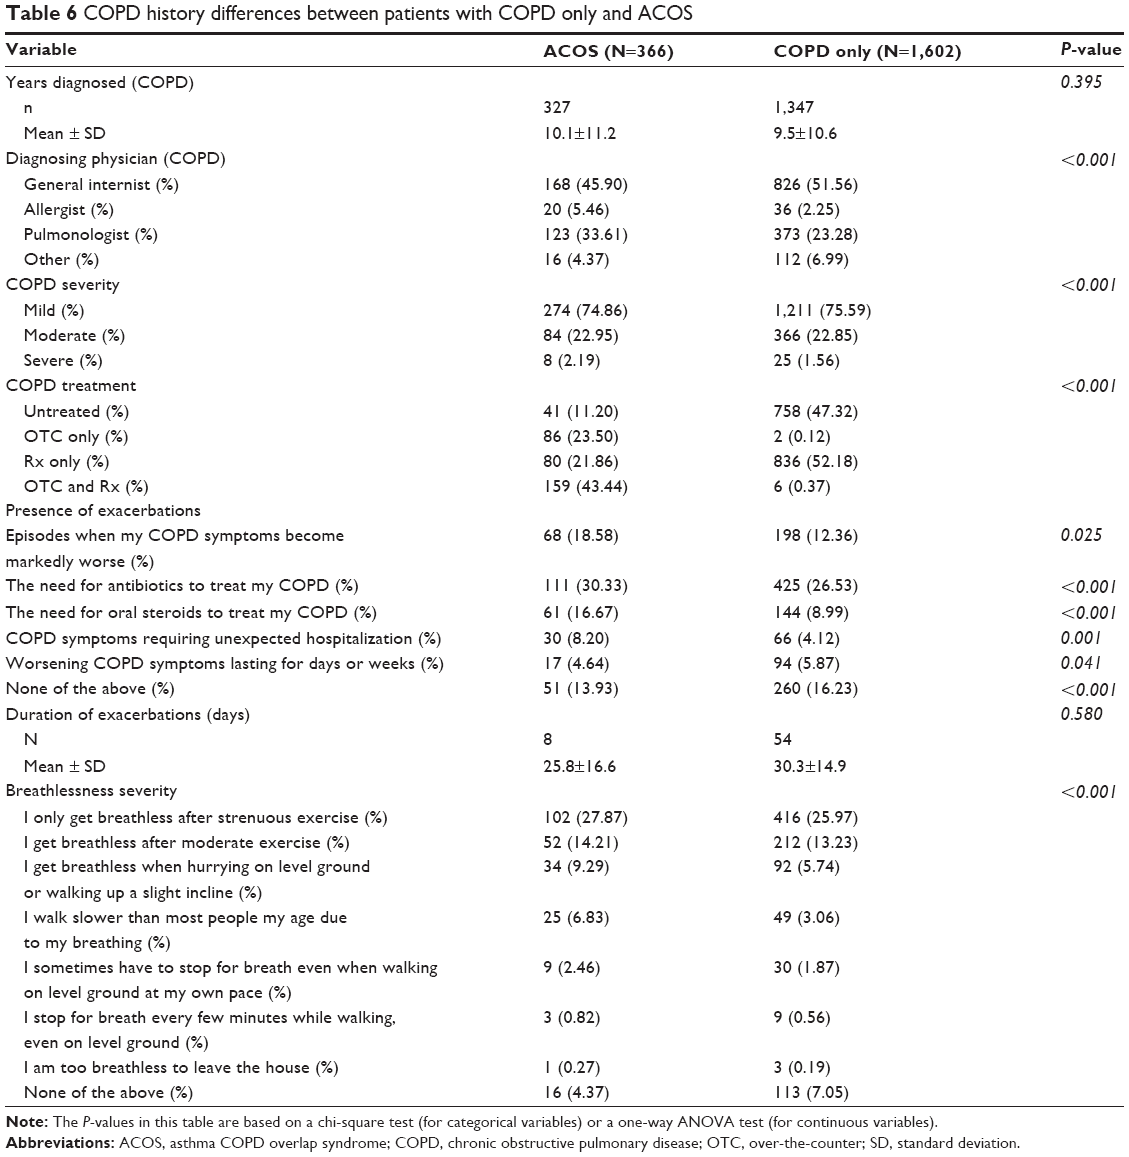 | Table 6 COPD history differences between patients with COPD only and ACOS |
Differences after propensity score matching in demographics and health history are also reported in Table 4 (postpropensity score matching). The intent of the matching process was to create a matched control group similar to the patients with asthma and/or COPD; the intent was not to eliminate any differences between ACOS and patients with asthma only/COPD only. As a result, the demographic and health history differences between ACOS and patients with asthma only/COPD only were largely the same as the prematch results. Patients with ACOS were more likely to exercise regularly compared with patients with COPD only and had a greater comorbidity burden compared with both patients with COPD only and asthma only. No other significant differences were observed.
The ACOS, asthma only, COPD only, and matched control cohorts were then compared among one another with respect to health outcomes, using a regression approach (Table 7). Patients with ACOS reported significantly worse mental component summary and physical component summary scores and worse health utilities compared with matched controls (adjusted mean =40.47 vs 44.85; 44.99 vs 49.86; and 0.63 vs 0.69, respectively; all P<0.05) and patients with COPD only (adjusted mean =40.47 vs 42.88; 44.99 vs 47.66; and 0.63 vs 0.66, respectively; all P<0.05). No significant differences were observed between patients with ACOS and patients with asthma only.
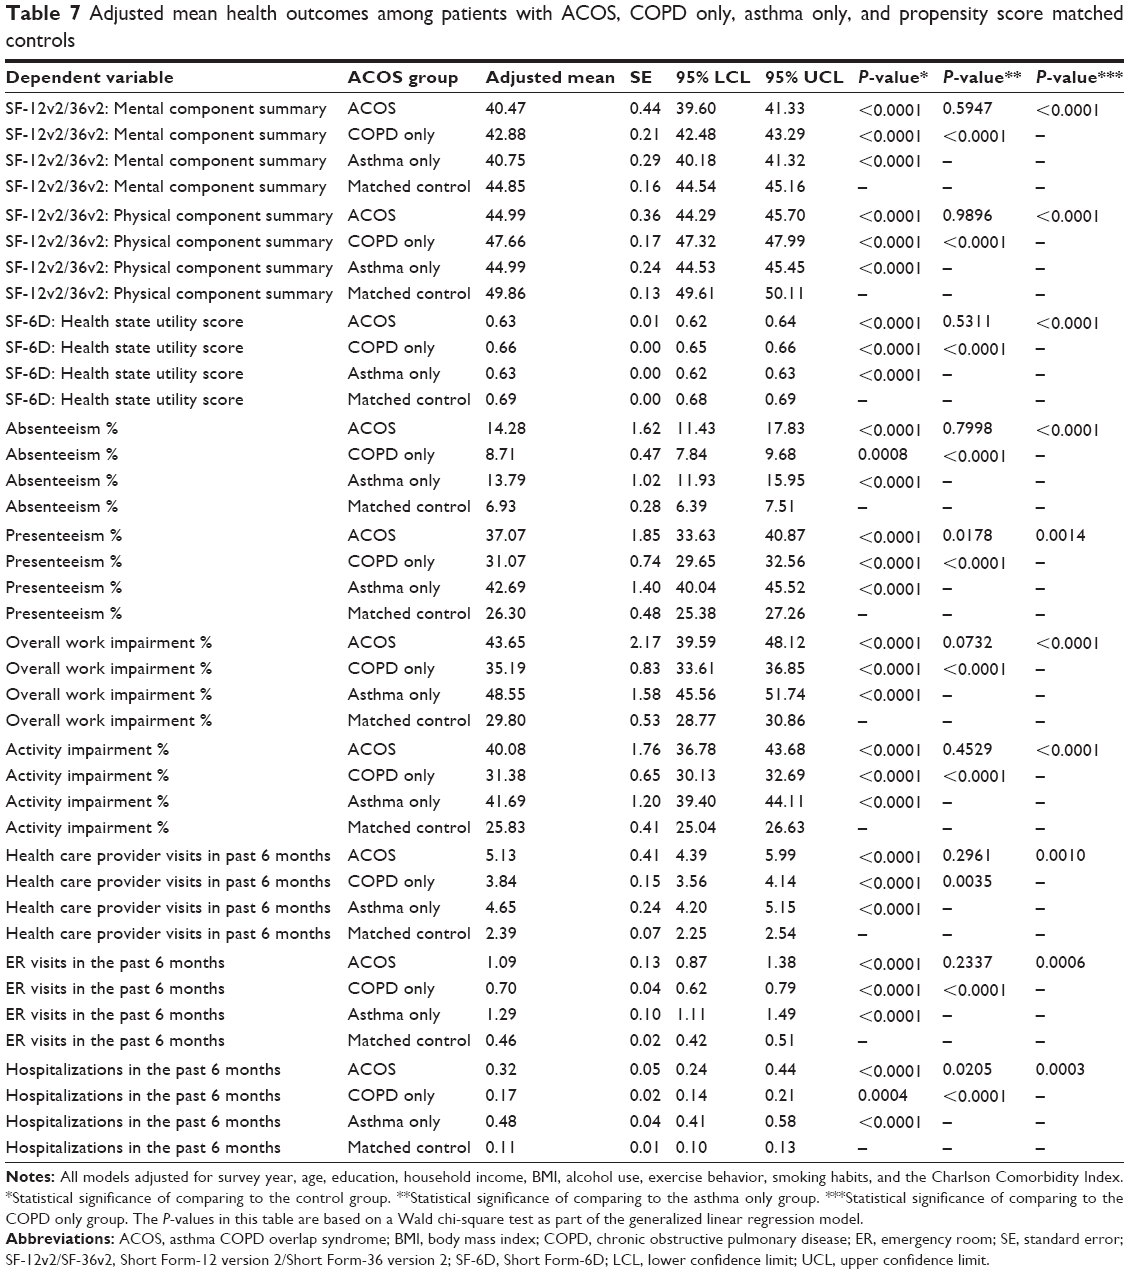 | Table 7 Adjusted mean health outcomes among patients with ACOS, COPD only, asthma only, and propensity score matched controls |
The pattern of results was very similar when examining work and activity impairment outcomes. Patients with ACOS reported significantly greater absenteeism, presenteeism, overall work impairment, and activity impairment compared with matched controls and compared with patients with COPD only. Indeed, levels of overall work impairment and activity impairment for those with ACOS were ~50% higher than matched controls and 25% higher than patients with COPD only. No differences were observed between patients with ACOS and patients with asthma only with the exception of presenteeism, which was actually higher among those with asthma only (adjusted mean =42.69% vs 37.07%, P<0.05).
With respect to health care resource utilization, patients with ACOS reported significantly more physician visits, ER visits, and hospitalizations in the past 6 months compared with matched controls and patients with COPD only. Patients with ACOS reported more than double the number of physician visits (adjusted mean =5.13 vs 2.39) and ER visits (adjusted mean =1.09 vs 0.46) and triple the number of hospitalizations (adjusted mean =0.32 vs 0.11) compared with matched controls (all P<0.05). Although no differences were observed between patients with ACOS and asthma only patients with respect to physician visits and ER visits, asthma only patients reported significantly more hospitalizations compared with ACOS patients (adjusted mean =0.48 vs 0.32, P<0.05).
Discussion
Several studies have documented a significant overlap between asthma and COPD.12,13 Our results suggest that ~30% of adults with asthma also have COPD and ~18% of adults with COPD also have asthma. Overall, 0.61% of the adult population in the People’s Republic of China have ACOS. It is important to note that these prevalence figures were generated purely from patient self-report. As COPD may not be well recognized in the People’s Republic of China and lung function tests may be performed less frequently than in the West, the prevalence of COPD and ACOS may be underrepresented.
The general demographic and health history profile of patients with ACOS was no different between patients with asthma only and COPD only. The major exception was a greater comorbidity burden, as assessed using the CCI. This finding is consistent with Pleasants et al14 who reported that patients with ACOS had significantly more comorbidities than those with asthma or COPD only. However, we did find some additional disease-specific differences. Patients with ACOS had more severe disease than patients with asthma only and patients with COPD only (eg, greater self-reported severity, breathlessness, and more frequent exacerbations).
After creating a matched control group and further adjusting for demographic and health history differences, there was a significant burden for patients with ACOS relative to matched controls and those with COPD only. Patients with ACOS reported significantly worse mental and physical health status and health utilities, to a clinically relevant degree (ie, mental component summary and physical component summary differences exceeded 3 points and health utility differences exceeded 0.03 points), compared with matched controls. Levels of health status were also worse for patients with ACOS compared with patients with COPD only. Additionally, patients with ACOS reported significantly greater impairment and health care resource utilization compared with matched controls and those with COPD only. Indeed, the overall work impairment and activity impairment for patients with ACOS were 50% greater than matched controls and ~25% greater than patients with COPD only. These findings were consistent with studies conducted in other geographies.14,16
However, despite these effects, there was a lack of differences in health outcomes between patients with ACOS and patients with asthma only. This might suggest that the burden of ACOS is primarily a function of asthma as both patients with ACOS and asthma only had similar health outcomes. Framed differently, it is possible that the burden of COPD (both in isolation and as part of ACOS) is weaker in the present study than might be observed in other data sources, which could be a result of our focus on the urban population of the People’s Republic of China (which has a mean age of ~40 years). Many of the patients with COPD in our study are also young. Indeed, when compared with literature from the West using similar methods, the patients with COPD in the present study are between 10 and 20 years younger and diagnosed ~5 years more recently.27 Therefore, the disease may still be in a relatively early stage of progression (though without clinical data, such as forced expiratory volume in 1 second, it is difficult to confirm this post hoc hypothesis).
Although not possible in our present study due to sample size, future research replicating this study among the elderly or those who have been diagnosed with their condition for a certain period of time may be warranted. With such stratification, the pattern of results might be slightly different. For example, focusing on slightly more older patients (with a more comparable distribution of COPD severity as reported elsewhere),27 those with ACOS and those with only COPD may have a greater burden than reported here even though the burden of the asthma only group may be the same. As a result, it is possible our findings are slightly conservative as they produced effects that include an underestimated contribution of COPD (both in the ACOS and COPD only groups).
Limitations
There are a few additional limitations to note. All data were self-reported and there was no verification of diagnosis or disease history for patients with asthma or COPD (or ACOS). This could have resulted in misclassification of patients in the analysis. In particular, as noted earlier, patients with COPD may have been classified as controls and patients with ACOS may have been classified as asthma only patients due to the underreporting of COPD and infrequency of using the lung function test in a clinical setting. With respect to estimating the burden of ACOS, although an attempt was made to rule out alternative explanations for the findings using both a propensity score matching and a regression approach, there may have been other relevant factors which we neglected to include (or were not assessed in the NHWS). Patients with a particularly poor health profile may be underrepresented in the data. As a result, the prevalence and burden estimates may be conservative (given elderly respondents with COPD, asthma, and other comorbidities may be disproportionately less likely to participate). It is also important to note that our sample is intended to represent the entire urban population of the People’s Republic of China which, as shown in Table 1, is a young demographic. Studies focusing on the prevalence and burden of ACOS in a more rural or clinic-based population, both of which may be older and less healthy populations, would likely identify different estimates.
Conclusion
ACOS occurs in 0.61% of the total adult population, ~30% of the asthma population, and ~18% of the COPD population in the People’s Republic of China. Our results suggest patients with ACOS have a greater comorbidity burden and significantly worse health outcomes compared with patients with COPD only and matched controls. Better management of these patients may help in improving their outcomes.
Acknowledgments
The authors would like to acknowledge the contributions of Dr Helen Lin and Mr Jonas Román who provided input into the study design, helped interpret the results, and provided comments on prior drafts of this manuscript.
Disclosure
The China NHWS is a survey conducted by Kantar Health. Dr DiBonaventura is a full-time employee of Kantar Health. AstraZeneca purchased access to the China NHWS data and funded the analysis and preparation of this manuscript. Drs Ding, Karlsson, and Ling are full-time employees of AstraZeneca. The authors report no other conflicts of interest in this work.
References
Druss BG, Marcus SC, Olfson M, Tanielian T, Elinson L, Pincus H. Comparing the national economic burden of five chronic conditions. Health Aff. 2001;20(6):233–241. | ||
Smith DH, Malone DC, Lawson KA, Okamoto LJ, Battista C, Saunders WB. A national estimate of the economic costs of asthma. Am J Respir Crit Care Med. 1997;156(3 Pt 1):787–793. | ||
Akinbami LJ, Moorman JE, Bailey C, et al. Trends in asthma prevalence, health care use, and mortality in the United States, 2001–2010. NCHS Data Brief. 2012;94:1–8. | ||
Global Initiative for Asthma. Global Burden of Asthma Report. Available from: http://www.globalasthmareport.org/resources/Global_Asthma_Report_2014.pdf | ||
Zhang F, Hang J, Zheng B, Su L, Christiani DC. The changing epidemiology of asthma in Shanghai, China. J Asthma. 2015;52(5):465–470. | ||
Su N, Lin J, Liu G, et al. An epidemiological survey of current asthma control status in China [Chinese]. Zhonghua Nei Ke Za Zhi. 2014;53(8):601–606. | ||
Rycroft CE, Heyes A, Lanza L, Becker K. Epidemiology of chronic obstructive pulmonary disease: a literature review. Int J Chron Obstruct Pulmon Dis. 2012;7:457–494. | ||
Zhong N, Wang C, Yao W, et al. Prevalence of chronic obstructive pulmonary disease in China: a large, population-based survey. Am J Respir Crit Care Med. 2007;176(8):753–760. | ||
Xu F, Yin X, Zhang M, Shen H, Lu L, Xu Y. Prevalence of physician-diagnosed COPD and its association with smoking among urban and rural residents in regional mainland China. Chest. 2005;128(4):2818–2823. | ||
Buist AS, McBurnie MA, Vollmer WM, et al; BOLD Collaborative Research Group. International variation in the prevalence of COPD (the BOLD Study): a population-based prevalence study. Lancet. 2007;370(9589):741–750. | ||
Lim S, Lam DC, Muttalif AR, et al. Impact of chronic obstructive pulmonary disease (COPD) in the Asia-Pacific region: the EPIC Asia population-based survey. Asia Pac Fam Med. 2015;14(1):4. | ||
Papaiwannou A, Zarogoulidis P, Porpodis K, et al. Asthma-chronic obstructive pulmonary disease overlap syndrome (ACOS): current literature review. J Thorac Dis. 2014;6(Suppl 1):S146–S151. | ||
Barrecheguren M, Esquinas C, Miravitlles M. The asthma-chronic obstructive pulmonary disease overlap syndrome (ACOS): opportunities and challenges. Curr Opin Pulm Med. 2015;21(1):74–79. | ||
Pleasants RA, Ohar JA, Croft JB, et al. Chronic obstructive pulmonary disease and asthma-patient characteristics and health impairment. COPD. 2014;11(3):256–266. | ||
Kauppi P, Kupiainen H, Lindqvist A, et al. Overlap syndrome of asthma and COPD predicts low quality of life. J Asthma. 2011;48(3):279–285. | ||
Rhee CK, Yoon HK, Yoo KH, et al. Medical utilization and cost in patients with overlap syndrome of chronic obstructive pulmonary disease and asthma. COPD. 2014;11(2):163–170. | ||
Langley PC, Mu R, Wu M, Dong P, Tang B. The impact of rheumatoid arthritis on the burden of disease in urban China. J Med Econ. 2011;14(6):709–719. | ||
WHO Expert Consultation. Appropriate body-mass index for Asian populations and its implications for policy and intervention strategies. Lancet. 2004;363(9403):157–163. | ||
Charlson ME, Pompei P, Ales KL, MacKenzie CR. A new method of classifying prognostic comorbidity in longitudinal studies: development and validation. J Chronic Dis. 1987;40(5):373–383. | ||
Nathan RA, Sorkness CA, Kosinski M, et al. Development of the asthma control test: a survey for assessing asthma control. J Allergy Clin Immunol. 2004;113(1):59–65. | ||
Ware J Jr, Kosinkski M, Keller SD. A 12-item Short-Form Health Survey: construction of scales and preliminary tests of reliability and validity. Med Care. 1996;34(3):220–233. | ||
Tan ML, Wee HL, Lee J, et al. The Short Form 36 English and Chinese versions were equivalent in a multiethnic Asian population. J Clin Epidemiol. 2013;66(7):759–767. | ||
Reilly MC, Zbrozek AS, Dukes EM. The validity and reproducibility of a work productivity and activity impairment instrument. Pharmacoeconomics. 1993;4(5):353–365. | ||
National Bureau of Statistics in China. Available from: http://www.stats.gov.cn/english/. Accessed December 19, 2014. | ||
Kalton G. Compensating for Missing Survey Data. 1983. Survey Research Center, Institute for Social Research, University of Michigan. | ||
Parsons LS. Reducing bias in a propensity score matched-pair sample using greedy matching techniques. Poster presented at SAS Users Group International; 2001; Long Beach, CA; Paper 214-26. | ||
Allen-Ramey FC, Gupta S, DiBonaventura MD. Patient characteristics, treatment patterns, and health outcomes among COPD phenotypes. Int J Chron Obstruct Pulmon Dis. 2012;7:779–787. |
 © 2016 The Author(s). This work is published and licensed by Dove Medical Press Limited. The
full terms of this license are available at https://www.dovepress.com/terms
and incorporate the Creative Commons Attribution
- Non Commercial (unported, 3.0) License.
By accessing the work you hereby accept the Terms. Non-commercial uses of the work are permitted
without any further permission from Dove Medical Press Limited, provided the work is properly
attributed. For permission for commercial use of this work, please see paragraphs 4.2 and 5 of our Terms.
© 2016 The Author(s). This work is published and licensed by Dove Medical Press Limited. The
full terms of this license are available at https://www.dovepress.com/terms
and incorporate the Creative Commons Attribution
- Non Commercial (unported, 3.0) License.
By accessing the work you hereby accept the Terms. Non-commercial uses of the work are permitted
without any further permission from Dove Medical Press Limited, provided the work is properly
attributed. For permission for commercial use of this work, please see paragraphs 4.2 and 5 of our Terms.