")
Back to Journals » Risk Management and Healthcare Policy » Volume 14
Associations Between Trajectory of Different Blood Pressure Components in Pregnancy and Risk of Adverse Birth Outcomes – A Real World Study
Authors Ma S , Wu L, Yu Q, Chen D, Geng C, Peng H , Yu L, Zhang M
Received 6 May 2021
Accepted for publication 22 July 2021
Published 8 August 2021 Volume 2021:14 Pages 3255—3263
DOI https://doi.org/10.2147/RMHP.S318956
Checked for plagiarism Yes
Review by Single anonymous peer review
Peer reviewer comments 2
Editor who approved publication: Dr Jongwha Chang
Shengqi Ma,1,* Lei Wu,2,* Qing Yu,3,* Donghui Chen,2 Chunsong Geng,3 Hao Peng,1 Lugang Yu,2 Mingzhi Zhang1
1Department of Epidemiology, School of Public Health, Medical College of Soochow University, Suzhou, Jiangsu, People’s Republic of China; 2Department of Maternal and Child Health, Suzhou Industrial Park Centers for Disease Control and Prevention, Suzhou, Jiangsu, People’s Republic of China; 3Department of Gynecology and Obstetrics, Suzhou Kowloon Hospital, Suzhou, Jiangsu, People’s Republic of China
*These authors contributed equally to this work
Correspondence: Lugang Yu
Department of Maternal and Child Health, Suzhou Industrial Park Centers for Disease Control and Prevention, 200 Suhong West Road, Industrial Park, Suzhou, 215123, People’s Republic of China
Tel +86 512 6761 4200
Fax +86 512 6761 4233
Email [email protected]
Mingzhi Zhang
Department of Biostatistics, School of Public Health, Medical College of Soochow University, 199 Renai Road, Industrial Park, Suzhou, 215123, People’s Republic of China
Tel +86 512 6588 0079
Fax +86 512 6588 0052
Email [email protected]
Background: High blood pressure during pregnancy has been suggested to be associated with adverse birth outcomes (ABO), but it is unclear how different blood pressure changes and the extent of the effect. Therefore, we aimed to investigate the association between blood pressure trajectories (systolic blood pressure (SBP), diastolic blood pressure (DBP), mean arterial pressure (MAP), pulse pressure (PP)) of pregnant women and ABO in a real-world study.
Material and Methods: Leveraging 28,679 pregnant women and their fetuses from a register-based cohort from January 1, 2010, to December 31, 2019. Blood pressure trajectories were estimated by package “traj” in R software using real-world blood pressure data of routine antenatal care examinations. Logistic regression models were applied to examine the association between trajectories of different blood pressure components (SBP, DBP, MAP, and PP) during pregnancy and the risk of ABO.
Results: Trajectories of all blood pressure components were identically labeled as low-stable, moderate-increasing, moderate-decreasing and high-stable. After adjusting for confounding factors, compared with pregnant women with the low-stable pattern, pregnant women with a high-stable or moderate-increasing pattern had a significantly increased risk of developing adverse birth outcomes. Pregnant women with a moderate-decreasing pattern had no significant increased risk of ABO but had a lower risk of adverse birth outcomes than those with a moderate-increasing pattern. The trajectories crossed at 17– 20 weeks of gestation for all blood pressure components.
Conclusion: Our study results indicated that reduction and maintenance of blood pressure to a low level of less than 110 mmHg for SBP and 65 mmHg for DBP after 20 weeks of gestation would benefit prevention of adverse birth outcomes, regardless of the level of blood pressure at early pregnancy.
Keywords: blood pressure, trajectory, pregnancy, adverse birth outcomes, real-world study
Introduction
Adverse birth outcomes (ABO), such as preterm birth,1,2 low Apgar score,3,4 and low birth weight,5,6 are not only the leading causes of perinatal morbidity and mortality but also associated with a wide range of disorders in early life (eg, bronchopulmonary dysplasia,7 epilepsy,8 and cognitive impairment9) and adulthood (eg, obesity,10 diabetes,11 kidney disease,12 hypertension,13 heart failure14 and other cardiovascular disease15,16). The number of preterm infants born worldwide was nearly 15 million annually and continued to grow17 and China ranked in the second, accounting for 7.8% proportion of global preterm births.18 In addition, the proportion of infant mortality due to premature birth or low birth weight was still on the rise.19 It is essential and imperative to identify the risk factors and potential mechanisms behind ABO.
Blood pressure during pregnancy is not only a representation of maternal adaptive response to meet the increased metabolic demands of the mother and fetus and uteroplacental circulation needs,20 but also a dynamic process associated with physiological and hemodynamic changes in cardiovascular system.21 Inability to adapt to these physiological changes can result in hypertensive disorders of pregnancy22,23 which delivers adverse influence on birth outcomes.24,25 For example, pregnant women who have a steeper increase of blood pressure were associated with a lower infant birth weight and a higher proportion of preterm birth.26–28 These findings suggest a potential role of the long-term trajectory of blood pressure during pregnancy in the development of ABO. To date, some studies have examined the associations of trajectories of systolic (SBP) and diastolic blood pressure (DBP) during pregnancy with ABO.26,28 However, the associations of trajectories of other blood pressure components such as mean arterial pressure (MAP) and pulse pressure (PP) with ABO have been scarcely studied. Further, MAP29,30 and PP31,32 showed a somewhat better prediction of hypertensive disorders of pregnancy than SBP and DBP. Therefore, we aimed to examine the association of trajectories of different blood pressure components (SBP, DBP, MAP, and PP) with ABO in a large cohort including 28,679 Chinese pregnant women with serial blood pressure assessments registered in the perinatal health registration system of Suzhou Industrial Park.
Method
Participants
In the perinatal health registration system of Suzhou Industrial Park, a total of 53,008 women registered and provided their antenatal care information and delivery data from January 1, 2010, to December 31, 2019. After excluding those who did not undertake routine antenatal care examinations or had multiple births (n= 24,329), 28,679 pregnant women were included in the current analysis. All participants provided written informed consents. The protocols of this study were approved by the Ethics Committees at Soochow University and Maternal and Child Healthcare Center of Suzhou Industrial Park (Approval NO. ECSU-2,019,000,118). The research was conducted ethically in accordance with the World Medical Association Declaration of Helsinki.
Measurement of Blood Pressure
Blood pressure measurements during pregnancy were collected from medical records. According to the policy of antenatal care in Suzhou city, blood pressure monitor was initiated at ~12 weeks of gestation, followed by repeated measurements every 4 weeks before 32 weeks of gestation, every 2 weeks at 33–36 weeks of gestation, and every week at over 36 weeks of gestation until delivery. At each visit, it was required to measure blood pressure 3 times using electronic sphygmomanometer (OMRON HBP-1320) by physicians following a standardized protocol, after resting for at least 5 minutes in a sitting position. Means of the last two measurements were recorded as SBP and DBP for each visit of antenatal care. MAP was calculated as (SBP-DBP)/3 + DBP and PP was calculated as SBP – DBP.
Definitions of Adverse Birth Outcomes
ABO in our study was defined as having at least 1 of the following outcomes: perinatal deaths, preterm birth, low Apgar score, low and high birth weight. Perinatal death was defined as the death of a baby between 22 weeks of gestation (or weighting over 500 g) and 7 days after birth.33,34 Preterm birth was recorded as all births before 37 completed weeks of gestation or fewer than 259 days from the first date of a woman’s last menstrual period.35 Newborns with a weight of <2500 g were defined as low birth weight36 and those with a weight of ≥4000 g were considered as high birth weight.37 Apgar scores less than 7 at 1 or 5 min after birth were recorded as a low Apgar score.3
Assessment of Covariates
Demographic information (age, education level), pregnancy times, parity, prepregnancy weight and body mass index (BMI) was collected at the first examination. The fetus sex was obtained from birth records.
Statistical Analysis
Characteristics of our participants were presented according to experienced ABO or not. To examine the association between blood pressure patterns during pregnancy and incidence of ABO, we first classified the participants into groups with different trajectories of blood pressure components, followed by analysis on the association between the generated trajectories and ABO. In specific, trajectory identification was performed by the R package “traj”38 using kmeans function39 to determine the optimal number of clusters. The procedure involves three steps (1) calculating 24 measures describing the features of the trajectories, (2) using factor analysis to select a subset of the 24 measures and (3) using cluster analysis to identify clusters of trajectories, and classify each individual trajectory in one of the clusters. We constructed a logistic regression model in which trajectories (SBP/DBP/MAP/PP, individually) was the independent variable and ABO (y/n) was the dependent variable, adjusting for maternal age, pregnancy times, parity, culture degree, prepregnacy BMI, and infant sex. These covariates have been associated with ABO in previous literature.
Sensitivity Analysis
To examine whether chronic hypertension influence our results, participants who has been diagnosed with hypertension before pregnancy were excluded. The associations between trajectory of each blood pressure component and specific ABO events were also examined. Receiver-operating characteristic (ROC) curves were established to assess the prediction value of different blood pressure components for the risk of ABO. All statistical analyses were conducted using R 4.0.2. P-value of less than 0.05 was considered statistically significant.
Results
Baseline Characteristics of Study Participants
A total of 28,679 pregnant women (mean aged 27.7 years) were included in our study. Among them, 3,785 (13.20%) experienced ABO, including perinatal deaths (42, 0.15%), preterm birth (1006, 3.51%), low Apgar score (245, 0.85%), low birth weight (674, 2.35%), and high birth weight (2413, 8.41%). Their characteristics are shown in Table 1. Pregnant women who experienced ABO were more likely to be older, had more pregnancy times and higher levels of prepregnancy BMI, SBP, DBP, and MAP at the first examination than those who did not (all P<0.05).
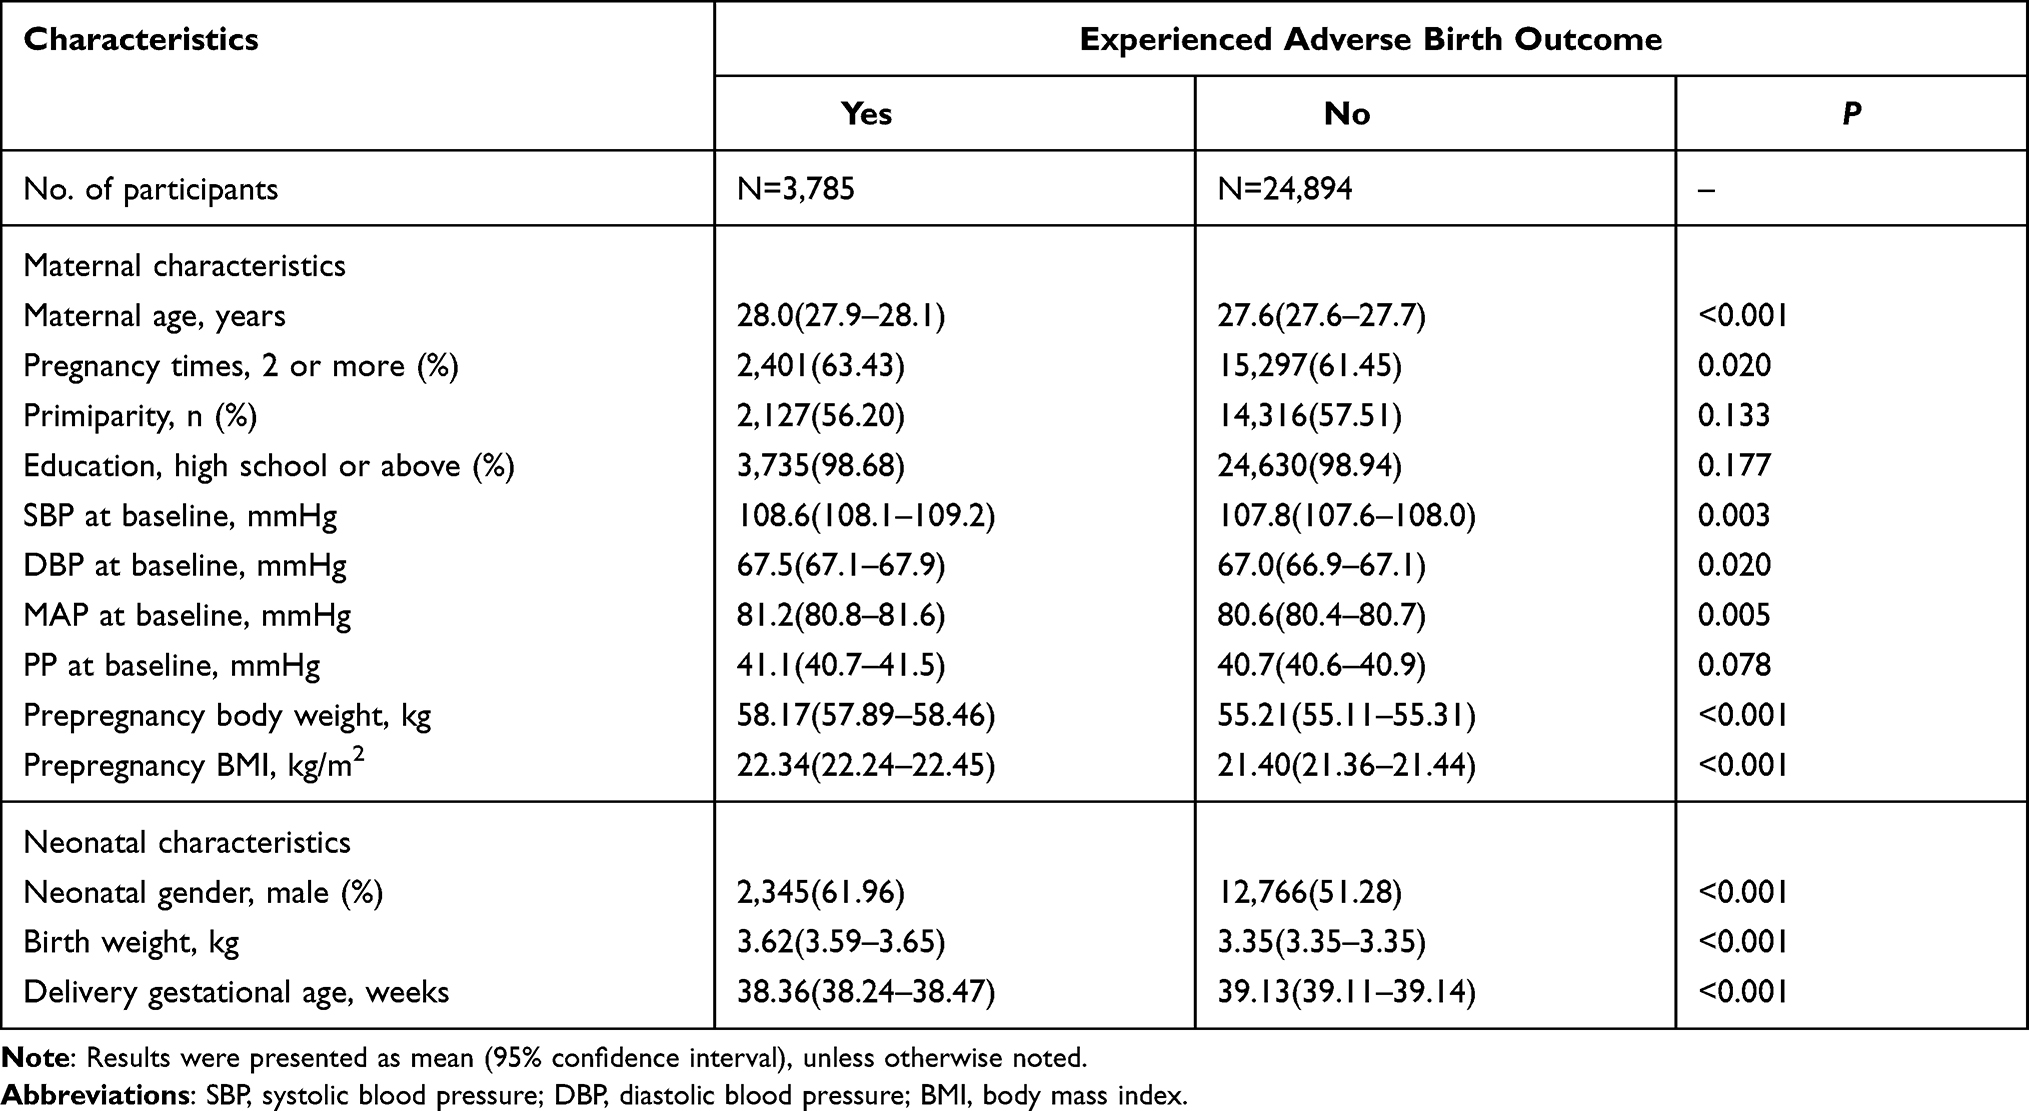 |
Table 1 Maternal and Fetal Characteristics at Baseline |
Trajectories of Blood Pressure Components During Pregnancy
Based on the repeated measurements of blood pressure during pregnancy, four distinct trajectories of each blood pressure component were finally identified (Figure 1). Trajectories of all blood pressure components were identically labeled as low-stable, moderate-increasing, moderate-decreasing, and high-stable All participants were allocated into the four groups based on their trajectories. In specific, pregnant women who had a relatively lower and higher blood pressure during the whole pregnancy were defined as low-stable and high-stable pattern, respectively. Individuals whose blood pressure was relatively lower at baseline but progressively increased during pregnancy were defined as moderate-increasing pattern and those whose blood pressure was relatively higher at baseline but progressively decreased during pregnancy were defined as moderate-decreasing pattern. Of note, the trajectories crossed at 17–20 weeks of gestation for all blood pressure components.
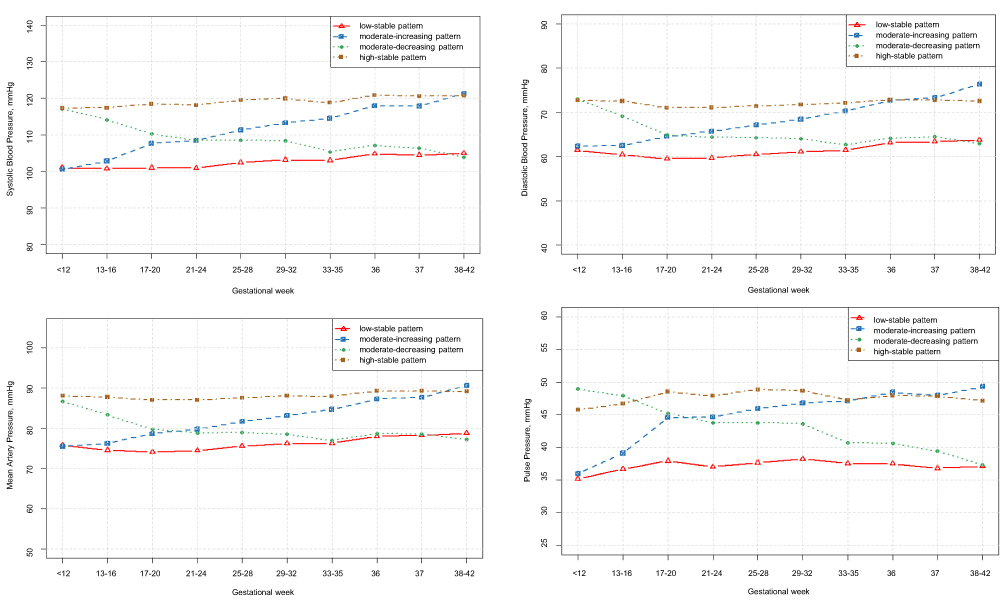 |
Figure 1 Illustration of trajectories of blood pressure components during pregnancy in real world. The patterns of blood pressure trajectory were labeled as low-stable, moderate-increasing, moderate-decreasing and high-stable. |
Association Between Trajectories of Blood Pressure Components and ABO
Amongst the four patterns of SBP trajectory (Figure 2), ABO incidence was the lowest in pregnant women with a low-stable pattern (11.90%), followed by individuals with a moderate-decreasing (12.46%) and a moderate-increasing (14.29%) pattern, respectively, and was the highest in those with a high-stable pattern (14.78%). Similar distribution of ABO incidence was observed among trajectories of DBP, MAP, and PP (Figure 2).
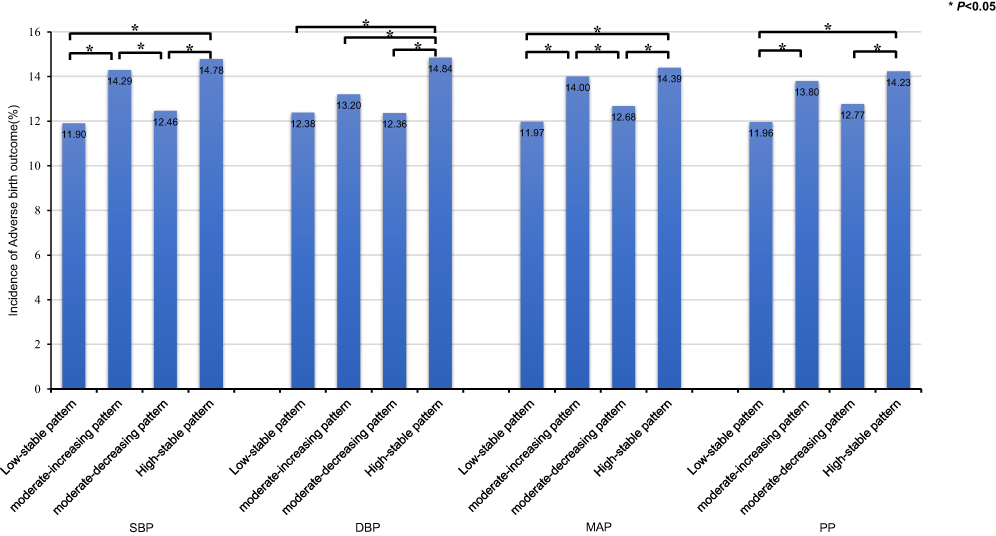 |
Figure 2 Incidence of specific adverse birth outcomes according to trajectories of systolic blood pressure, diastolic blood pressure, mean artery pressure, and pulse pressure. |
Compared to pregnant women with a low-stable pattern of SBP trajectory, those with a moderate-increasing (OR=1.024, P<0.001) and a high-stable (OR=1.029, P<0.001) pattern had a significantly increased risk of ABO, whereas those with a moderate-decreasing pattern (OR=1.006, P=0.316) seemed to have a similar risk of ABO (Table 2). After adjusting for maternal age, pregnancy times, parity, culture degree, prepregnacy BMI and infant sex, pregnant women with a moderate-increasing and a high-stable pattern had a similar risk of developing ABO, which was 1.024 times the risk of developing ABO as those with a low-stable pattern (OR=1.024, P<0.001).
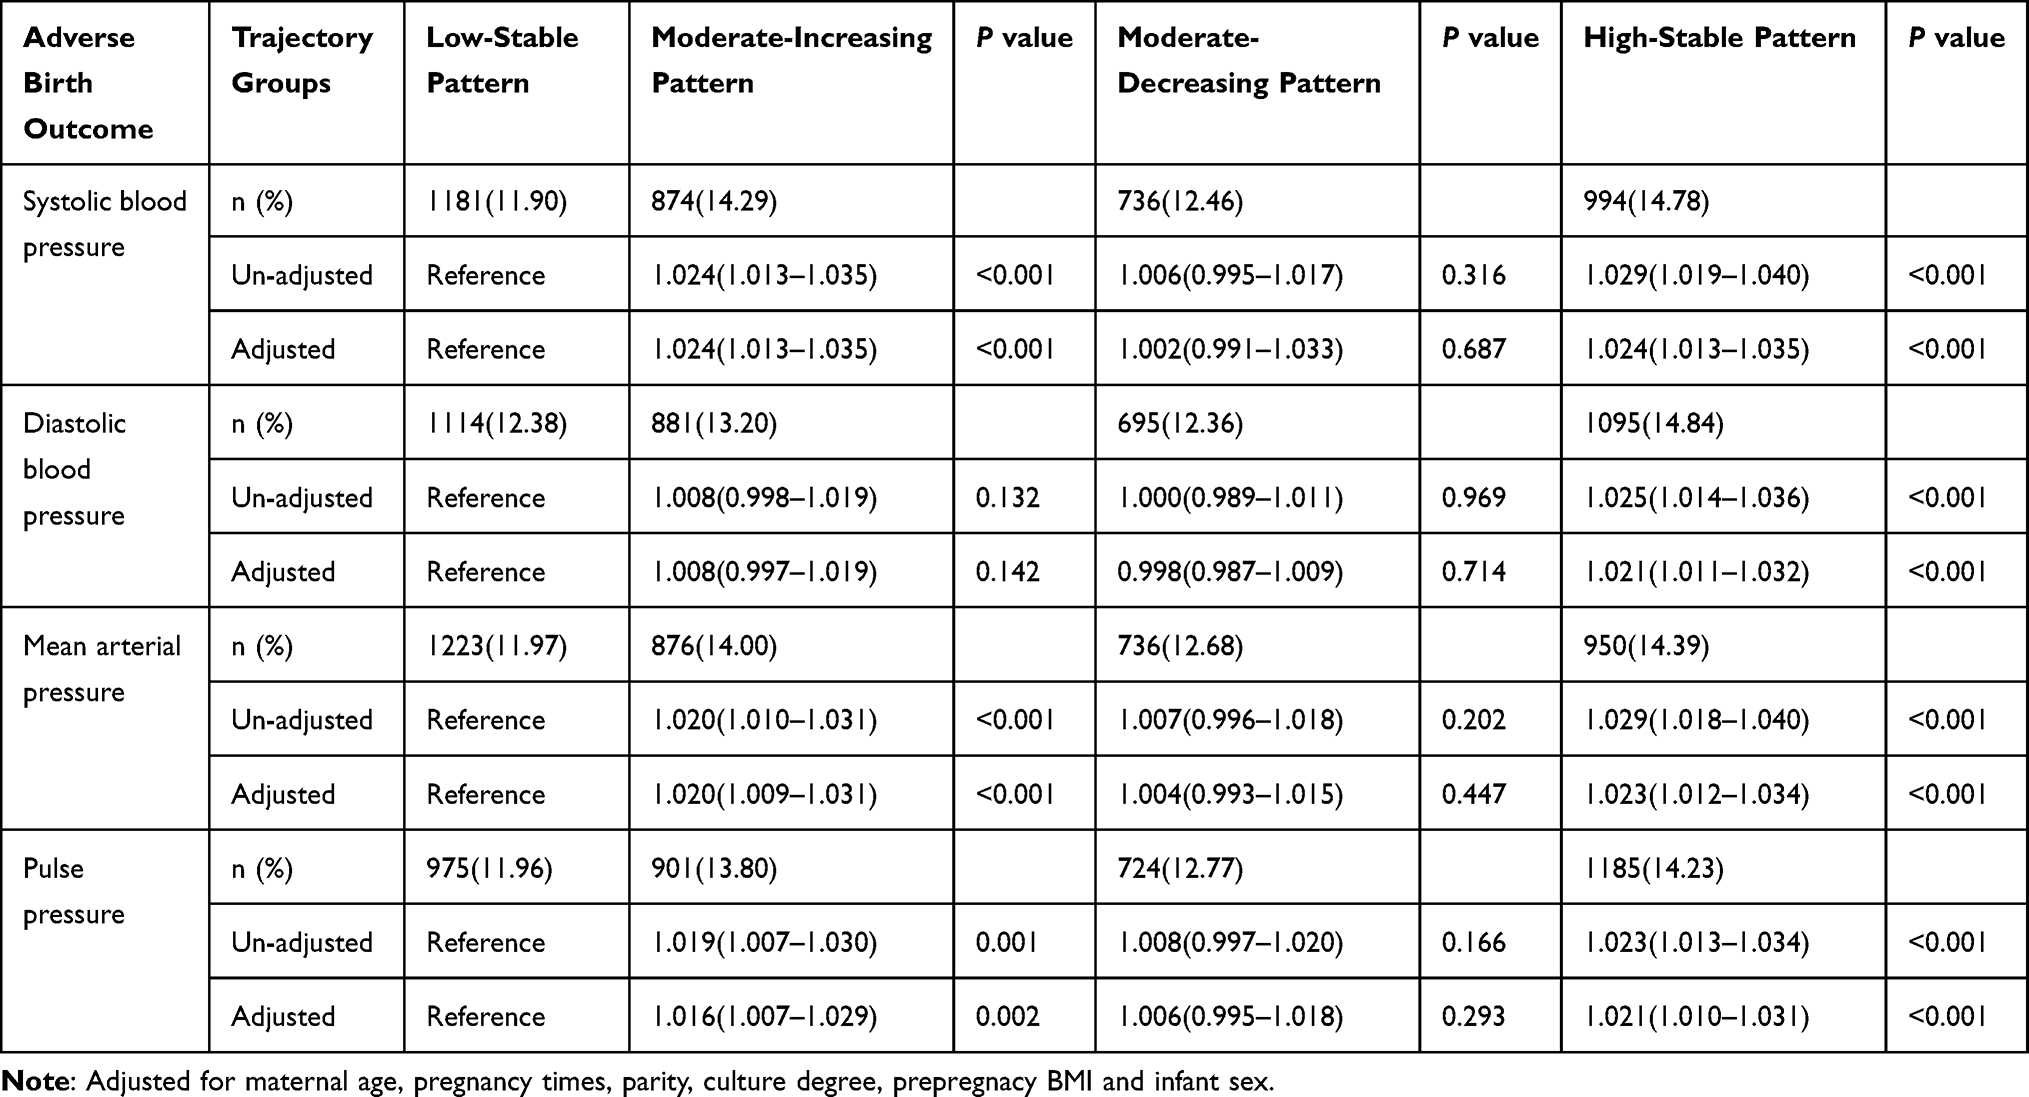 |
Table 2 Associations Between Trajectories of Blood Pressure Components and the Incidences of Adverse Birth Outcome (N=28,679) |
Similar associations were found between trajectories of other blood pressure components and ABO (Table 2). After multivariate adjustment, participants with a moderate-increasing (OR [95% CI] = 1.008 [0.997–1.019], 1.020 [1.009–1.031], and 1.016 [1.007–1.029] for DBP, MAP, and PP, respectively,) and a high-stable pattern (OR [95% CI] = 1.021[1.011–1.032], 1.023[1.012–1.034], and 1.021[1.010–1.031] for DBP, MAP, and PP, respectively,) had an increased risk of developing ABO, compared to those with a low-stable pattern. No significant difference in odds of ABO for participants with a moderate-decreasing pattern in comparison with those with a low-stable pattern of all blood pressure components (all P>0.05).
Result of Sensitivity Analysis
After excluding the 309 pregnant women with chronic hypertension before pregnancy, the association between blood pressure and ABO did not change (Supplementary Table 1). Pregnant women with a moderate-increasing pattern or a high-stable pattern of all blood pressure components also had an increased risk of experiencing specific ABO events, compared to those with a low-stable pattern (Supplementary Table 2–5). We failed to find a significant difference in prediction performance of different blood pressure components for the risk of ABO (Supplementary Figure 1).
Discussion
To the best of our knowledge, this is the first study to explore the association between trajectories of different blood pressure components (SBP, DBP, MAP, and PP) during pregnancy and ABO in pregnant women based on real-world data of routine antenatal care examinations in a district of Suzhou, China. Trajectories of all blood pressure components were identically labeled as low-stable, moderate-increasing, moderate-decreasing, and high-stable. Pregnant women with a high-stable or moderate-increasing pattern had a significantly increased risk of developing ABO. Notably, pregnant women with a moderate-decreasing pattern had no significant increased risk of ABO compared to those with a low-stable pattern, but had a lower risk of ABO than those with a moderate-increasing pattern. The trajectories crossed at 17–20 weeks of gestation for all blood pressure components. These results may suggest that reduction and maintenance of blood pressure to a low level of less than 110 mmHg for SBP and 65 mmHg for DBP after 20 weeks of gestation would benefit prevention of ABO, regardless of the level of blood pressure at early pregnancy. Although blood pressure changes in different trajectories are within the physiological range of normal blood pressure, tracking blood pressure during pregnancy may provide clues to identify women at a high risk at developing ABO.
In line with our study, the association between elevated blood pressure during pregnancy and the risk of ABO was also found in previous studies. For example, Zhu et al reported a significant dose–response relationship between blood pressure within the normal range and the risk of ABO during pregnancy.24 Guo et al found that pregnant women with moderate-increasing pattern of SBP had higher risk of developing ABO.28 A large population-based study concluded that the risk of small for gestational age (SGA) infants increased by 2.0% per 1 mm Hg rise in DBP during the whole pregnancy.40 So far, substantial studies have concentrated on the relationship between trajectories of SBP and DBP and the risk of ABO, but the associations of trajectories of MAP and PP with the risk of ABO has not been studied. Moreover, some studies found that MAP and PP have a better predicting value for hypertensive disorders of pregnancy than SBP and DBP.29,31 We are the first to examine the association between trajectories of MAP and PP during pregnancy and the risk of ABO. Our study enriches the literature on blood pressure during pregnancy and adverse fetal outcomes.
In addition, our data show that compared to those who maintain low-stable blood pressure levels during pregnancy, there was no increased risk of ABO in women with high blood pressure in early pregnancy and a gradual decrease in the second to third trimesters. This result was corroborated by other previous studies. A prospective cohort study suggested that compared women with the lowest blood pressure, pregnant women with decreasing SBP, DBP and MAP during pregnancy do not increase the risk of lower infant birth weight.26 A randomized controlled trial demonstrated that routine antihypertensive therapy of mild to moderate pregnancy-induced hypertension was associated with lower incidence of maternal and fetal adverse events, including preterm birth and SGA.41 Together with these findings, our finding suggests that reducing higher blood pressure during pregnancy, in theory, can reduce the incidence of ABO.
Substantial evidences have demonstrated that a progressively rising blood pressure during pregnancy can cause cardiac output reduction and higher total peripheral vascular resistance.42 Also, the renin-angiotensin system and utero-placental dysregulation can lead to reduced blood flow and poor placental perfusion, these change in physiological mechanisms contribute to fetal growth restriction through chronic fetal hypoxia, such as preterm birth and low birth weight.43,44 Therefore, elevated blood pressure within the normal range during pregnancy also requires blood pressure management and intervention at the appropriate time. However, the international guidelines for hypertension in pregnancy only recommend pharmacological treatment for pregnant women whose blood pressure reaches a level of severe hypertension,45,46 no studies have pointed out when it is the best time to control blood pressure for women whose blood pressure is elevated during pregnancy but still within a reasonable range. We found that all blood pressure components crossed at 17–20 weeks of gestation, suggesting that at 20 weeks of gestation may be the optimum time window to initiate antihypertensive interventions to maintain an optimal blood pressure. Blood pressure drops gradually after this time point of pregnancy can reduce the risk of ABO, regardless of the level of blood pressure in early pregnancy. Nevertheless, our study is only a prospective observational study and more research and clinical trials are necessary to support our discovery.
Because the protective effect of antihypertensive drugs remains questionable, more attention should be paid to non-pharmacological intervention when there are no clinical signs of elevated blood pressure in the second trimester of pregnancy. An experimental trial showed that stretching exercise could decrease SBP and DBP in the second trimester of pregnancy and control their increase in the third trimester of pregnancy.47 Stretching is an easy exercise to achieve and stick to, health professionals should encourage pregnant women to perform such exercises, such as yoga. High levels of stress during pregnancy are associated with the development of pregnancy-induced hypertension.48 A clinical trial showed that conducting progressive muscle relaxation and breathing control exercises to relieve stress after 20 weeks of gestational age can effectively reduce blood pressure in pre-hypertensive pregnant women to the normal range within 4 weeks.49 Therefore, pregnant women can reduce high levels of blood pressure during pregnancy through individualized lifestyle intervention, and reduce the incidence of adverse fetal outcomes.
Our research has several strengths. Original data were obtained from a real-world of general pregnant population, the sample size was relatively large and each participant had 4 or more blood pressure measurements, the results have relatively good reliability that can be extrapolated to the general population. In addition, the prediction model is based on a routine clinical prenatal care regimen, blood pressure measurements are readily available, and trajectories of different blood pressure components can be plotted separately, which have the potential to serve as a simple and noninvasive method for clinical blood pressure assessment and adverse fetal outcomes prevention. Furthermore, we are extracting data from electronic maternal and child health systems or medical records, which helps to obtain robust and reliable results.
There were also several limitations. First, regarding the actual antenatal care, not all participants went for pregnancy examinations regularly, and there were variations between visits at each time point and between subjects. To minimize the variance, we excluded women who had fewer than four blood pressure measurements during pregnancy. Second, blood pressure measurements were collected from medical records. It cannot be ensured that the standard protocol was strictly followed in all measurements. However, this is one of the reasons why a real-world study is needed. In addition, certain confounders for neonatal risk, such as history of disease, diet and lifestyle habits, nutritional status, medication use, and renal function were unavailable; thus, we were unable to control for the impact of these variables. Third, our study population was from a more economically developed areas of southeastern China and most of our participants had Han ethnicity, previous study reported the substantial ethnic differences in blood pressure levels and risk of gestational hypertensive disorders,50 our finding might not be generalizable to other populations. Last, the effect of blood pressure changes on adverse fetal outcomes, although reaching statistical significance, was quite small in the current study. Therefore, more research should be conducted in the future. Nonetheless, to the best of our knowledge, this was the first study to examine the association between trajectory of different blood pressure components in pregnancy and risk of adverse birth outcomes, thus providing a novel contribution to the literature.
In conclusion, this study suggested that the risk of ABO was significantly increased in pregnant women with the moderate-increasing pattern or high-stable of different blood pressure components (SBP, DBP, MAP, and PP) during pregnancy compared to those with low-stable pattern, while the risk of ABO is not increased in women with a moderate-decreasing pattern, and blood pressure management can achieve better preventive effect after 20 weeks. Thus, obstetricians and pregnant women should pay attention to routine prenatal examination and the change of blood pressure during pregnancy, and recommend pregnant women to control blood pressure increase or gradually reduce the higher blood pressure in the early pregnancy by increasing exercise and other ways to keep it at a low and stable level as far as possible.
Acknowledgments
We gratefully acknowledge the cooperation and participation of the members participating in the study and their families.
Funding
This study was supported by the National Natural Science Foundation of China (NO. 81903384 and 81872690), the Natural Science Foundation of Jiangsu Province (NO. BK20180841), the Suzhou Municipal Science and Technology Bureau (NO. SS201853 and SYS2020091), Suzhou Science and Education Project for Youth scholars (KJXW2018078), Suzhou key technologies of prevention and control of major diseases and infectious diseases (Gwzx201803), and a Project of the Priority Academic Program Development of Jiangsu Higher Education Institutions.
Disclosure
The authors report no conflicts of interest for this work.
References
1. Wang CH, Du LZ, Ma XL, et al. Analysis of in-hospital neonatal death in the tertiary neonatal intensive care unit in China: a multicenter retrospective study. Chin Med J. 2016;129(22):2652–2658. doi:10.4103/0366-6999.193458
2. Fellman V, Hellström-Westas L, Norman M, et al. One-year survival of extremely preterm infants after active perinatal care in Sweden. JAMA. 2009;301(21):2225–2233.
3. Casey BM, McIntire DD, Leveno KJ. The continuing value of the Apgar score for the assessment of newborn infants. N Engl J Med. 2001;344(7):467–471. doi:10.1056/NEJM200102153440701
4. Iliodromiti S, Mackay DF, Smith GC, Pell JP, Nelson SM. Apgar score and the risk of cause-specific infant mortality: a population-based cohort study. Lancet. 2014;384(9956):1749–1755. doi:10.1016/S0140-6736(14)61135-1
5. McCormick MC. The contribution of low birth weight to infant mortality and childhood morbidity. N Engl J Med. 1985;312(2):82–90. doi:10.1056/NEJM198501103120204
6. Vilanova CS, Hirakata VN, de Souza Buriol VC, Nunes M, Goldani MZ, da Silva CH. The relationship between the different low birth weight strata of newborns with infant mortality and the influence of the main health determinants in the extreme south of Brazil. Popul Health Metr. 2019;17(1):15. doi:10.1186/s12963-019-0195-7
7. Platt MJ. Outcomes in preterm infants. Public Health. 2014;128(5):399–403. doi:10.1016/j.puhe.2014.03.010
8. Saigal S, Doyle LW. An overview of mortality and sequelae of preterm birth from infancy to adulthood. Lancet. 2008;371(9608):261–269. doi:10.1016/S0140-6736(08)60136-1
9. de Jong M, Verhoeven M, van Baar AL. School outcome, cognitive functioning, and behaviour problems in moderate and late preterm children and adults: a review. Semin Fetal Neonatal Med. 2012;17(3):163–169. doi:10.1016/j.siny.2012.02.003
10. Yu ZB, Han SP, Zhu GZ, et al. Birth weight and subsequent risk of obesity: a systematic review and meta-analysis. Obesity Rev. 2011;12(7):525–542. doi:10.1111/j.1467-789X.2011.00867.x
11. Jornayvaz FR, Vollenweider P, Bochud M, Mooser V, Waeber G, Marques-Vidal P. Low birth weight leads to obesity, diabetes and increased leptin levels in adults: the CoLaus study. Cardiovasc Diabetol. 2016;15(1):73. doi:10.1186/s12933-016-0389-2
12. Abitbol CL, Chandar J, Rodríguez MM, et al. Obesity and preterm birth: additive risks in the progression of kidney disease in children. Pediatr Nephrol. 2009;24(7):1363–1370. doi:10.1007/s00467-009-1120-2
13. Dong YH, Zou ZY, Yang ZP, et al. Association between high birth weight and hypertension in children and adolescents: a cross-sectional study in China. J Hum Hypertens. 2017;31(11):737–743. doi:10.1038/jhh.2017.22
14. Rashid A, Agarwala A, Novak E, Brown DL. Association of high birth weight with incident heart failure in the ARIC study. J Am Heart Assoc. 2019;8(9):e011524. doi:10.1161/JAHA.118.011524
15. Bavineni M, Wassenaar TM, Agnihotri K, Ussery DW, Lüscher TF, Mehta JL. Mechanisms linking preterm birth to onset of cardiovascular disease later in adulthood. Eur Heart J. 2019;40(14):1107–1112. doi:10.1093/eurheartj/ehz025
16. Lawlor DA, Ronalds G, Clark H, Smith GD, Leon DA. Birth weight is inversely associated with incident coronary heart disease and stroke among individuals born in the 1950s: findings from the Aberdeen children of the 1950s prospective cohort study. Circulation. 2005;112(10):1414–1418. doi:10.1161/CIRCULATIONAHA.104.528356
17. World Health Organization. March of Dimes; The partnership for maternal, newborn & child health; Save the Children: born too soon: the global action report on preterm birth. Available from: https://www.who.int/news/item/02-05-2012-15-million-babies-born-too-soon.
18. Chawanpaiboon S, Vogel JP, Moller AB, et al. Global, regional, and national estimates of levels of preterm birth in 2014: a systematic review and modelling analysis. Lancet Glob Health. 2019;7(1):e37–e46. doi:10.1016/S2214-109X(18)30451-0
19. Cui H, He C, Miao L, et al. Trendency analysis of infant mortality rate due to premature birth or low birth weight in China from 1996 to 2013. Zhonghua yu Fang Yi Xue Za Zhi. 2015;49(2):161–165.
20. Sanghavi M, Rutherford JD. Cardiovascular physiology of pregnancy. Circulation. 2014;130(12):1003–1008. doi:10.1161/CIRCULATIONAHA.114.009029
21. Troiano NH. Physiologic and Hemodynamic Changes During Pregnancy. AACN Adv Crit Care. 2018;29(3):273–283. doi:10.4037/aacnacc2018911
22. Macdonald-Wallis C, Lawlor DA, Fraser A, May M, Nelson SM, Tilling K. Blood pressure change in normotensive, gestational hypertensive, preeclamptic, and essential hypertensive pregnancies. Hypertension. 2012;59(6):1241–1248. doi:10.1161/HYPERTENSIONAHA.111.187039
23. Zhu J, Zhang J, Ng MJ, Chern B, Yeo GS, Tan KH. Angiogenic factors during pregnancy in Asian women with elevated blood pressure in early pregnancy and the risk of preeclampsia: a longitudinal cohort study. BMJ Open. 2019;9(11):e032237. doi:10.1136/bmjopen-2019-032237
24. Zhu B, Huang K, Bao W, et al. Dose-response relationship between maternal blood pressure in pregnancy and risk of adverse birth outcomes: ma’anshan birth cohort study. Pregnancy Hypertens. 2019;15:16–22. doi:10.1016/j.preghy.2018.09.004
25. Akbar MIA, Adibrata MA, Aditiawarman ARA, Angsar MD, Dekker G. Maternal and perinatal outcome related to severity of chronic hypertension in pregnancy. Pregnancy Hypertens. 2019;16:154–160. doi:10.1016/j.preghy.2019.04.007
26. Iwama N, Oba MS, Satoh M, et al. Association of maternal home blood pressure trajectory during pregnancy with infant birth weight: the BOSHI study. Hypertens Res. 2020;43(6):550–559. doi:10.1038/s41440-020-0416-2
27. Bakker R, Steegers EA, Hofman A, Jaddoe VW. Blood pressure in different gestational trimesters, fetal growth, and the risk of adverse birth outcomes: the generation R study. Am J Epidemiol. 2011;174(7):797–806. doi:10.1093/aje/kwr151
28. Guo Q, Feng P, Yu Q, et al. Associations of systolic blood pressure trajectories during pregnancy and risk of adverse perinatal outcomes. Hypertens Res. 2020;43(3):227–234. doi:10.1038/s41440-019-0350-3
29. Mayrink J, Souza RT, Feitosa FE, et al. Mean arterial blood pressure: potential predictive tool for preeclampsia in a cohort of healthy nulliparous pregnant women. BMC Pregnancy Childbirth. 2019;19(1):460. doi:10.1186/s12884-019-2580-4
30. Conde-Agudelo A, Belizán JM, Lede R, Bergel EF. What does an elevated mean arterial pressure in the second half of pregnancy predict–gestational hypertension or preeclampsia? Am J Obstet Gynecol. 1993;169(3):509–514. doi:10.1016/0002-9378(93)90609-M
31. Thadhani R, Ecker JL, Kettyle E, Sandler L, Frigoletto FD. Pulse pressure and risk of preeclampsia: a prospective study. Obstet Gynecol. 2001;97(4):515–520.
32. Tihtonen KM, Kööbi T, Uotila JT. Arterial stiffness in preeclamptic and chronic hypertensive pregnancies. Eur J Obstet Gynecol Reprod Biol. 2006;128(1–2):180–186. doi:10.1016/j.ejogrb.2005.12.026
33. Barfield WD. Standard terminology for fetal, infant, and perinatal deaths. Pediatrics. 2016;137(5):e20160551–e20160551. doi:10.1542/peds.2016-0551
34. Lawn JE, Blencowe H, Waiswa P, et al. Stillbirths: rates, risk factors, and acceleration towards 2030. Lancet. 2016;387(10018):587–603. doi:10.1016/S0140-6736(15)00837-5
35. Dbstet A. WHO: recommended definitions, terminology and format for statistical tables related to the perinatal period and use of a new certificate for cause of perinatal deaths. Modifications recommended by FIGO as amended October 14, 1976. Acta Obstet Gynecol Scand. 1977;56(3):247–253.
36. Hughes MM, Black RE, Katz J. 2500-g low birth weight cutoff: history and implications for future research and policy. Matern Child Health J. 2017;21(2):283–289. doi:10.1007/s10995-016-2131-9
37. Boulet SL, Alexander GR, Salihu HM, Pass M. Macrosomic births in the United States: determinants, outcomes, and proposed grades of risk. Am J Obstet Gynecol. 2003;188(5):1372–1378. doi:10.1067/mob.2003.302
38. Leffondré K, Abrahamowicz M, Regeasse A, et al. Statistical measures were proposed for identifying longitudinal patterns of change in quantitative health indicators. J Clin Epidemiol. 2004;57(10):1049–1062. doi:10.1016/j.jclinepi.2004.02.012
39. Malika Charrad NG, Boiteau V, Niknafs A. NbClust: an R package for determining the relevant number of clusters in a data set. J Stat Softw. 2014;61(issue):i06.
40. Wikström AK, Gunnarsdottir J, Nelander M, Simic M, Stephansson O, Cnattingius S. Prehypertension in pregnancy and risks of small for gestational age infant and stillbirth. Hypertension. 2016;67(3):640–646.
41. Molvi SN, Mir S, Rana VS, Jabeen F, Malik AR. Role of antihypertensive therapy in mild to moderate pregnancy-induced hypertension: a prospective randomized study comparing labetalol with alpha methyldopa. Arch Gynecol Obstet. 2012;285(6):1553–1562. doi:10.1007/s00404-011-2205-2
42. Rang S, van Montfrans GA, Wolf H. Serial hemodynamic measurement in normal pregnancy, preeclampsia, and intrauterine growth restriction. Am J Obstet Gynecol. 2008;198(5):
43. Zur RL, Kingdom JC, Parks WT, Hobson SR. The placental basis of fetal growth restriction. Obstet Gynecol Clin North Am. 2020;47(1):81–98. doi:10.1016/j.ogc.2019.10.008
44. Delforce SJ, Lumbers ER, Ellery SJ, Murthi P, Pringle KG. Dysregulation of the placental renin-angiotensin system in human fetal growth restriction. Reproduction. 2019;158(3):237–245. doi:10.1530/REP-18-0633
45. Vidaeff A, Espinoza J, Simhan H, Pettker CM. ACOG Practice Bulletin No. 203: chronic hypertension in pregnancy. Obstet Gynecol. 2019;133(1):e26–e50. doi:10.1097/AOG.0000000000003020
46. Regitz-Zagrosek V, Roos-Hesselink JW, Bauersachs J, et al. 2018 ESC Guidelines for the management of cardiovascular diseases during pregnancy. Kardiol Pol. 2019;77(3):245–326. doi:10.5603/KP.2019.0049
47. Bahadoran P, Pouya F, Zolaktaf V, Taebi M. The effect of stretching exercise and walking on changes of blood pressure in nulliparous women. Iran J Nurs Midwifery Res. 2015;20(2):205–210.
48. Bjelica A. Pregnancy as a stressful life event and strategies for coping with stress in women with pregnancy-induced hypertension. Med Pregl. 2004;57(7–8):363–368. doi:10.2298/MPNS0408363B
49. Aalami M, Jafarnejad F, ModarresGharavi M. The effects of progressive muscular relaxation and breathing control technique on blood pressure during pregnancy. Iran J Nurs Midwifery Res. 2016;21(3):331–336. doi:10.4103/1735-9066.180382
50. Bouthoorn SH, Gaillard R, Steegers EA, et al. Ethnic differences in blood pressure and hypertensive complications during pregnancy: the Generation R study. Hypertension. 2012;60(1):198–205. doi:10.1161/HYPERTENSIONAHA.112.194365
 © 2021 The Author(s). This work is published and licensed by Dove Medical Press Limited. The full terms of this license are available at https://www.dovepress.com/terms.php and incorporate the Creative Commons Attribution - Non Commercial (unported, v3.0) License.
By accessing the work you hereby accept the Terms. Non-commercial uses of the work are permitted without any further permission from Dove Medical Press Limited, provided the work is properly attributed. For permission for commercial use of this work, please see paragraphs 4.2 and 5 of our Terms.
© 2021 The Author(s). This work is published and licensed by Dove Medical Press Limited. The full terms of this license are available at https://www.dovepress.com/terms.php and incorporate the Creative Commons Attribution - Non Commercial (unported, v3.0) License.
By accessing the work you hereby accept the Terms. Non-commercial uses of the work are permitted without any further permission from Dove Medical Press Limited, provided the work is properly attributed. For permission for commercial use of this work, please see paragraphs 4.2 and 5 of our Terms.