
Back to Journals » International Journal of Women's Health » Volume 17
Associations between the Chinese Visceral Adiposity Index and the Self-Reported Menopausal Status: Results from Two Nationally Representative Population-Based Studies
Authors Dong C, Ma D, Gu K, Lin Y, Song J, Wang Y, Yu J, Zhou Y
Received 25 December 2024
Accepted for publication 7 May 2025
Published 19 May 2025 Volume 2025:17 Pages 1421—1436
DOI https://doi.org/10.2147/IJWH.S514304
Checked for plagiarism Yes
Review by Single anonymous peer review
Peer reviewer comments 2
Editor who approved publication: Dr Matteo Frigerio
Chunlin Dong,1,2,* Ding Ma,1– 3,* Ke Gu,4,* Yaying Lin,1 Jing Song,1 Yuan Wang,1 Jinjin Yu,1 Yanjun Zhou4
1Department of Obstetrics and Gynecology, Affiliated Hospital of Jiangnan University, Wuxi, People’s Republic of China; 2Wuxi Medical College, Jiangnan University, Wuxi, People’s Republic of China; 3Key Laboratory of the Ministry of Education, Cancer Biology Research Center, Tongji Hospital, Tongji Medical College, Huazhong University of Science and Technology, Wuhan, People’s Republic of China; 4Department of Radiation Oncology, Affiliated Hospital of Jiangnan University, Wuxi, People’s Republic of China
*These authors contributed equally to this work
Correspondence: Yanjun Zhou, Department of Radiation Oncology, Affiliated Hospital of Jiangnan University, Wuxi, 214000, People’s Republic of China, Email [email protected] Jinjin Yu, Department of Obstetrics and Gynecology, Affiliated Hospital of Jiangnan University, Wuxi, 214000, People’s Republic of China, Email [email protected]
Purpose: The menopausal transition is accompanied by metabolic changes in women. This study explores the Chinese visceral adiposity index (CVAI) as a potential indicator of menopausal status to aid in disease prevention.
Patients and Methods: A cohort of 404 premenopausal Chinese women aged 45 years and above, from the China Health and Retirement Longitudinal Study (CHARLS), was included. CVAI was calculated from the 2011 survey data, menopausal status was collected in the 2018 survey, representing a 7-year longitudinal follow-up. The cross-sectional study cohort from the National Health and Nutrition Examination Survey (NHANES) included 3577 women aged 40– 60 with CVAI and self-reported menopausal status from 2003 to 2020. Logistic regression models were estimated the odds ratio (OR) of the menopause data and 95% confidence intervals (CIs).
Results: In the CHARLS cohort, the adjusted OR for menopause in the fourth quartile of CVAI compared to the first quartile was 5.23 (95% CI: 1.59, 17.17; P for trend: 0.005). Additionally, a significant difference in the association between menopausal status and CVAI was found between rural and urban populations (P for interaction = 0.029). Moreover, in the NHANES cohort, the CVAI and the menopausal status were associated after adjustment (OR: 1.02, 95% CI: 1.002, 1.037, P: 0.029). In the stratified analysis, the association of CVAI with the status of menopause was observed among other ethnicities which including Asians (OR: 1.092, 95% CI: 1.012, 1.178, P: 0.025). Finally, a nomogram was developed to facilitate the clinical assessment of menopause based on the CVAI.
Conclusion: The CVAI demonstrated a significant association with the odds of menopausal status in both Chinese and the US populations, suggesting its potential as a correlative marker for menopausal status, but the associational strength may vary by population.
Keywords: change of life, visceral adiposity, abdominal obesity, central obesity, menopausal transition, fat distribution
Introduction
Women undergo natural menopause from the ages of 45 to 55 as a consequence of reduced ovarian follicle function, whereas surgical menopause is similarly characterized by a reduction in estradiol (E2) levels.1 With a decrease in E2 levels, perimenopausal women experience a series of metabolic changes, including alterations in the quantity and distribution of adipose tissue (AT).2 Women in perimenopause experience a shift in body shape from a gynecoid to an android shape, accompanied by an elevated accumulation of visceral adipose tissue (VAT) and abdominal AT during the menopausal transition.3–5 The incidence of cardiovascular and metabolic diseases increases among women after menopause and is coupled with obesity.6
There is currently no consensus on whether and how obesity affects menopause. The majority of epidemiological investigations have concentrated on the correlation between obesity and the age at which menopause occurs, yielding inconsistent findings. According to findings, obesity was associated with a lower age of menopause,7 in contrast, obesity exhibited a link with a later age at menopause onset.8 Premenopausal obese females exhibit reduced levels of E2 than their nonobese counterparts do, whereas postmenopausal obese females display elevated levels of E2 relative to nonobese females.9 Compared with premenopausal nonobese women, premenopausal women with obesity presented decreased levels of anti-Müllerian hormone, indicating a reduced ovarian reserve.10 Most of the aforementioned studies utilized body mass index (BMI) to assess obesity, but this index does not account for the effects of AT distribution during the menopausal transition. This limitation might explain the inconsistent influence of obesity, which is primarily evaluated through BMI, on the onset of menopause.
Excessive AT in different body regions serves distinct physiological functions and has different impacts on health.11 However, compared with subcutaneous AT, excessive visceral adiposity demonstrates a heightened vulnerability to developing DM and future cardiovascular events.12 Magnetic resonance imaging (MRI) or computed tomography (CT) is acknowledged as the most reliable and accurate method for quantitatively assessing VAT. Owing to the high cost and time-consuming nature of imaging examinations, the visceral adiposity index (VAI), which is used to assess visceral adipose deposition based on age, BMI, waist circumference (WC), and the concentrations of triglyceride (TG) and high-density lipoprotein (HDL) in Caucasian populations, has been developed and was demonstrated to be a feasible and reliable visceral adiposity assessment method.13 Furthermore, the Chinese visceral adiposity index (CVAI), constructed based on differences in body AT distribution between Asians and Caucasian individuals, has been reported to have greater accuracy than BMI and WC in predicting metabolic syndrome, hypertension, DM, and cardiovascular disease (CVD).14,15 Accordingly, the primary aim of this exploration was to establish the association between self-reported menopausal status and the utilization of the CVAI for the first time.
The proposed hypothesis is that the CVAI is associated with the menopause. To achieve the aforementioned objectives, the data derived from the China Health and Retirement Longitudinal Study (CHARLS) were utilized. The CVAI of premenopausal women in 2011 was calculated, and their menstrual information from 2018 was collected. Moreover, the cross-sectional data from NHANES was utilized to examine the association between CVAI and menopause among women aged 40–60 from 2003 to 2020. The relationship of CVAI with the odds of menopause was subsequently examined via logistic regression. Finally, a clinically applicable nomogram was developed based on of the CVAI to calculate the odds of menopausal status.
Materials and Methods
Study Subjects
The CHARLS is a broad-based survey that provides representative data at the national level over time. Its primary objective is to examine the relationships among socioeconomic factors, health-related behaviors, and health outcomes amidst the rapid demographic shift toward an aging population in China.16 The initial wave of the CHARLS was conducted during the 2011–2012 period, followed by three subsequent waves conducted at approximately two-year intervals.16 The Peking University Biomedical Ethics Committee granted authorization for the implementation of the CHARLS survey (IRB00001052-11015). Prior to their participation, all individuals were required to sign a written consent form after receiving detailed information.16
First, a total of 11,847 individuals who had blood examination reports in the first wave (2011) were included. Among these participants, 9612 individuals provided follow-up information during the third wave (2018). A total of 214 participants who were younger than 45 years old and 8798 participants who were postmenopausal or had unclear menopausal status at the time of the first wave (2011) were subsequently excluded. In addition, 196 participants were excluded because of incomplete data for calculating the CVAI. Finally, a total of 404 participants met the criteria (Figure 1A).
 |
Figure 1 The standards for subject eligibility. The standards for subject eligibility presented in CHARLS (A) and in NHANES (B). |
NHANES is a nationally representative cross-sectional survey to examine the health and nutritional status of the population in the United States. The approval numbers from the Ethics Review Board (ERB) of the National Center for Health Statistics for each survey cycle can be found at https://www.cdc.gov/nchs/nhanes/irba98.htm. Written consent is obtained from each participant prior to their informed participation in the study.
A total of 29,800 documented menstrual records were included in the study from the years 2003 to 2020 in NHANES. Participants who were excluded from the study were those without information on BMI (n = 375) and WC (n = 807), as well as individuals with missing data on fasting triglyceride and HDL levels (n = 15,674). Additionally, participants outside the age range of 40–60 years were also excluded from the analysis (n = 9222). Participants with a weight value of “wtsaf2yr.lipid” equal to 0 (n = 145) were excluded from the weighted analysis. Therefore, a cohort of 3577 women aged 40–60 years with the available information on CVAI and menopause from 2003 to 2020 in NHANES were employed in the analysis (Figure 1B).
This study was approved by the Ethics Committee of Jiangnan University Affiliated Hospital, with the ethical review number LS2022081.
Data Collection
In the CHARLS, after completing the household interviews and providing body measurements and assessments of physical ability, the collection of fasting blood samples, involving 8 mL of blood, was performed by experienced nurses for all study participants. Within 60–120 minutes following blood sample collection, comprehensive blood count (CBC) tests were conducted. During transportation, one whole blood sample was kept at 4 °C for later glycated hemoglobin A1c (HbA1c) analysis, while the remaining specimen was processed at the time of CBC testing. Separation of plasma and red blood cells was achieved by centrifuging the blood sample. Both components were frozen at −80 °C to ensure their stability during transport. Transportation of every single blood specimen to Beijing was followed by their storage at −208 °C at the China Centre for Disease Prevention and Control for subsequent analysis.16
In the NHANES, briefly, demographic and lifestyle information was collected through the administration of questionnaires conducted in the participants’ homes. Then, Blood samples, physical examinations, and other assessments were conducted in the mobile examination center vehicle. Biochemical markers including uric acid, LDL, TC, TG, HDL, and glucose were measured using a Hitachi 704 Analyzer (Roche/Boehringer Mannheim Corporation, Indianapolis, USA). Estradiol concentrations were assessed using isotope dilution high-performance liquid chromatography coupled with tandem mass spectrometry, and data for this analysis were limited to the period from 2013 to 2016.
Menopause Assessment
Menopause is characterized by the cessation of menstrual periods for a continuous 12-month duration following the final menstrual cycle, except in cases of pregnancy. In the CHARLS, in the first wave (2011), menstrual status was reported as “yes”. In the third wave of follow-up (2018), the menstrual status was explicitly reported. In the NHANES, the menstrual status was determined through the following question in the survey questionnaire: “Have you/had at least one menstrual period in the past 12 months? (Please exclude bleedings caused by medical conditions, hormone therapy, or surgeries).”
CVAI Calculation
The CVAI was calculated according to the original study:15

Covariates
In the CHARLS, the covariates included age, place of residence (rural, urban), region of residence (South, North), marital status (married, single), education levels (college and higher, high school, and elementary school and below), household income (<10,000 yuan/year, 10,000–50,000 yuan/year), smoking status (nonsmoker/former smoker, smoker), alcoholic beverage intake (drink but less than once a month, drink more than once a month, none), history of disease, including DM, CVD, hypertension, and dyslipidemia, and lipid-lowering medications.
The laboratory results included low-density lipoprotein (LDL, mg/dL or mmol/L), TG (mg/dL or mmol/L), HDL (mg/dL or mmol/L), total cholesterol (TC, mg/dL or mmol/L), glucose (mg/dL or mmol/L), creatinine (mg/dL or mmol/L), white blood cell count (WBC, thousands), hemoglobin (g/dL), hematocrit (percent), mean corpuscular volume (MCV, fl), platelet (PLT, x109/L), C-reactive protein (CRP, mg/L), HbA1c, creatinine (mg/dL), cystatin C (mg/L), blood urea nitrogen (BUN mg/dL), uric acid (mg/dL), residual cholesterol (RC = TC- HDL-LDL, mg/dL or mmol/L), and nonHDL (nonHDL = TC-HDL, mg/dL or mmol/L) levels. To determine the BMI, the weight (measured in kilograms) of an individual was divided by the square of their height (measured in meters). Obesity was categorized based on BMI grading as follows: underweight (BMI < 18.5), normal weight (BMI 18.5–24.9), overweight (BMI 25–29.9), and obesity (BMI ≥ 30).
In the NHANES, the covariates included age, ethnicity, educational attainment, partnership, poverty income ratio (PIR), tobacco consumption, and alcohol intake. The identification of hyperlipidemia included elevated levels of TG ≥ 150 mg/dL, elevated levels of total cholesterol (TC) ≥ 200 mg/dL, low-density lipoprotein (LDL) ≥ 130 mg/dL, low levels of high-density lipoprotein (HDL) < 40 mg/dL, or the use of anti-hyperlipidemic drugs. CVD was recognized as a medical condition in which individuals had a history of heart attack or stroke. Participants were determined to have Type 2 DM based on the presence of any of the following criteria: clinical diagnosis of DM, HbA1c level ≥ 6.5%, fasting blood sugar level ≥ 7.0 mmol/L, random blood glucose level ≥ 11.1 mmol/L, oral glucose tolerance test result ≥ 11.1 mmol/L, or the use of antihyperglycemic agents. Diagnosis of hypertension was determined based on participants meeting one or more of the following criteria: a known history of hypertension, prescribed antihypertensive medication, or having a systolic blood pressure ≥ 140mmHg or diastolic blood pressure ≥ 90mmHg.
Statistical Analysis
R software (version 4.4.1, R Foundation, Vienna, Austria) was employed for conducting statistical analyses. The presentation of continuous variables is in the form of the means ± standard deviations, and group differences were assessed via one-way ANOVA. Categorical variables are reported in terms of counts and percentages. The chi-square test was utilized to evaluate the variances in categorical variables across groups. The odds ratio (OR) and its corresponding 95% confidence intervals (CIs) were estimated via logistic regression analysis. P < 0.05 was interpreted statistically significant.
In the CHARLS, the relationship between the CVAI and the occurrence of menopause was analyzed via four logistic regression models. The crude model was applied without any adjustments. Model 1 was adjusted for age, level of education, tobacco use habit, alcohol intake behavior, marital status, BMI, hypertension status, DM status, CVD status, and dyslipidemia status. In Model 2, confounding factors were incorporated for the adjustment of lipid-related indicators, including LDL (mg/dL), TG (mg/dL), HDL (mg/dL), and TC (mg/dL). Building upon Model 2, Model 3 was adjusted for glucose (mg/dL), creatinine (mg/dL), and uric acid (mg/dL). In the stratified logistic analysis, the effects of the CVAI on the incidence of menopause were stratified by education level, drinking status, marital status, BMI, hypertension status, DM status, CVD status, and dyslipidemia status. The nomogram was constructed via the R package “regplot” for visualization.
In the NHANES, to perform a weighted logistic regression analysis in the NHANES dataset, the “survey” package in R was used. The weight value “wtsaf2yr.lipid” was used as a weight according to the instructions. The crude model was adjusted for CVAI. Model 1 was adjusted for CVAI, age, race, PIR, education attainment, partnership status, BMI, tobacco consumption, alcohol intake, hypertension, CVD, DM, and hyperlipidemia. Model 2 was built upon Model 1 by further incorporating adjustments for fasting blood test results such as LDL, fast total cholesterol, fast triglyceride, and HDL. Model 3 was built upon Model 2 by further adjustments for fast glucose, creatinine, uric acid, and blood urea nitrogen. In the stratified logistic analysis, the impacts of stratification factors on the association between CVAI and menopause were evaluated. The stratification factors included age, race, education attainment, partnership, smoking, alcohol intake, PIR, obesity, hypertension, CVD, DM, and hyperlipidemia. After filtering out E2 values exceeding 1000 pg/mL to ensure the integrity of the analysis, the relationship between E2 and CVAI was evaluated using linear regression. The survey and mediation packages in R were employed to conduct a comprehensive mediation analysis, highlighting the intricate relationships between E2, CVAI, and menopausal status. The average causal mediation effect (ACME), average direct effect (ADE), and total effect were used to elucidate the relationships between variables.
Results
Characteristics of the Participants in the CHARLS Cohort
A cohort of 404 female subjects (aged 45 years or above) from the CHARLS cohort was integrated into this study. The baseline characteristics of the participants are presented according to their menstrual status, as shown in Table 1. Approximately 7 years after the first wave, 262 individuals had postmenopausal status, whereas 142 individuals had premenopausal status. The mean age of premenopausal women at the time of the 2011 survey wave was 47.27 years, whereas the mean age among postmenopausal women was 47.97 years (Table 1, P = 0.04). Except for the notable age differences observed in the postmenopausal and premenopausal subpopulations, no significant disparities were detected in other baseline features (Table 1). Furthermore, the baseline data were compared according to the CVAI quartiles (Supplementary Table 1). Participants with a CVAI in the upper quartile were found to have the highest mean age (48.75 years, P < 0.01), highest WBC (6.73 thousand cells), highest glucose (111.4 mg/dL), HbA1c (5.33), uric acid (3.96 mg/dL), lowest HDL (43.89 mg/dL), highest TG (167.63 mg/dL), highest RC (34.78 mg/dL), highest nonHDL (147.95 mg/dL), highest BMI (29.72 kg/m²), and highest waist circumference (96.58 cm) (P < 0.05, Supplementary Table 1). Notably, the CVAI Q4 stratum exclusively comprised overweight or obese participants (BMI ≥25 kg/m2) (Supplementary Table 1). This finding suggests that individuals with high VAT levels are predominantly overweight or obese.
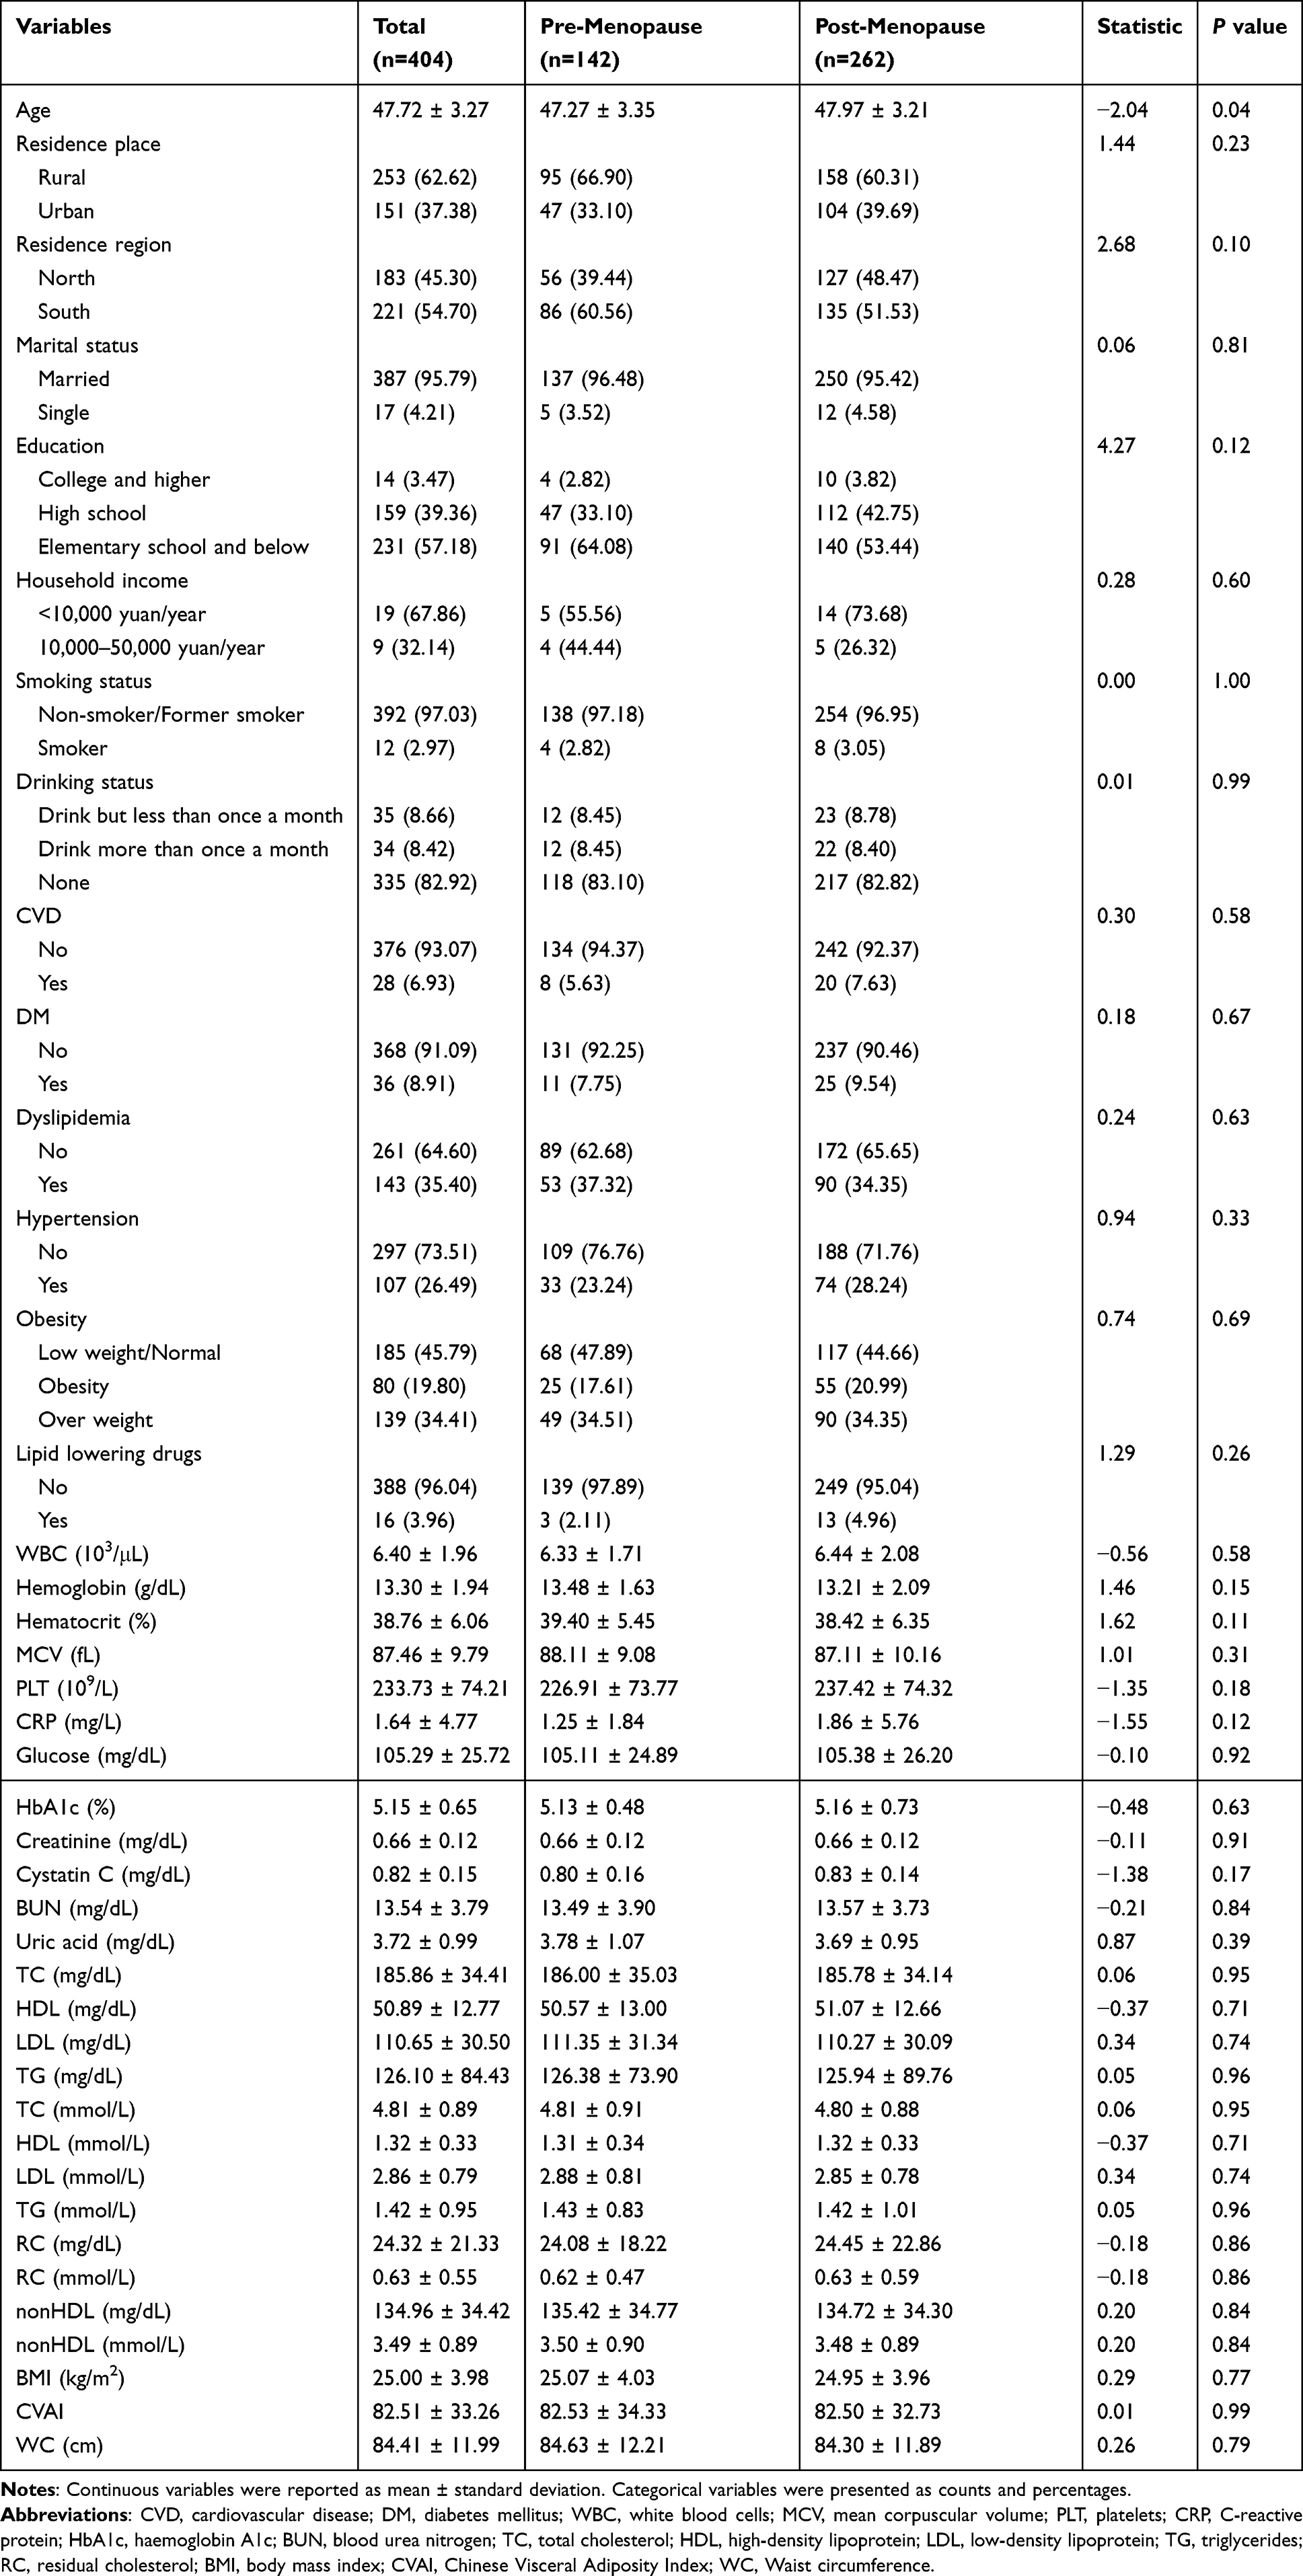 |
Table 1 Baseline Characteristics of Participants According to Menstrual Status (2018) in CHARLS |
Associations between the CVAI and the Self-Reported Menopausal Status in the CHARLS Cohort
To further analyze the potential relationship of the CVAI with the self-reported menopausal status, four logistic regression models were built (Table 2). After full adjustment in Model 3, when the fourth quartile (Q4) was compared with the first quartile of the CVAI (Q1), the adjusted OR for menopause was 5.23 (95% CI: 1.59, 17.17; P for trend: 0.005; Table 2). As quartiles of the CVAI increased, it was observed that a corresponding elevation in the ORs for the correlation between the CVAI and the self-reported menopausal status, as shown in Supplementary Figure 1.
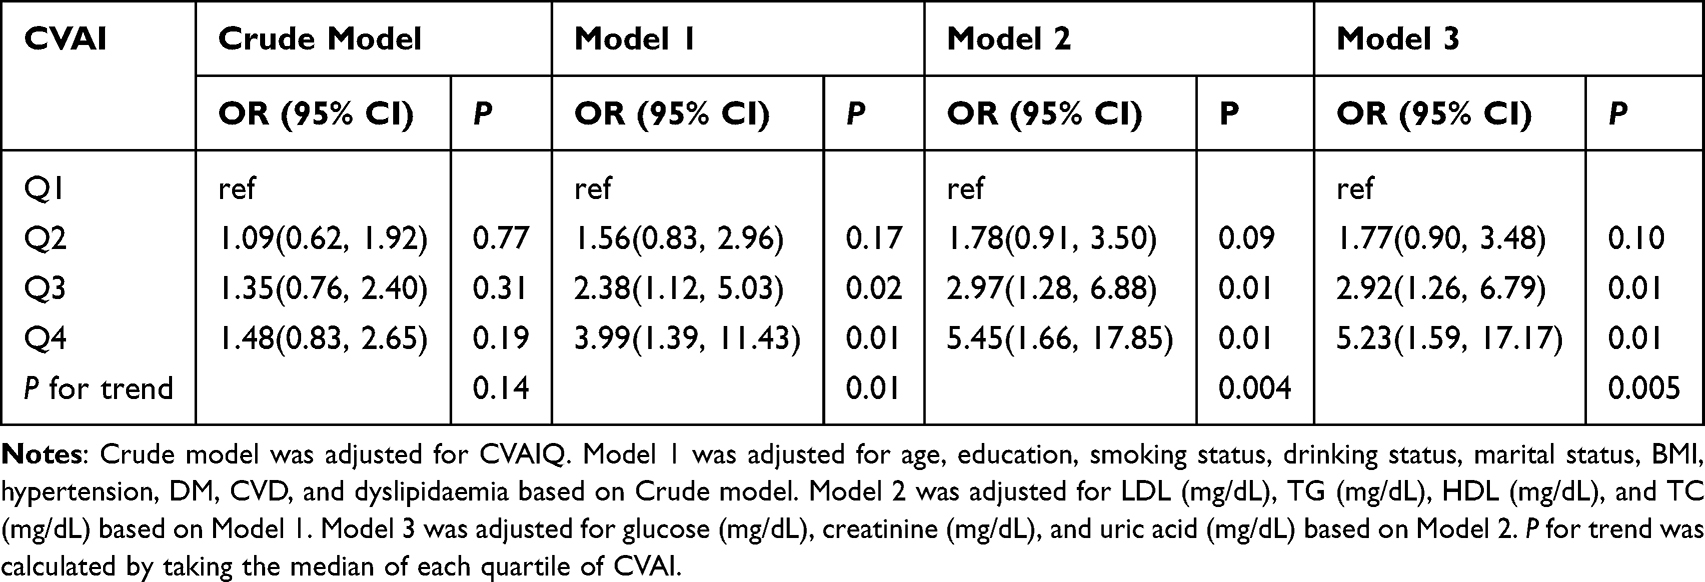 |
Table 2 Odds Ratios and 95% Confidence Intervals of the Status of Menopause by Quartiles of CVAI in CHARLS |
Stratified Analysis in the CHARLS Cohort
The heterogeneity of the associations between the menopausal status and the CVAI among subgroups was further investigated. The ORs of menopause status were calculated for the Q4 compared to the Q1 of CVAI in different subgroups using Model 3 (Figure 2). The association of the CVAI with the menopausal status varied across different places of residence (P for interaction = 0.029) (Figure 2). The status of menopause was significantly greater in participants living in urban areas compared to those in Q4 to Q1 of the CVAI (OR 3.590, 95% CI: 1.328, 10.581; P = 0.015; Figure 2). However, this effect was not observed in participants living in rural areas (P = 0.796). In addition, as participants in CVAI Q4 did not exhibit underweight or normal weight, stratified analysis based on obesity classification could not be performed (Supplementary Table 1).
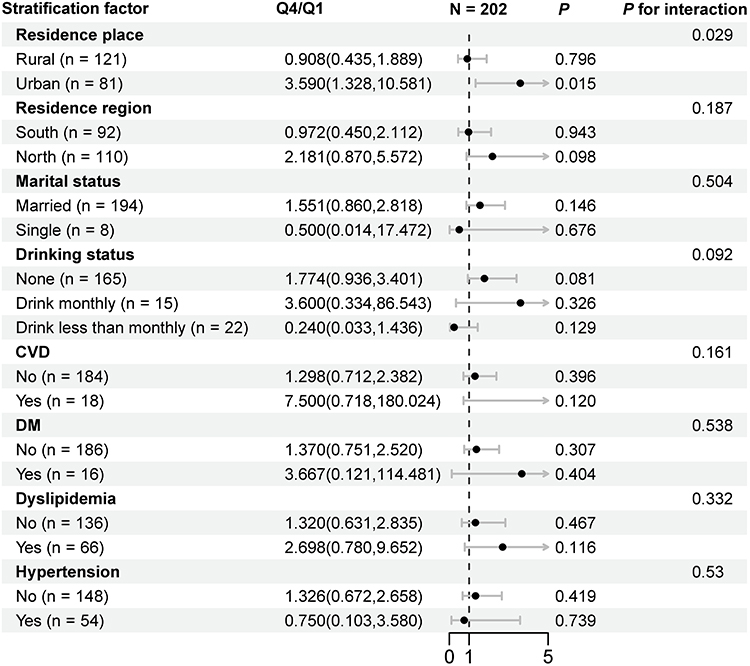 |
Figure 2 The odds ratios of menopause status for the highest versus lowest quartile (Q4/Q1) of CVAI in subgroup logistic regression (Model 3). Abbreviations: DM, Diabetes Mellitus; CVD, Cardiovascular Disease. |
Sensitivity Analysis in the CHARLS Cohort
To validate the stability of the models described above, 36 participants with DM at baseline (8.91%) were excluded, and four logistic regression models were constructed. As demonstrated in Table 3, after controlling for all relevant variables in Model 3, when comparing Q4 of the CVAI with Q1, the adjusted OR for menopausal status, was 5.45 (95% CI: 1.57, 18.88; P for trend: 0.01). There was a significant association of CVAI with the self-reported menopausal status that remained consistent. Moreover, the association of CVAI with self-reported menopausal status remained after the exclusion of 28 participants with CVD at baseline (Supplementary Table 2, OR: 5.38, 95% CI: 1.64, 17.62; P for trend: 0.004). This association was also observed after 107 participants with hypertension at baseline were excluded (Supplementary Table 3, OR: 5.4, 95% CI: 1.66, 17.59; P for trend: 0.004).
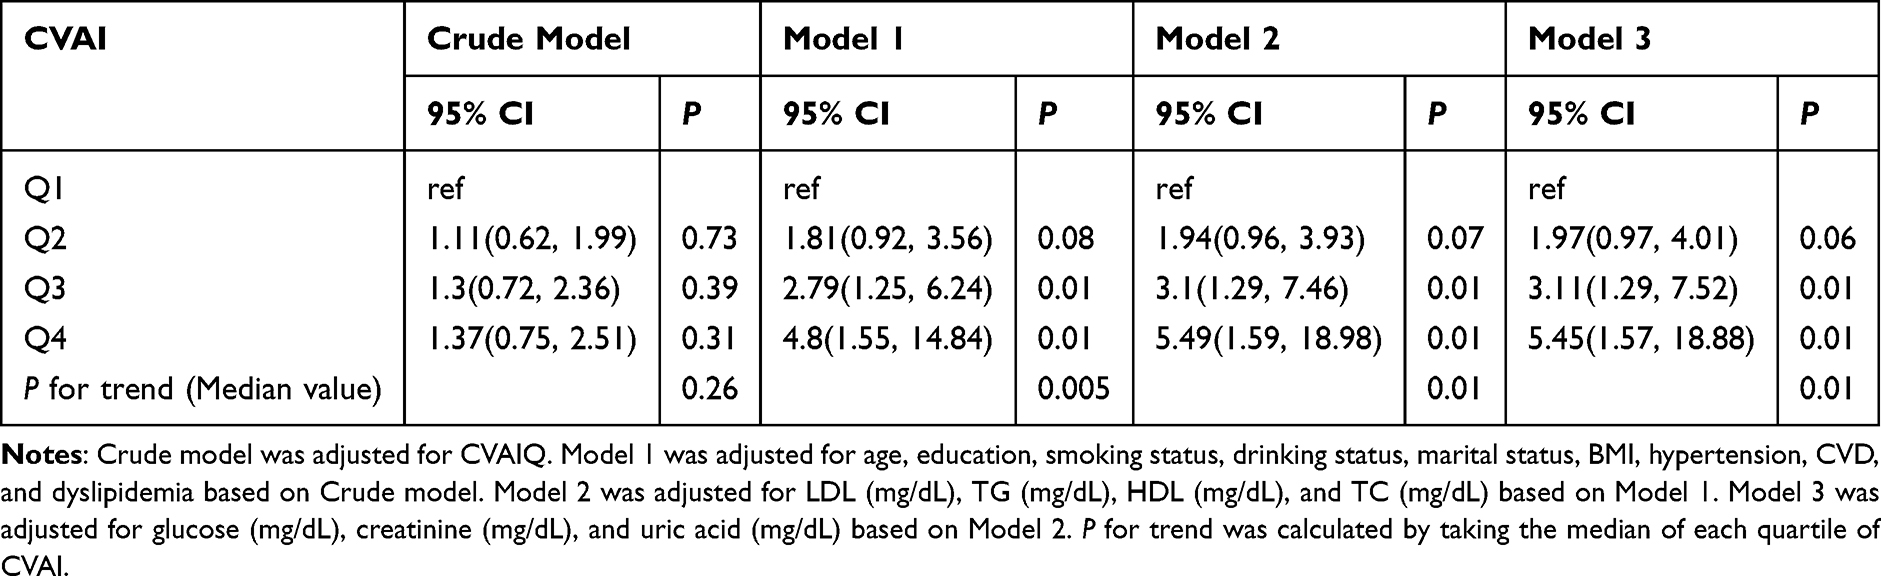 |
Table 3 Odds Ratios and 95% Confidence Intervals of the Status of Menopause by Quartiles of CVAI with Exclusion of Participants with DM in CHARLS |
Nomogram Based on the CHARLS Cohort
To enhance the clinical applicability of this model and visualize the effects of different covariates on the outcome, a nomogram was developed (Figure 3). To further evaluate the effectiveness of this nomogram, the C-index was calculated. A C-index of 0.648 indicating that the nomogram demonstrated a moderate level of discriminatory ability.
 |
Figure 3 Nomogram for Classifying Menopausal Status Based on Clinical and Biochemical Factors. The classification model for determining menopausal status utilizing clinical and biochemical variables, including the CVAIQ, age, education level, smoking status, alcohol consumption, marital status, BMI, hypertension, DM, CVD, dyslipidemia, LDL (mg/dL), TG (mg/dL), HDL (mg/dL), TC (mg/dL), glucose (mg/dL), creatinine (mg/dL), and uric acid (mg/dL). Significant factors are marked with “*”, indicating a p-value < 0.05, and “**”, indicating a p-value < 0.01. Abbreviations: CVAIQ, Quartiles of the Chinese Visceral Adiposity Index; BMI, Body Mass Index; DM, Diabetes Mellitus; CVD, Cardiovascular Disease; LDL, Low-Density Lipoprotein; TG, Triglycerides; HDL, High-Density Lipoprotein; TC, Total Cholesterol. |
Associations between the CVAI and the Status of Menopause in the NHANES Cohort
The association of CVAI with menopause was further examined in the NHANES database. Since NHANES is a cross-sectional survey, a cohort of 3577 women between the ages of 40 and 60 with available menstrual information from 2003 to 2020 was obtained. The baseline characteristics of these participants were compared according to their menstrual status (Supplementary Table 4). Postmenopausal women had higher levels of CVAI, age, WC, LDL, fast total cholesterol, fast triglyceride, fast glucose, uric acid, and blood urea nitrogen compared to premenopausal women (P <0.05, Supplementary Table 4). Postmenopausal women exhibited higher proportions of being without a partner, and having hyperlipidemia, CVD, DM, as well as hypertension compared to premenopausal women (P < 0.05, Supplementary Table 4). Additionally, the postmenopausal group demonstrated differences in racial composition and educational attainment compared to the premenopausal group (P < 0.05, Supplementary Table 4). Furthermore, the association between CVAI and menopausal status was observed in logistic regression analysis after adjusting for potential confounding factors in Model 3 (OR: 1.02, 95% CI: 1.002, 1.037, P = 0.029; Table 4). The stratified analyses revealed significant heterogeneity in the association between CVAI and menopausal status across various demographic and clinical subgroups in the NHANES dataset from 2003 to 2020 (Table 5). A significant association was observed exclusively in women aged 40–44 years (OR=1.036, 95% CI: 1.002–1.072, P = 0.041), with no significant effects in older age groups (all p>0.05). Regarding race/ethnicity, only the “Other Ethnicities” category showed a significant association with an OR of 1.092 (95% CI: 1.012–1.178; P = 0.025). In terms of educational attainment, those with more than 12 years of education showed an association (OR: 1.029; P = 0.011), while other educational categories did not reach statistical significance. Current alcohol consumer exhibited a significant OR of 1.024 (P = 0.026). The individuals with a PIR greater than 3.5 had an OR of 1.028 (P = 0.049). The subgroup analyses indicated significant associations for those with hypertension (OR: 1.030; P = 0.028) and those without CVD (OR: 1.019; P = 0.032). Notably, hyperlipidemia was identified as a significant interaction factor, with P for interaction < 0.01 indicating a significant difference in the association of CVAI with menopause dependent on hyperlipidemia status.
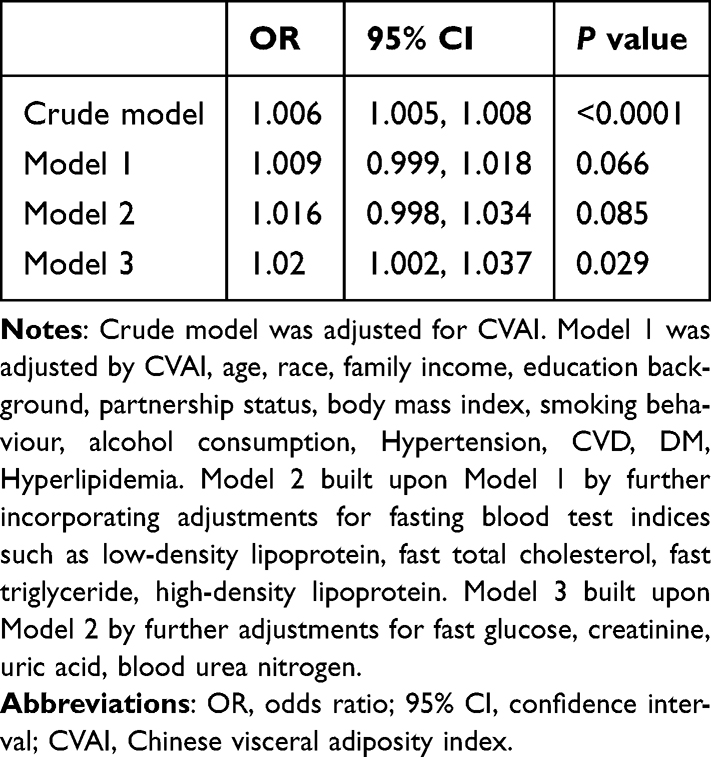 |
Table 4 The Association between CVAI and Menopause in the NHANES (2003–2020) |
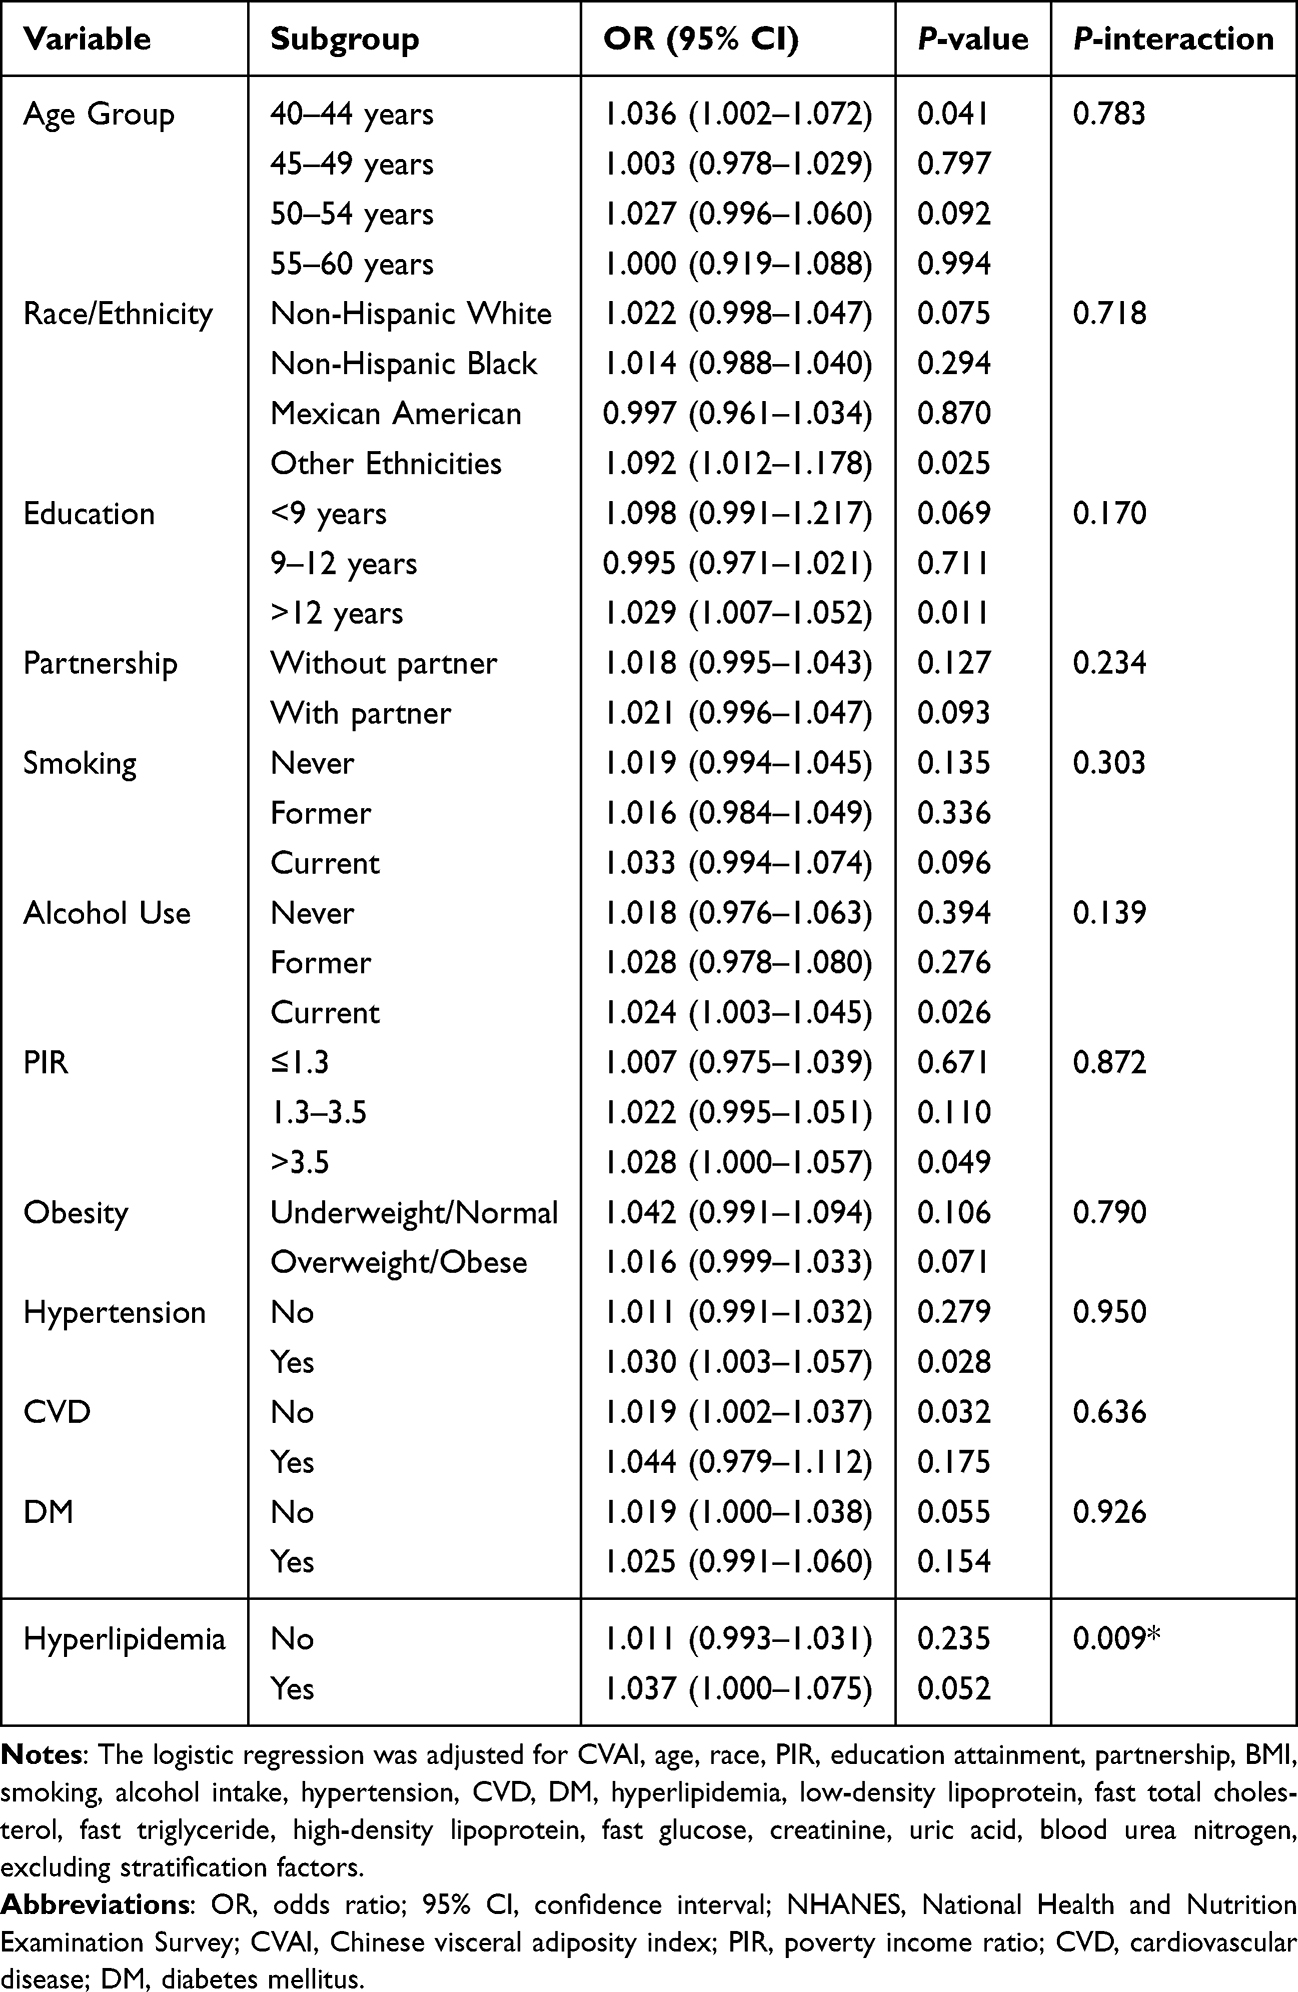 |
Table 5 Stratified Association between CVAI and Menopause in the NHANES (2003–2020) |
Mediation Analysis
Using linear regression, a negative correlation was found between E2 and CVAI (P < 0.001, R² = 0.025; Supplementary Figure 2). Therefore, E2 was further analyzed to determine its effect on the association between CVAI and menopause (Table 6). First, the potential mediating role of E2 in the CVAI-menopause association was examined. The ADE and total effect were found to be marginally significant (P = 0.056 and P = 0.064, respectively). The association between CVAI and menopause demonstrated borderline significance during the 2013–2016 observation period, which may be attributable to reduced sample size in this interval. The non-significant ACME) (P = 0.964) excluded E2 as a mediator in the CVAI-menopause association (Table 6). Subsequently, the influence of menopausal status on CVAI through E2 was examined. Non-significant mediation was observed (ACME P = 0.41), with similarly non-significant direct (ADE P =0.32) and total effects (P = 0.43). Finally, the E2-CVAI-menopause pathway was evaluated. While significant direct (ADE P < 0.05) and total effects (P < 0.05) of E2 on menopausal status were confirmed, the absence of a mediation effect (ACME P = 0.99) ruled out CVAI as a mediating factor.
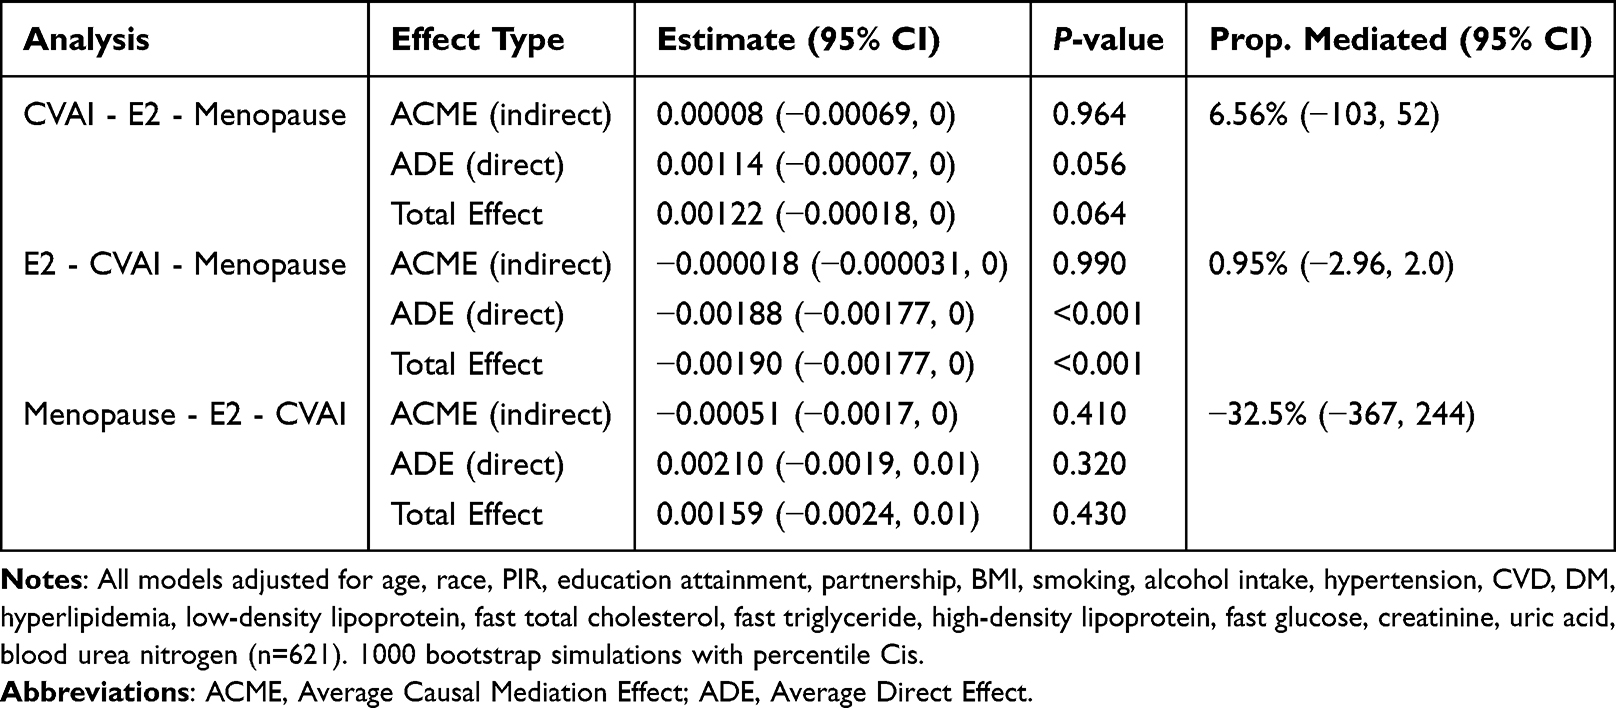 |
Table 6 Causal Mediation Analyses of E2-CVAI-Menopause |
Discussion
Postmenopausal women have approximately one-third of their anticipated lifespan remaining. The quality of life and health status in this phase are paramount for women. Hence, it is important to monitor the CVAI during the menopause transition, assessing menopausal probability, and provide interventions for high-probability individuals through screening, which is critically important.
The findings of this study unveiled a positive association of CVAI with the odds of menopause in Chinese women aged 45 years and older, thereby indicating the potential applicability of CVAI as an indicator of self-reported menopausal status. In women aged 40 to 60 in the US, the CVAI was also significantly associated with the self-reported menopausal status, particularly among other ethnic groups including Asian women. Menopause is clinically diagnosed in women aged 40 years or above who have not experienced menstruation for a period of 12 consecutive months following their last menstrual cycle, excluding pregnancy.3 The results from the Study of Women’s Health Across the Nation (SWAN) revealed a noticeable rise in fat mass accompanied by a concurrent decrease in lean mass during the perimenopausal period.2 Hence, the concurrent alterations in fat and lean mass in the perimenopausal period do not result in a detectable elevation in traditional metrics for assessing obesity, such as weight and BMI.2 Furthermore, the results from SWAN indicate an accelerated accumulation of VAT in the perimenopausal period.17 The shifts in body composition throughout the menopausal transition contribute to the diminished ability of BMI to accurately indicate adiposity and specific regional fat distribution.18,19 Additionally, traditional measurements of visceral adiposity, such as WC or hip circumference, exhibit relatively lower sensitivity to changes in fat distribution during menopausal transition.17 Therefore, the CVAI, representing central visceral adiposity may be more closely associated with the odds of menopause than traditional anthropometric assessment indices.
In mediation analysis, all ACME (indirect effect) P > 0.05, indicating the absence of a mediating path. However, the analysis revealed a significant association between E2 levels and menopausal status (P < 0.001), consistent with biological phenomenon that a decrease in estrogen leads to menopause. Nevertheless, the association between E2 and menopause is not mediated by CVAI. Additionally, CVAI showed marginal significance with menopause (P = 0.056), suggesting a potential association between visceral fat accumulation and menopause. The decline in significance may be attributed to the reduced sample size. Therefore, the mediation analysis supports the hypothesis that CVAI is associated with the menopause process. This is consistent with the findings from the SWAN study, which indicates an accelerated accumulation of visceral fat during the perimenopausal period.17
Moreover, in the longitudinal CHARLS cohort, CVAI was measured in premenopausal women in 2011, while menopausal status was assessed in the same group of participants in 2018, suggesting that changes in CVAI precede the status of menopause. This conclusion is further corroborated by age-stratified analysis from the NHANES cohort, which demonstrated a significant association between CVAI and menopausal status specifically within the 40–44 age subgroup, indicating a 3.6% increase in odds for each unit increase in CVAI. In contrast, no significant associations were observed in other age groups. This indicates that the effects of declining ovarian function on metabolism and fat redistribution are particularly pronounced during this critical transitional phase. This finding is consistent with the “marked escalation of visceral fat at the early period of the menopausal transition” identified in the SWAN study.17 The absence of significant associations for CVAI in individuals over 45 may be attributed to persistently low estrogen levels within this age group, which likely diminish the impact on fat distribution.
AT is a type of loose connective tissue rich in adipocytes.20 It is primarily regarded as an energy reservoir, heat shielding, and mechanical buffer.20 Over decades of research, AT has increasingly been acknowledged as an “endocrine tissue”. The endocrine function of AT involves various factors, including increased expression of proinflammatory cytokines and adipocyte-derived adipokines, insulin resistance, overactivation of insulin-like growth factor signaling pathway, the occurrence of hypercholesterolemia, and excessive oxidative stress.21 The increased aromatization activity of AT leads to elevated levels of estrogen.22 VAT encompasses omental AT, mesenteric AT, and epiploic AT.20 VAT is a significant contributor to the production of inflammatory adipocytokines.23 VAT communicates with other organs by synthesizing and secreting adipokines. The accumulation of VAT and the increase in adipokine levels can contribute to chronic inflammation and metabolic abnormalities linked to obesity.20 Excess accumulation of VAT is linked to an elevated risk and mortality rate of metabolic disorders, such as DM.11 Current research suggests that visceral adiposity, rather than overall obesity, impacts women’s mortality rates.24 Therefore, accurately measuring visceral adiposity is crucial for assessing potential susceptibility to serious medical conditions. While MRI and CT are recognized as the most trustworthy, specific, and comprehensive methods for assessing visceral adiposity, their time, cost, and radiation exposure constraints limit their accessibility.
Owing to diminished ovarian activity, perimenopausal women experience a decrease in E2 levels, the main form of estrogen that mediates physiological effects. Together with follicle-stimulating hormone, E2 plays important roles in energy homeostasis, including food intake controlled by the central nervous system, energy consumption, coordination of fat storage as well as metabolic processing in AT, and so on.4 E2 promotes the accumulation of subcutaneous AT in the gluteofemoral region in reproductive-aged women while concurrently reducing the amount of central AT,3 whereas postmenopausal women tend to accumulate AT primarily around the visceral area due to decreased E2 levels.16 Menopause also partially reverses the protective effect of AT distribution observed in women.25 In addition, E2 plays a critical role in lipid metabolism by enhancing fatty acid β-oxidation, optimizing mitochondrial bioenergetics, and suppressing lipogenic pathways, thereby promoting efficient energy utilization.1
Furthermore, this study observed a significantly greater OR for the self-reported menopausal status among urban perimenopausal women with a CVAI in Q4 than in those with a CVAI in Q1 in the CHARLS database. However, this correlation was not observed among women residing in rural areas. Consistent with previous research, the residential areas, whether urban or rural, have an impact on the status of menopause.7 The residential area comprehensively reflects the socioeconomic status, work status, and education level of the participants. It also influences the occurrence of obesity, such as the type and quantity of energy intake and the type and intensity of physical exercise.26 Additionally, the place of residence may also affect medical interventions that impact menopause, such as hormone replacement therapy, among perimenopausal participants.
Furthermore, this study observed a significantly greater OR for the self-reported menopausal status among urban perimenopausal women with a CVAI in Q4 than in those with a CVAI in Q1 in the CHARLS database. However, this correlation was not observed among women residing in rural areas. Consistent with previous research, residential areas, whether urban or rural, have an impact on the onset of menopause.7 The residential area comprehensively reflects the socioeconomic status, work status, and education level of the participants. It also influences the occurrence of obesity, such as the type and quantity of energy intake and the type and intensity of physical exercise.26 Additionally, the place of residence may also affect medical interventions that impact menopause, such as hormone replacement therapy, among perimenopausal participants.
In the NHANES cohort, a significant association between the CVAI and menopausal status was identified (OR: 1.02). Furthermore, in the stratified analysis of NHANES cohort, this association was evident among other ethnic groups, including Asians (OR: 1.092), whereas no significant association was observed in non-Hispanic whites, non-Hispanic blacks, and Mexican Americans. In the CHARLS cohort, the association between CVAI and menopause was found to be stronger (OR: 5.23). These findings highlight the differing association of VAT accumulation with menopausal status across diverse ethnic populations, which is consistent with the results of the SWAN study that VAT accumulation during the menopausal transition varies among different racial groups.17 The varying strength of the association between CVAI and menopausal status across different ethnic groups may also be attributed to the more accurate assessment of VAT in the Chinese population.
Therefore, inexpensive and user-friendly surrogate measures such as CVAI have been developed on the basis of anthropometric and metabolic parameters.27 These surrogate measures for assessing visceral adiposity can be employed to categorize the degree of adiposity in participants. CVAI was utilized as an assessment of visceral adiposity in this investigation and used to explore the association with the self-reported menopausal status using representative longitudinal and cross-sectional databases from two countries. The results from the longitudinal data of the CHARLS study demonstrated that individuals in the Q4 of CVAI had a higher odd of menopause in the upcoming years, as indicated by a greater OR, compared to those in the Q1. In the cross-sectional NHANES study, there was a significant association between CVAI and menopause OR in women aged 40–60. These outcomes are in agreement with research from the SWAN study, supporting the observation of accelerated accumulation of visceral adiposity during the menopausal transition.17 Therefore, the CVAI may serve as a potential marker for menopause. Given its established association with CVD, heart disease, stroke, and DM in large-scale prospective cohort studies,28,29 CVAI could be utilized as a screening tool for metabolic and cardiovascular risk assessment during the menopausal transition period.
A clinically applicable nomogram to facilitate the assessment of menopause possibility and assist in the prevention of obesity-related CVDs and metabolic disorders was further developed on the basis of the CVAI. The nomogram for menopausal assessment based on CVAI allows for the estimation of individualized probabilities of menopause. The moderate discriminatory ability (C-index = 0.648) indicates that this nomogram should be utilized as a screening tool rather than a diagnostic instrument.
The main characteristics of this analysis include the use of data collected from two nationally representative populations, adjustment for major confounding factors, and the identification of a consistent association between CVAI and the odds of menopause status, thereby confirming the reliability of the findings. Additionally, mediation analyses have been incorporated.
This study is accompanied by several restrictions, for instance, the absence of a distinction between natural menopause and surgical menopause in the assessment of the status of menopause. Additionally, the study did not take into account the effects of hormone replacement therapy on menopause, as this information was not captured in the CHARLS database. Within this study, other potential confounders that may influence the self-reported menopausal status, such as the age of first menstruation and the number of childbirths, were not available in the CHARLS database. In addition, the median age at menopause for Chinese women is 50 years.30 Extending the follow-up period and including participants who have reached menopause would lead to more reliable results. Furthermore, the CHARLS dataset primarily comprised individuals aged 45 years and older, which undermines the ability to examine the association between CVAI and menopause occurring at an age younger than 40, referred to as premature menopause. A further limitation of this study is that the effects of variations in dietary habits among the population on the association between CVAI and menopause have not been explicitly examined. Another limitation of this study is that, due to the restricted questionnaire information available in the two databases, participants could not be categorized according to STRAW standards into early menopausal transition, late menopausal transition, early postmenopause, and late postmenopause. However, even in the absence of STRAW staging, real-world data are provided in this study, as hormonal assessments are frequently unavailable in practice, thereby supporting the broader applicability of the findings. The most significant limitation of this study is that the statistically significant association between CVAI and menopausal status can not be interpreted as evidence of causation. CVAI is merely a concomitant marker that emerges during the menopausal transition.
Future prospective studies should investigate whether CVAI tracking can identify women approaching menopause and to conduct screening and specific interventions during the menopausal transition to reduce the occurrence of related diseases.
Conclusion
The pieces of evidence from this investigation indicate that CVAI shows promise as a marker for assessing the self-reported menopausal status, though its strength of association appears to vary among different populations.
Abbreviations
AT, adipose tissue; BMI, body mass index; CBC, comprehensive blood count; CHARLS, China Health and Retirement Longitudinal Study; CRP, C-reactive protein; CVD, cardiovascular disease; DM, diabetes mellitus; E2, estradiol; ERB, Ethics Review Board; HDL, high-density lipoprotein; HbA1C, glycated hemoglobin A1c; LDL, low-density lipoprotein; MCV, mean corpuscular volume; MRI, magnetic resonance imaging; NHANES, National Health and Nutrition Examination Survey; OR, odds ratio; PIR, poverty income ratio; PLT, platelet; RC, residual cholesterol; TC, total cholesterol; TG, triglyceride; VAT, visceral adipose tissue; WC, waist circumference; WBC, white blood cell count.
Funding
Yanjun Zhou was supported by the Wuxi Translational Medicine Research Institute (Project number LCYJ202312) and Scientific Research Project of Wuxi Commission of Health (M202327). Jinjin Yu is supported the Wuxi Taihu Lake Talent Plan, Supports for Leading Talents in Medical and Health Profession. Chunlin Dong is supported by research Project on Maternal and Child Health by the Wuxi Municipal Health Commission (FYKY202309).
Disclosure
The authors report no conflicts of interest in this work.
References
1. Ko SH, Jung Y. Energy metabolism changes and dysregulated lipid metabolism in postmenopausal women. Nutrients. 2021;13(12):4556. doi:10.3390/nu13124556
2. Greendale GA, Sternfeld B, Huang M, et al. Changes in body composition and weight during the menopause transition. JCI Insight. 2019;4(5):e124865, 124865. doi:10.1172/jci.insight.124865
3. Opoku AA, Abushama M, Konje JC. Obesity and menopause. Best Pract Res Clin Obstet Gynaecol. 2023;88:102348. doi:10.1016/j.bpobgyn.2023.102348
4. Mauvais-Jarvis F, Clegg DJ, Hevener AL. The role of estrogens in control of energy balance and glucose homeostasis. Endocr Rev. 2013;34(3):309–338. doi:10.1210/er.2012-1055
5. Kohrt WM, Wierman ME. Preventing fat gain by blocking follicle-stimulating hormone. N Engl J Med. 2017;377(3):293–295. doi:10.1056/NEJMcibr1704542
6. Nair AR, Pillai AJ, Nair N. Cardiovascular changes in menopause. Curr Cardiol Rev. 2021;17(4):e230421187681. doi:10.2174/1573403X16666201106141811
7. Beşer E, Aydemir V, Bozkaya H. Body mass index and age at natural menopause. Gynecol Obstet Invest. 1994;37(1):40–42. doi:10.1159/000292518
8. Palmer JR, Rosenberg L, Wise LA, Horton NJ, Adams-Campbell LL. Onset of natural menopause in African American women. Am J Public Health. 2003;93(2):299–306. doi:10.2105/ajph.93.2.299
9. Freeman EW, Sammel MD, Lin H, Gracia CR. Obesity and reproductive hormone levels in the transition to menopause. Menopause. 2010;17(4):718–726. doi:10.1097/gme.0b013e3181cec85d
10. Freeman EW, Gracia CR, Sammel MD, Lin H, Lim LCL, Strauss JF. Association of anti-mullerian hormone levels with obesity in late reproductive-age women. Fertil Steril. 2007;87(1):101–106. doi:10.1016/j.fertnstert.2006.05.074
11. Wajchenberg BL. Subcutaneous and visceral adipose tissue: their relation to the metabolic syndrome. Endocr Rev. 2000;21(6):697–738. doi:10.1210/edrv.21.6.0415
12. Ibrahim MM. Subcutaneous and visceral adipose tissue: structural and functional differences. Obesity Rev. 2010;11(1):11–18. doi:10.1111/j.1467-789X.2009.00623.x
13. Amato MC, Giordano C, Galia M, et al. Visceral adiposity index. Diabetes Care. 2010;33(4):920–922. doi:10.2337/dc09-1825
14. Zhang Z, Zhao L, Lu Y, Meng X, Zhou X. Association between Chinese visceral adiposity index and risk of stroke incidence in middle-aged and elderly Chinese population: evidence from a large national cohort study. J Transl Med. 2023;21(1):518. doi:10.1186/s12967-023-04309-x
15. Xia MF, Chen Y, Lin HD, et al. A indicator of visceral adipose dysfunction to evaluate metabolic health in adult Chinese. Sci Rep. 2016;6(1):38214. doi:10.1038/srep38214
16. Zhao Y, Hu Y, Smith JP, Strauss J, Yang G. Cohort profile: the China Health and Retirement Longitudinal Study (CHARLS). Int J Epidemiol. 2014;43(1):61–68. doi:10.1093/ije/dys203
17. Greendale GA, Han W, Finkelstein JS, et al. Changes in regional fat distribution and anthropometric measures across the menopause transition. J Clin Endocrinol Metab. 2021;106(9):2520–2534. doi:10.1210/clinem/dgab389
18. Müller MJ, Lagerpusch M, Enderle J, Schautz B, Heller M, Bosy-Westphal A. Beyond the body mass index: tracking body composition in the pathogenesis of obesity and the metabolic syndrome. Obes Rev. 2012;13(Suppl 2):6–13. doi:10.1111/j.1467-789X.2012.01033.x
19. Wells JCK. Commentary: the paradox of body mass index in obesity assessment: not a good index of adiposity, but not a bad index of cardio-metabolic risk. Int J Epidemiol. 2014;43(3):672–674. doi:10.1093/ije/dyu060
20. Shen W, Wang Z, Punyanita M, et al. Adipose tissue quantification by imaging methods: a proposed classification. Obesity Res. 2003;11(1):5–16. doi:10.1038/oby.2003.3
21. Scheja L, Heeren J. The endocrine function of adipose tissues in health and cardiometabolic disease. Nat Rev Endocrinol. 2019;15(9):507–524. doi:10.1038/s41574-019-0230-6
22. Polari L, Yatkin E, Martínez Chacón MG, et al. Weight gain and inflammation regulate aromatase expression in male adipose tissue, as evidenced by reporter gene activity. Mol Cell Endocrinol. 2015;412:123–130. doi:10.1016/j.mce.2015.06.002
23. Lee CG, Carr MC, Murdoch SJ, et al. Adipokines, inflammation, and visceral adiposity across the menopausal transition: a prospective study. J Clin Endocrinol Metab. 2009;94(4):1104–1110. doi:10.1210/jc.2008-0701
24. Shuster A, Patlas M, Pinthus JH, Mourtzakis M. The clinical importance of visceral adiposity: a critical review of methods for visceral adipose tissue analysis. Br J Radiol. 2012;85(1009):1–10. doi:10.1259/bjr/38447238
25. Leeners B, Geary N, Tobler PN, Asarian L. Ovarian hormones and obesity. Hum Reprod Update. 2017;23(3):300–321. doi:10.1093/humupd/dmw045
26. Apovian CM. Obesity: definition, comorbidities, causes, and burden. Am J Manag Care. 2016;22(7 Suppl):s176–185.
27. Farahmand M, Ramezani Tehrani F, Rahmati M, Azizi F. Anthropometric indices and age at natural menopause: a 15-year follow-up population-based study. Int J Endocrinol Metab. 2021;19(4):e109285. doi:10.5812/ijem.109285
28. Ren Y, Hu Q, Li Z, Zhang X, Yang L, Kong L. Dose-response association between Chinese visceral adiposity index and cardiovascular disease: a national prospective cohort study. Front Endocrinol. 2024;15:1284144. doi:10.3389/fendo.2024.1284144
29. Tsou MT, Chang YC, Hsu CP, et al. Visceral adiposity index outperforms conventional anthropometric assessments as predictor of diabetes mellitus in elderly Chinese: a population-based study. Nutr Metab. 2021;18(1):87. doi:10.1186/s12986-021-00608-6
30. Qiu C, Chen H, Wen J, et al. Associations between age at menarche and menopause with cardiovascular disease, diabetes, and osteoporosis in Chinese women. J Clin Endocrinol Metab. 2013;98(4):1612–1621. doi:10.1210/jc.2012-2919
 © 2025 The Author(s). This work is published and licensed by Dove Medical Press Limited. The
full terms of this license are available at https://www.dovepress.com/terms
and incorporate the Creative Commons Attribution
- Non Commercial (unported, 4.0) License.
By accessing the work you hereby accept the Terms. Non-commercial uses of the work are permitted
without any further permission from Dove Medical Press Limited, provided the work is properly
attributed. For permission for commercial use of this work, please see paragraphs 4.2 and 5 of our Terms.
© 2025 The Author(s). This work is published and licensed by Dove Medical Press Limited. The
full terms of this license are available at https://www.dovepress.com/terms
and incorporate the Creative Commons Attribution
- Non Commercial (unported, 4.0) License.
By accessing the work you hereby accept the Terms. Non-commercial uses of the work are permitted
without any further permission from Dove Medical Press Limited, provided the work is properly
attributed. For permission for commercial use of this work, please see paragraphs 4.2 and 5 of our Terms.