Back to Journals » Journal of Multidisciplinary Healthcare » Volume 18
Associations Between Obesity-Related Metabolic Phenotypes, Metabolic Transitions, and Cognitive Function in Middle-Aged and Older Adults in China
Authors Ma Q, Jiao Y, Mu S, Zhou T, Shang L, Kang B
Received 18 June 2025
Accepted for publication 1 November 2025
Published 8 November 2025 Volume 2025:18 Pages 7383—7399
DOI https://doi.org/10.2147/JMDH.S548051
Checked for plagiarism Yes
Review by Single anonymous peer review
Peer reviewer comments 3
Editor who approved publication: Dr David C. Mohr
Qing Ma,1 Yuxin Jiao,2 Shengzhi Mu,3 Ting Zhou,1 Liang Shang,1 Bei Kang2
1Department of Geriatrics, Shaanxi Provincial People’s Hospital, Xi’an, Shaanxi, 710068, People’s Republic of China; 2Department of Neurology II, Shaanxi Provincial People’s Hospital, Xi’an, Shaanxi, 710068, People’s Republic of China; 3Department of Burns and Plastic Surgery, Shaanxi Provincial People’s Hospital, Xi’an, Shaanxi, 710068, People’s Republic of China
Correspondence: Bei Kang, Department of Neurology II, Shaanxi Provincial People’s Hospital, No. 256 Youyi West Road, Xi’an, Shaanxi, 710068, People’s Republic of China, Tel +8613759953766, Email [email protected]
Objective: This study aimed to examine the association between different obesity-related metabolic phenotypes, transitions in metabolic status over time, and cognitive function improvement among middle-aged and older adults in China.
Methods: Data were derived from the China Health and Retirement Longitudinal Study, a nationally representative longitudinal cohort involving urban and rural residents aged 45 years and older. Baseline data were collected in 2011, with follow-up assessments extending to 2020. Participants were classified into four body mass index (BMI)-metabolic phenotypes: Metabolically Healthy Normal Weight (MHNW), Metabolically Unhealthy Normal Weight (MUNW), Metabolically Healthy Overweight/Obesity (MHOO), and Metabolically Unhealthy Overweight/Obesity (MUOO). Cognitive function was evaluated through assessments of episodic memory, mental status, and overall cognitive performance. Statistical analyses were performed using R Studio 4.3.1. Cox regression analysis models were employed to estimate associations between metabolic phenotypes, their longitudinal transitions, and changes in cognitive function.
Results: In both the 2011 and 2015 surveys, MHOO demonstrated significantly higher scores in episodic memory, mental status, and overall cognitive function compared to other groups, while MUNW demonstrated significantly lower scores across all domains. In addition, cognitive outcomes varied by BMI-metabolic phenotypes: MHOO was positively associated with cognitive improvement, MUNW was usually associated with poorer cognitive outcomes, and MUOO had no significant association with cognitive changes. Moreover, individuals with stable MUNW status exhibited a lower likelihood of cognitive improvement relative to those with stable MHNW status. In contrast, individuals with stable MHOO status demonstrated a significantly greater likelihood of cognitive improvement. Furthermore, transitioning from MHNW to MUNW was associated with decreased likelihood of favorable cognitive outcomes.
Conclusion: Regardless of weight classification, metabolic health was associated with superior baseline cognitive function and a slower rate of cognitive decline. These findings underscore the significance of metabolic health in predicting cognitive aging trajectories among middle-aged and older individuals.
Keywords: body mass index-metabolic phenotype, CHARLS database, cognitive function, heterogeneity of obesity metabolism, R studio
Introduction
With the acceleration of global population aging, the health of middle-aged and older adults has become an increasingly important focus of public health research. Cognitive decline represents one of the key factors affecting quality of life in this demographic and contributes substantially to burdens placed on families and healthcare systems.1 By 2025, individuals aged 60 years and older are projected to comprise approximately 20.0% of the total population in China.2 As the number of patients diagnosed with cognitive impairment continues to rise, the resulting demands on public health systems are expected to increase, necessitating additional medical resources and expanded long-term care services. According to the “Diagnostic and Statistical Manual of Mental Disorders (5th ed.)” by the American Psychiatric Association, cognitive impairment is characterized by subjective and objective declines in one or more cognitive domains, including complex attention, executive function, learning and memory, language, sensorimotor control, and social cognition, which can interfere with daily functioning or co-occur with psychiatric conditions, and may ultimately lead to dementia.3
Obesity is defined by the excessive accumulation and abnormal distribution of adipose tissue, involving both hypertrophy and hyperplasia of adipocytes.4 It constitutes a major risk factor for a range of chronic conditions, including metabolic syndrome, stroke, type 2 diabetes, and coronary heart disease, and has been recognized as an independent predictor of global mortality.5 Body mass index (BMI) remains a widely used, cost-effective indicator for assessing overall obesity (BMI > 25 kg/m2); however, it does not differentiate between obesity types (eg, general vs central obesity).6 In clinical contexts, sex-related differences in adipose tissue distribution have been extensively documented. Females generally have higher body fat percentages, with preferential storage in the gluteofemoral region. Males, by contrast, more commonly exhibit abdominal fat accumulation, particularly visceral adiposity around internal organs. Visceral adipose tissue, compared to subcutaneous fat, has demonstrated a stronger association with hypertension, diabetes, and metabolic syndrome, indicating a higher metabolic risk. These sex-specific patterns indicate that males may exhibit more severe metabolic disturbances associated with obesity compared to females.7 In addition, middle-aged and older adults tend to demonstrate higher prevalence rates of obesity compared to younger populations.
Evidence has linked obesity and its related metabolic disturbances with increased risk for cognitive impairment and dementia.8,9 With advancing age and the emergence of multiple metabolic risk factors, the rate of cognitive decline accelerates further. Obesity is a well-recognized risk factor for dementia; however, recent studies have suggested that in certain populations, obesity may exert a protective effect on cognition, a phenomenon referred to as the “obesity paradox”.10 The impact of obesity on dementia may vary depending on factors such as age, sex, and metabolic status.8 The potential mechanisms underlying obesity-related cognitive decline include: (1) Obesity-associated inflammation—a chronic, low-grade systemic inflammatory state resulting from adipose tissue expansion, which induces hypoxia and cell death, triggering the release of pro-inflammatory molecules and inflammatory factors. Excessive nutrient intake promotes adipocyte hypertrophy, endoplasmic reticulum stress, mitochondrial dysfunction, free radical release, and activation of inflammatory pathways, thereby forming a pathophysiological basis for cognitive disorders;11,12 (2) Insulin resistance—which impairs neuronal glucose uptake, enhances pro-inflammatory factor release, increases blood-brain barrier permeability, facilitates peripheral inflammatory factor entry into the brain, and affects cerebrovascular endothelial function;13 and (3) The gut-brain axis—obesity-associated gut microbiota dysbiosis, reduced short-chain fatty acids, and increased lipopolysaccharides activate systemic low-grade inflammation and damage the blood-brain barrier. Increased intestinal permeability allows bacterial toxins to enter circulation, activating immune responses via the Toll-like receptor 4/Nuclear factor kappa-B (TLR4/NF-κB) pathway, leading to elevated pro-inflammatory cytokines such as tumor necrosis factor-α (TNF-α) and interleukin-6 (IL-6), neuroinflammatory damage, and cognitive decline.13 Some findings have indicated that elevated visceral adiposity index may be associated with a slower decline in cognitive function among middle-aged and older adults in China.14 This observation contrasts with conventional assumptions and may be partially explained by the metabolic heterogeneity inherent in obesity, which has not been consistently accounted for in previous investigations.
Given the variation in obesity-related metabolic profiles across sex and age, there is a need for improved stratified management of obesity and metabolic status to enable more precise diagnostic and therapeutic strategies. Based on combined BMI and metabolic health indicators, participants in this study were categorized into four phenotypic groups: Metabolically Healthy Normal Weight (MHNW), Metabolically Unhealthy Normal Weight (MUNW), Metabolically Healthy Overweight/Obesity (MHOO), and Metabolically Unhealthy Overweight/Obesity (MUOO).15
Using data from the China Health and Retirement Longitudinal Study (CHARLS), a prospective cohort study, this research examined the associations between obesity-related metabolic heterogeneity, transitions in metabolic status, and changes in cognitive function. The analysis included comparisons across subgroups defined by age and sex to identify those who may derive the greatest cognitive benefit from changes in metabolic status associated with obesity.
Methods
Study Participants and Design
The present analysis utilized data from the CHARLS, a longitudinal cohort study involving community-dwelling urban and rural residents in China aged 45 years and older. At baseline (2011–2012), a nationally representative cohort of 17,708 participants was recruited through multistage probability sampling across 150 counties in 28 provinces. All participants completed standardized, face-to-face interviews conducted by trained personnel to collect data on sociodemographic factors, lifestyle behaviors, and health status. Among these participants, 13,978 completed anthropometric and physical function assessments, and 11,847 provided blood samples for laboratory evaluation. Five follow-up waves have been conducted: 2013 (second wave), 2015 (third wave), 2018 (fourth wave), and 2020 (fifth wave). In 2015, a second round of blood sampling was carried out to measure low-density lipoprotein cholesterol (LDL-C), high-density lipoprotein cholesterol (HDL-C), total cholesterol (TC), triglycerides (TG), fasting blood glucose (FBG), and glycated hemoglobin (HbA1c). Informed consent was obtained from all participants.
An initial analytic sample of 11,755 participants with complete baseline data on metabolic parameters, blood pressure, and HbA1c was identified. Exclusion criteria were subsequently applied to remove participants without valid BMI data, those with a BMI < 18.5 kg/m2, participants unclassifiable by metabolic status, and those with missing covariate data. Additionally, participants with a baseline diagnosis of cardiovascular disease (CVD) were excluded. Since the second biochemical data collection was conducted in 2015, a subset of 5497 participants with complete metabolic and obesity data from the third wave was retained for further analysis.
The study flowchart is shown in Figure 1.
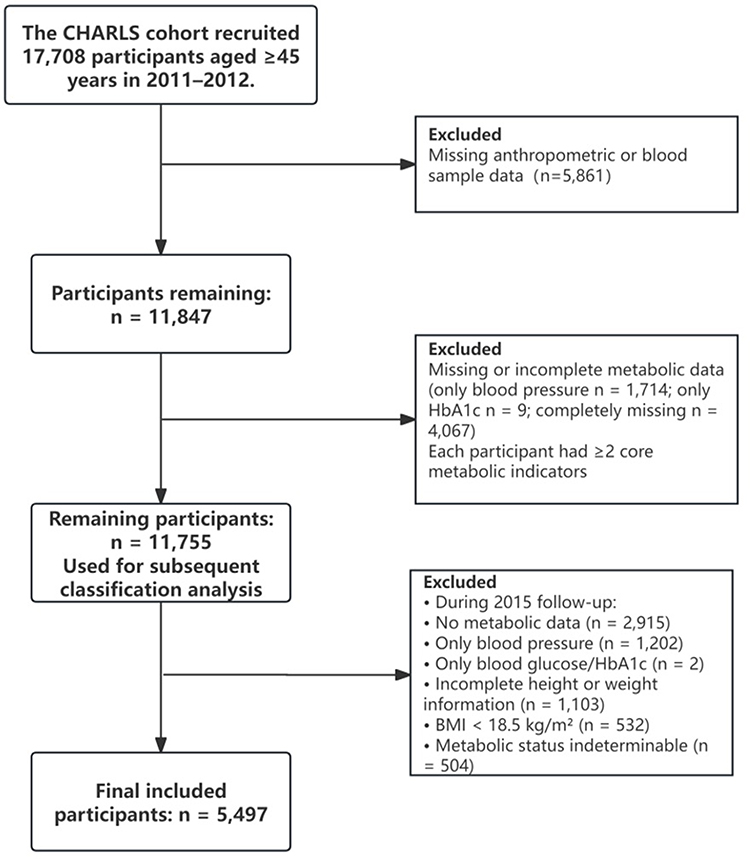 |
Figure 1 Flowchart of study. Abbreviations: CHARLS, China Health and Retirement Longitudinal Study; BMI, body mass index. |
Definition of Obesity and Metabolic Status
Obesity was defined using BMI classifications established by the Chinese Working Group on Obesity (WGOC).16 Participants were categorized as obese (≥ 28.0 kg/m2), overweight (24.0–28.0 kg/m2), or normal weight (18.5–24.0 kg/m2). Metabolic unhealthiness was defined by the presence of at least two of the following criteria:15,17–19 (1) impaired glucose control (FBG ≥ 5.6 mmol/L, HbA1c ≥ 6.0%, or use of antidiabetic medications); (2) elevated blood pressure (systolic ≥ 130 mmHg, diastolic ≥ 85 mmHg, or use of antihypertensive medications); (3) hypertriglyceridemia (TG ≥ 1.7 mmol/L or use of lipid-lowering medications); and (4) reduced HDL-C (males < 1.03 mmol/L; females < 1.29 mmol/L, or use of lipid-lowering medications). Based on BMI and metabolic status, four phenotypes were established: MHNW, MHOO, MUNW, and MUOO. These phenotypes were identified at both baseline (2011) and follow-up (2015), allowing for analysis of changes in metabolic status over time.
Assessment of Cognitive Status
Cognitive function in CHARLS was assessed through three components: episodic memory, mental state, and a composite cognitive ability score.
Assessment of Episodic Memory
Participants were presented with a list of Chinese nouns and asked to recall them immediately (immediate recall) and after a 5-minute delay (delayed recall). The episodic memory score was calculated as the sum of immediate and delayed recall scores, ranging from 0 to 20 points. Higher scores indicated better memory performance.
Assessment of Mental State
The mental state was evaluated using the Telephone Interview for Cognitive Status (TICS), which included tasks such as serial subtraction (subtracting 7 from 100), stating the date, and redrawing a geometric figure Scores ranged from 0 to 11 points, with higher scores reflecting better mental status.
Assessment of Cognitive Abilities
The cognitive ability score was derived by summing the episodic memory and TICS scores, yielding a composite score ranging from 0 to 31. Higher composite scores denoted superior cognitive performance.
All cognitive assessments were administered by trained researchers following standardized protocols. Cognitive improvement, defined as a binary outcome (0 = no improvement, 1 = improvement), was used as the primary endpoint to evaluate the association between BMI-metabolic phenotypes and cognitive function.
Evaluation of Other Variables
Demographic and clinical covariates were obtained from the CHARLS public dataset. Variables included age, sex, marital status, educational attainment, place of residence (urban vs rural), alcohol use, smoking status, and presence of chronic conditions (eg, hypertension, diabetes mellitus, cancer, pulmonary disease, CVD, stroke, mental disorders, arthritis, dyslipidemia, liver disease, renal disease, gastrointestinal disorders, and asthma). Educational attainment was categorized based on CHARLS coding: (1) no formal education, (2) primary education (completed or partially completed), (3) junior high education (completed or partially completed), and (4) senior high school or higher (including vocational education, junior college, or university-level education).
Statistical Analysis
Since no prior effect size was available in China regarding the association between BMI–metabolic phenotype and cognitive improvement in middle-aged and older adults, an a priori power analysis was not performed. Instead, the final sample size was determined by screening valid cases from the CHARLS cohort that had complete baseline and follow-up data on obesity–metabolic phenotypes, cognitive function, and covariates (17,708 participants at baseline, of whom 549 were included after strict eligibility criteria). A post hoc power analysis was subsequently conducted using the Cox proportional hazards regression module in PASS software, based on the classical framework of survival analysis. The results showed that the statistical power for detecting associations between MHOO versus MHNW and MUNW versus MHNW was 92.3% and 87.6%, respectively (both >80%). In addition, the number of events per variable in the Cox regression satisfied the recommended criterion of ≥10:1 (event-to-variable ratio ≈98:1). Taken together, these results demonstrate that the sample size and statistical power of the present study were adequate to detect the association between BMI–metabolic phenotypes and cognitive improvement.
Statistical analyses were conducted using R Studio version 4.3.1. Continuous variables were reported as medians with interquartile ranges (IQRs), and categorical variables were presented as counts with corresponding percentages. Between-group comparisons of baseline characteristics were performed using the Kruskal–Wallis test for continuous variables and the chi-square test for categorical variables. Multivariable Cox proportional hazards regression analysis models were used to assess associations between BMI-metabolic phenotypes and cognitive status, reported as hazard ratios (HRs) with 95% confidence intervals (CIs). Age at baseline and at the end of follow-up was used as the time scale. Three models were constructed: Model 1 (unadjusted), Model 2 (adjusted for sex, marital status, residence, smoking, and alcohol use), and a fully adjusted model (additionally adjusted for hypertension, diabetes mellitus, CVD, stroke, dyslipidemia, liver disease, renal disease, HbA1c, educational attainment, and arthritis). The same modeling strategy was employed to examine the associations of obesity and metabolic status transitions with cognitive function, using the stable MHNW phenotype as the reference group. Subgroup analyses were stratified by sex, smoking status, alcohol consumption, liver disease, and arthritis. Two-sided p-values < 0.05 were considered statistically significant.
Note: Survival analysis was conducted using age as the temporal scale.
This investigation examined the association between BMI-metabolic phenotypes and cognitive abilities using data from the CHARLS, applying a Cox proportional hazards model with age as the temporal scale. CHARLS is designed to assess health-related outcomes among urban and rural residents in China, aged 45 years and older. Given that physical function, metabolic status, and cognitive abilities in middle-aged and older adults are closely linked to age, this temporal framework was considered appropriate for evaluating longitudinal associations in this population.20 Unlike traditional approaches that employ follow-up time as the time scale, the use of age enables the analysis to reflect age-related changes more accurately throughout the cohort, thereby aligning with the temporal structure inherent in longitudinal research. Age, as a biologically meaningful dimension, facilitates the evaluation of cognitive outcomes by accounting for natural aging processes. Accordingly, it was employed as the time variable in the Cox regression analysis models to assess the influence of BMI-metabolic phenotypes on cognitive performance. The application of age as the temporal scale has also been supported and adopted in previous epidemiological studies.21
Results
Baseline Characteristics
Data from 5497 participants were analyzed and categorized into four BMI-metabolic phenotypes: MHNW, MUNW, MHOO, and MUOO. As presented in Table 1, the MUOO group demonstrated the highest median values for systolic blood pressure (SBP, 134.50 mmHg), diastolic blood pressure (DBP, 80.50 mmHg), mean arterial pressure (98.50 mmHg), BMI (26.82 kg/m2), fasting blood glucose (FBG, 108.00 mg/dL), triglycerides (TG, 154.88 mg/dL), and glycated hemoglobin (HbA1c, 5.30%). Conversely, this group had the lowest median high-density lipoprotein cholesterol (HDL-C, 41.37 mg/dL). Significant differences across the four groups were observed in baseline characteristics including age, sex, marital status, place of residence, comorbidities such as hypertension, diabetes mellitus, cardiac disease, stroke, arthritis, and dyslipidemia, as well as smoking and alcohol consumption status.
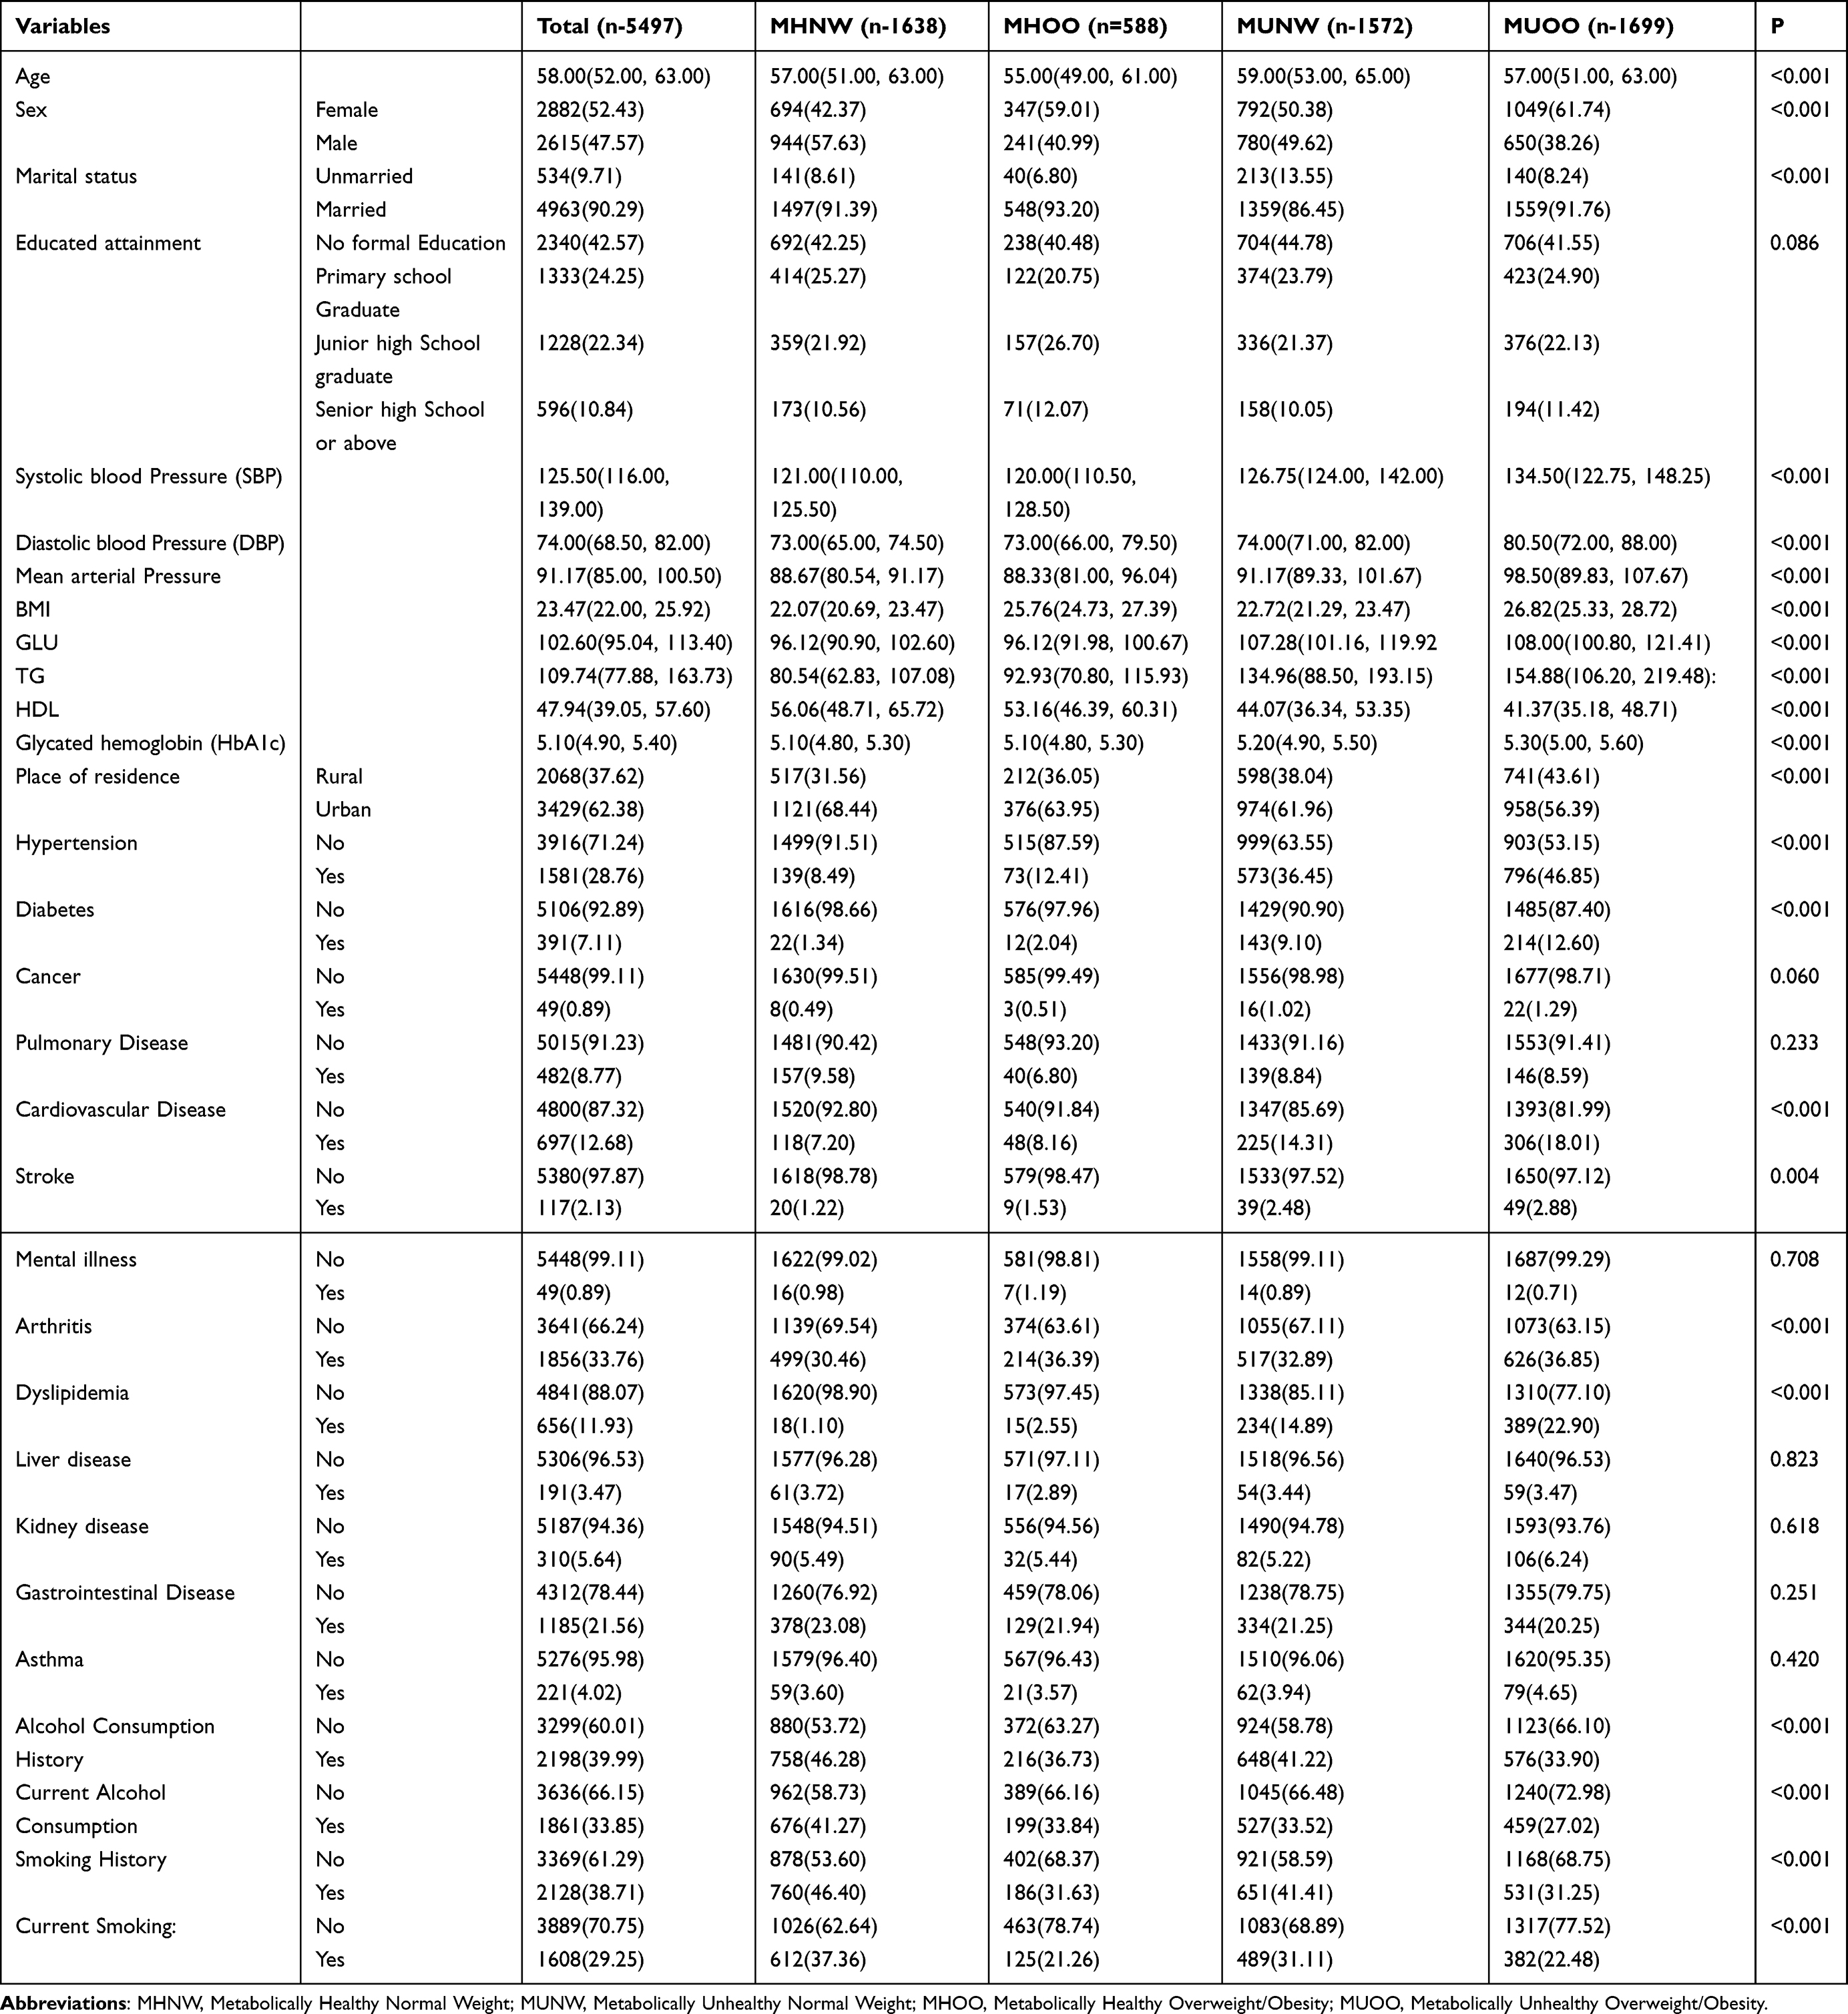 |
Table 1 Baseline Characteristics of the Study Population by BMI-Metabolic Phenotype |
Comparison of Baseline Cognitive Scores
Participants were stratified by BMI-metabolic phenotype, with baseline cognitive scores compared across groups (Table 2). The MHOO group consistently exhibited significantly higher scores in episodic memory, mental status, and overall cognitive abilities during surveys conducted in 2011 and 2015 compared to other groups. In contrast, the MUNW group demonstrated significantly lower scores at both time points. These results indicate that metabolic health is associated with superior baseline cognitive function and a slower decline, regardless of body weight. Additionally, the superior cognitive performance observed in participants classified as MHOO compared to MUNW indicates that relying solely on BMI for health assessment may be inadequate. Continuous variables are presented as means with standard deviations (SD) or interquartile ranges (IQR), while categorical variables are expressed as frequencies and percentages. Group differences in continuous variables were assessed using ANOVA, and categorical variables were compared using Chi-square tests.
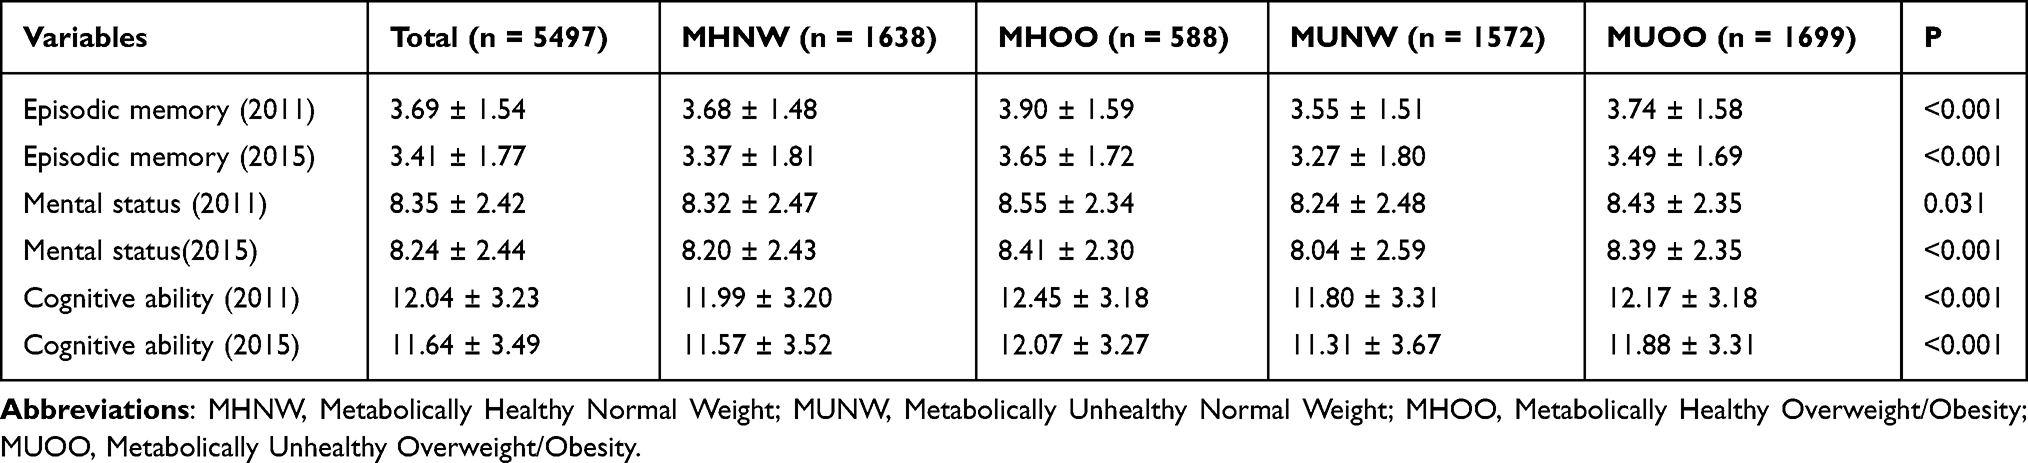 |
Table 2 Baseline Cognitive Scores of the Study Population: Cross-Sectional Comparisons in 2011 and 2015 |
Association Between Baseline BMI-Metabolic Phenotypes and Cognitive Improvement (Multivariate Cox Regression Analysis)
Multiple Cox proportional hazards models were utilized to assess the effect of BMI-metabolic phenotypes on cognitive outcomes, including episodic memory, mental status, and overall cognitive ability. Results indicated significant associations of the MHOO phenotype, sex, marital status, hypertension, and educational attainment with improvements in all three cognitive domains (Table 3).
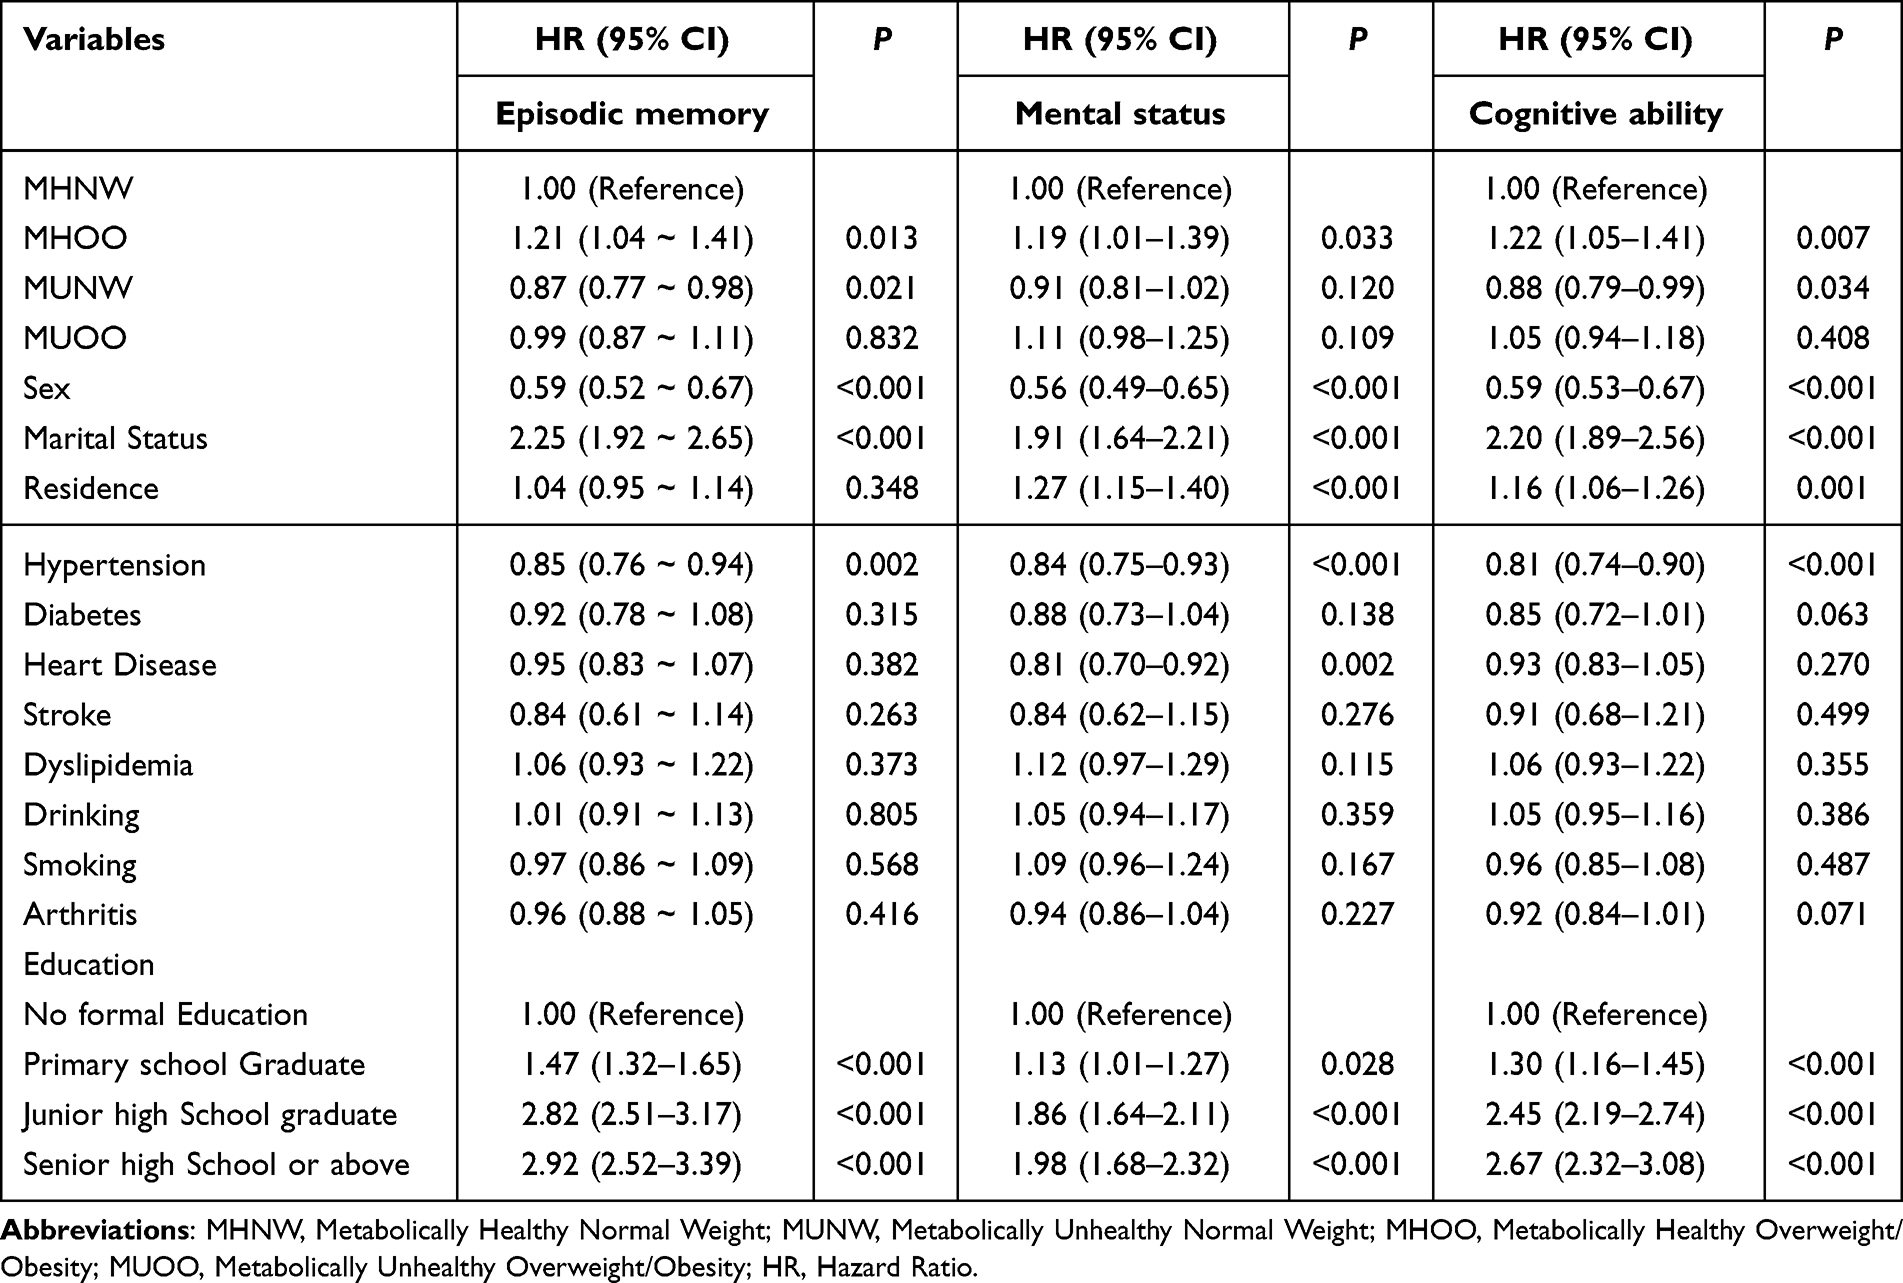 |
Table 3 Sensitivity Analysis of the Association Between BMI-Metabolic Phenotypes and Cognitive Improvement |
Correlation of Baseline BMI-Metabolic Phenotype with Cognitive Improvement: Multimodal Cox Regression Analysis
Using age as a proxy for survival time, a multivariable Cox regression analysis was performed to examine the associations between baseline BMI-metabolic phenotypes and cognitive outcomes, including cognitive ability, mental status, and episodic memory. The results indicated that, relative to participants in the MHNW group, those in the MHOO group demonstrated a significant positive association with cognitive ability improvement across all adjusted models (hazard ratio [HR] range: 1.22–1.32, p < 0.05). Conversely, participants in the MUNW group exhibited a significant negative association with cognitive ability improvement (HR range: 0.83–0.89, p < 0.05), whereas those in the MUOO group demonstrated no statistically significant effect (HR range: 1.05–1.06, p > 0.05). Regarding mental status, the MHOO group maintained a significant positive association with improvement across all models (HR range: 1.19–1.26, p < 0.05), while the MUNW group demonstrated a negative association in some models (eg, Model 1, p < 0.05). The MUOO group did not demonstrate a significant relationship with mental status improvement (p > 0.05). Similarly, for the MHOO group, episodic memory was positively correlated with improvement (HR range: 1.21–1.33, p < 0.05), while it was negatively correlated in the MUNW group (HR range: 0.84–0.88, p < 0.05), and the MUOO group demonstrated no significant association (p > 0.05). Overall, distinct BMI-metabolic phenotypes exhibited differential effects on cognitive improvement across domains, with the MHOO group demonstrating significant positive correlations, the MUNW group displaying negative correlations, and the MUOO group generally demonstrating no significant impact (see Table 4 and Figure 2). These findings indicate that BMI-metabolic phenotypes play a critical role in cognitive trajectories.
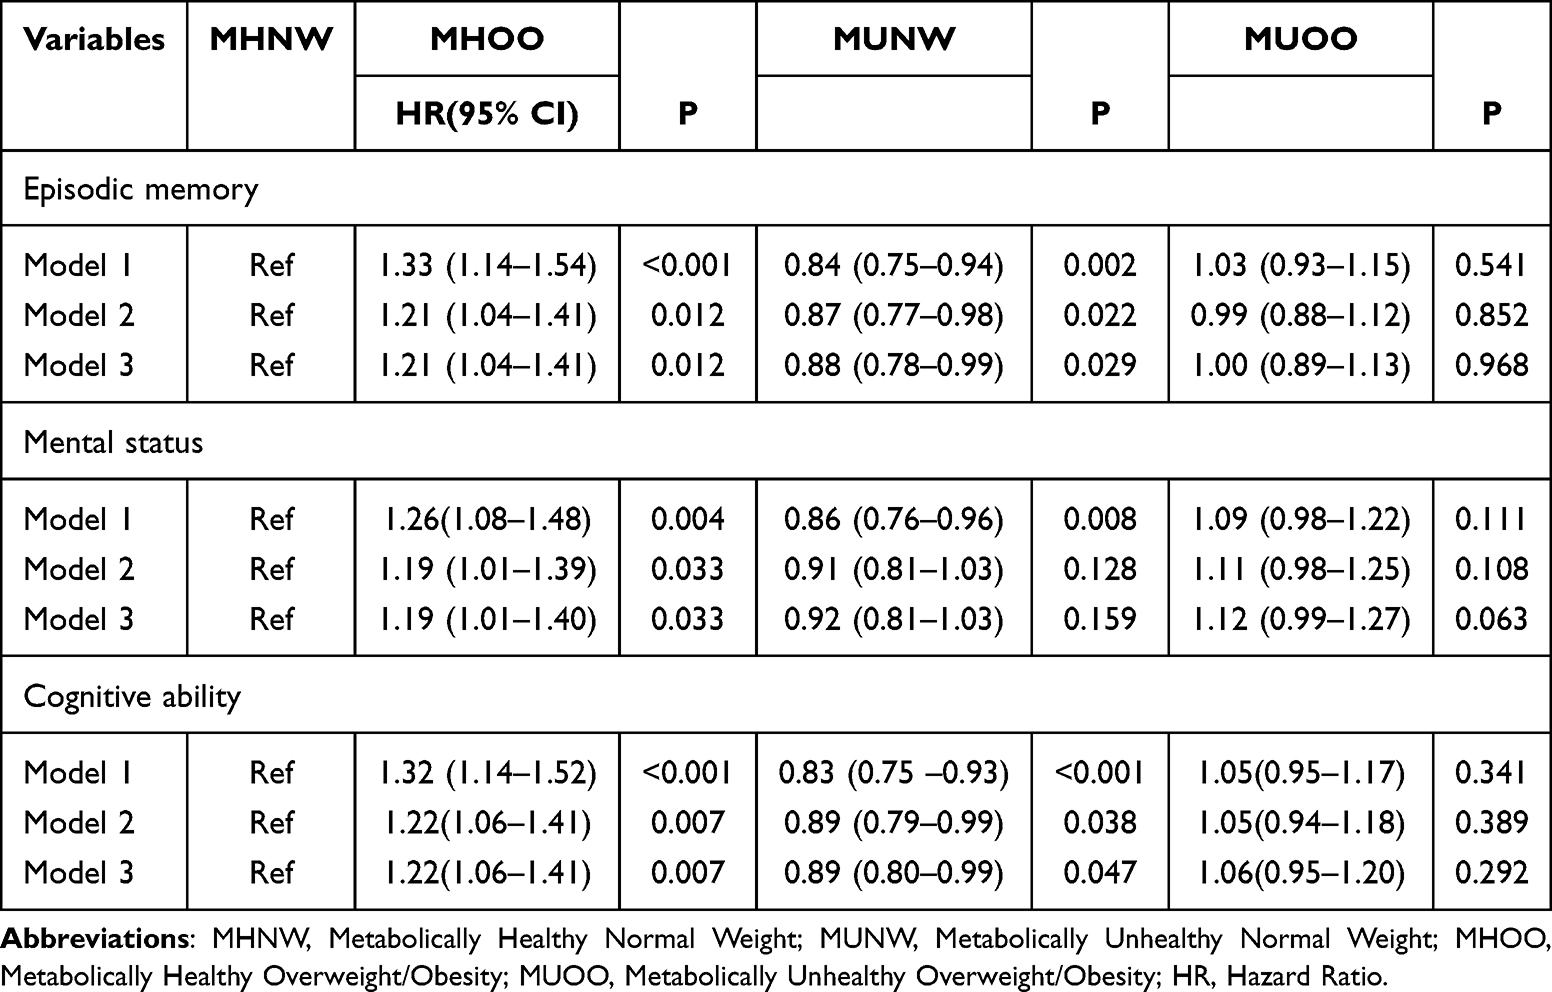 |
Table 4 Associations Between Baseline BMI-Metabolic Phenotypes and Cognitive Improvement |
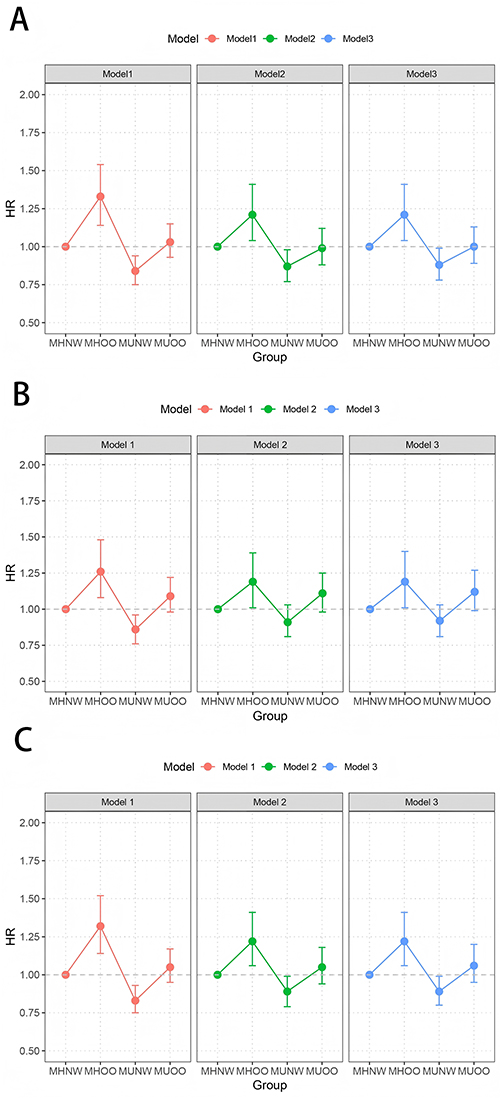 |
Figure 2 Associations between baseline BMI-metabolic phenotypes and cognitive improvement. (A) Episodic memory, (B) Mental status, (C) Cognitive functioning. Model 1: Crude; Model 2: Adjust: sex, marital_status, residence, drinking, smoking; Model 3: Adjust: sex, marital_status, residence, hypertension, diabetes, heart_disease, stroke, dyslipidemia, drinking, smoking, Glycosylated, Arthritis. Abbreviations: BMI, body mass index; MHNW, Metabolically Healthy Normal Weight; MUNW, Metabolically Unhealthy Normal Weight; MHOO, Metabolically Healthy Overweight/Obesity; MUOO, Metabolically Unhealthy Overweight/Obesity. |
Correlation Between BMI-Metabolic Phenotypes and Cognitive Improvement Across Different Subgroups
Subgroup analyses were conducted using Cox regression analysis to assess the relationship between BMI-metabolic phenotypes and cognitive improvement while controlling for potential confounders by excluding interacting variables. This approach minimized confounding bias, enhanced model interpretability, and improved the generalizability of findings across different subgroups.
No significant interactions were detected between BMI-metabolic phenotypes and sex, smoking status, alcohol consumption, liver disease, or arthritis.
Within sex-stratified analysis, female participants classified as MHOO exhibited a significant positive association with cognitive improvement (HR = 1.34; 95% confidence interval [CI]: 1.08–1.66; p = 0.008). In contrast, female participants in the MUNW group demonstrated a significant negative association (HR = 0.83; 95% CI: 0.72–0.97; p = 0.020). Among male participants, only those in the MUNW group showed a statistically significant negative association with cognitive improvement (HR = 0.82; 95% CI: 0.70–0.95; p = 0.010).
Among individuals who did not smoke, MHOO was positively associated with cognitive improvement (HR = 1.26; 95% CI: 1.05–1.51; p = 0.012), while MUNW was negatively associated (HR = 0.83; 95% CI: 0.72–0.96; p = 0.010). In the subgroup of current or former smokers, only MUNW demonstrated a statistically significant negative association (HR = 0.82; 95% CI: 0.69–0.97; p = 0.023).
Among participants who reported alcohol consumption or had arthritis, MHOO was positively associated with cognitive improvement, whereas MUNW remained negatively associated.
Among participants without liver disease, MHOO demonstrated a significant positive association (HR = 1.29; 95% CI: 1.11–1.50; p < 0.001), while MUNW was negatively associated (HR = 0.83; 95% CI: 0.75–0.93; p = 0.001). However, among participants with liver disease, none of the metabolic phenotypes except MHNW were significantly associated with cognitive improvement.
Overall, subgroup analysis results aligned with primary findings. Additionally, among male participants and participants who smoked, MHOO was not significantly linked to an increased likelihood of cognitive improvement (see Table 5 and Figure 3).
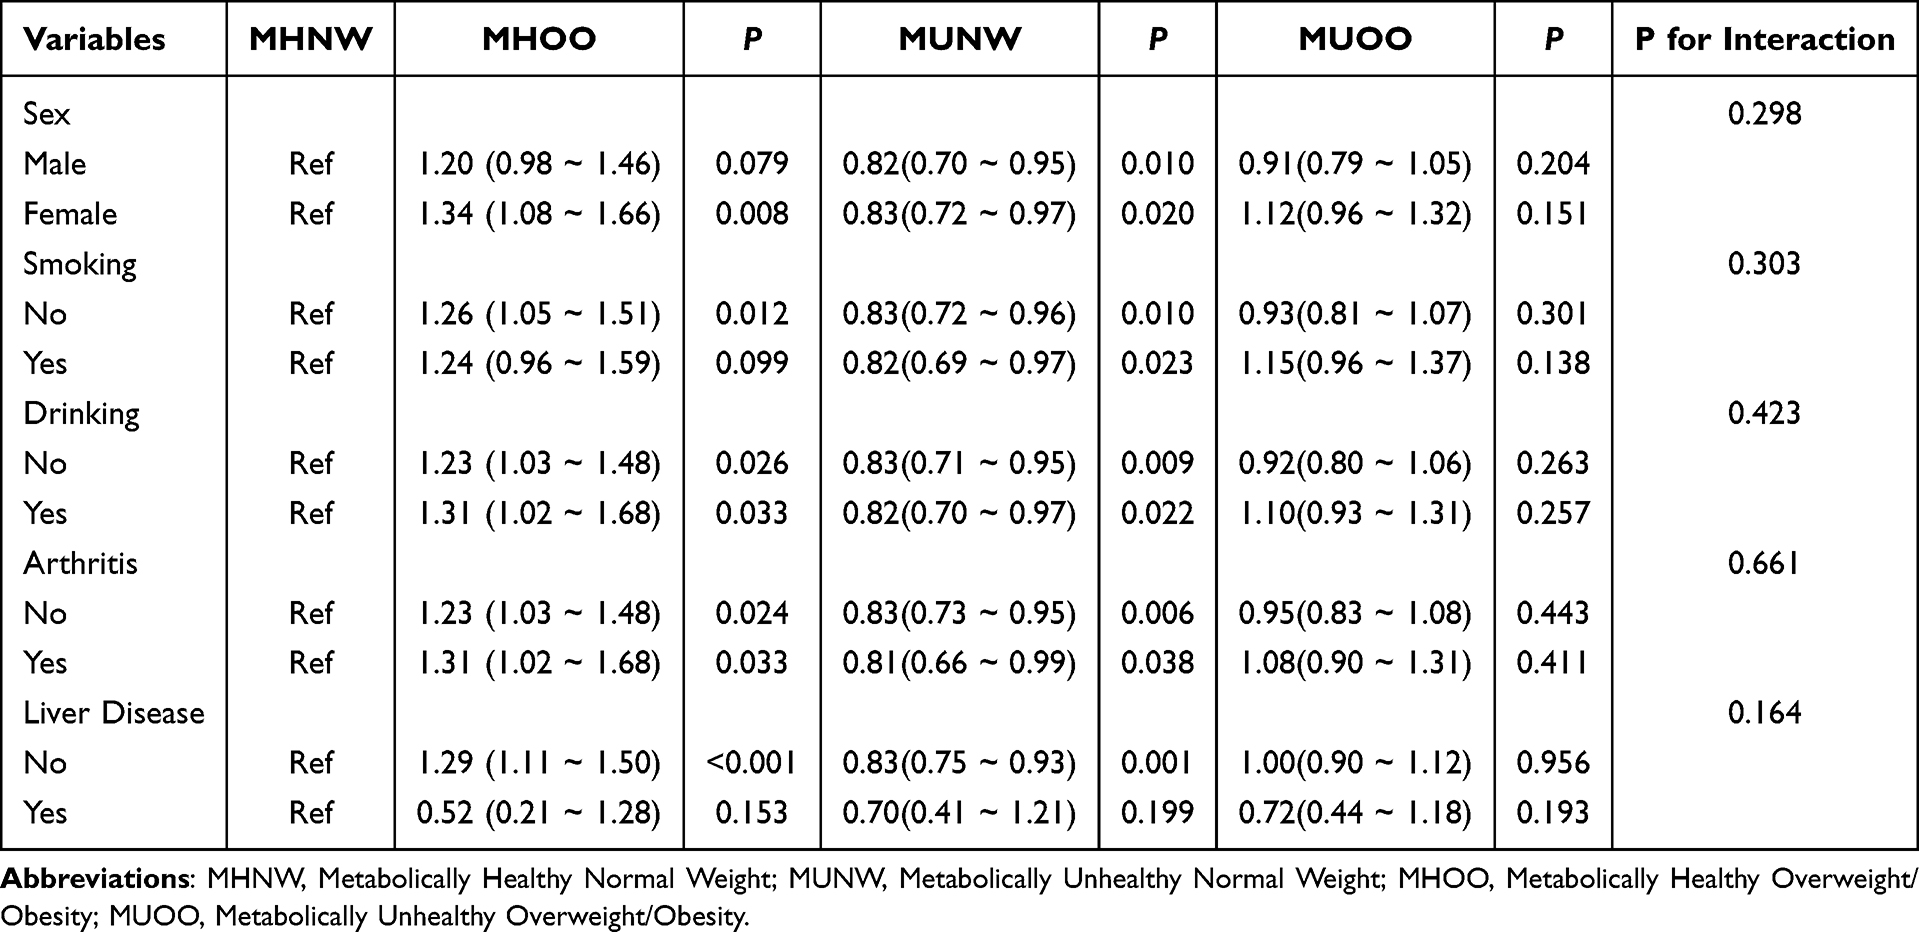 |
Table 5 Associations Between BMI-Metabolic Phenotypes and Cognitive Improvement Across Subgroups |
 |
Figure 3 Associations between BMI-metabolic phenotypes and cognitive improvement across subgroups. Abbreviations: BMI, body mass index; MHNW, Metabolically Healthy Normal Weight; MUNW, Metabolically Unhealthy Normal Weight; MHOO, Metabolically Healthy Overweight/Obesity; MUOO, Metabolically Unhealthy Overweight/Obesity; HR, Hazard Ratio. |
Association Between BMI-Metabolic Phenotype Transition and Cognitive Improvement
Metabolic and obesity statuses demonstrated dynamic changes over the 4-year follow-up period (Table 6). For example, 7.7% of participants classified as MHNW transitioned to MHOO, and 7.2% of those initially classified as MHOO transitioned to MUOO. The effect of these transitions on cognitive improvement was subsequently examined (Table 7 and Table 8).
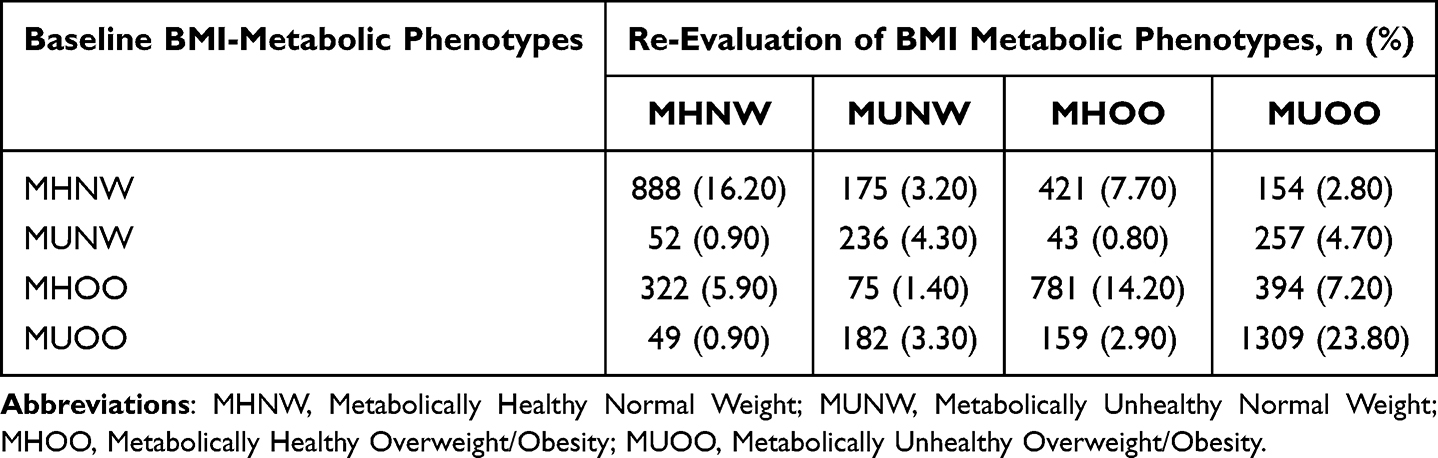 |
Table 6 Frequency and Proportion of Transitions in BMI-Metabolic Phenotypes Over Time |
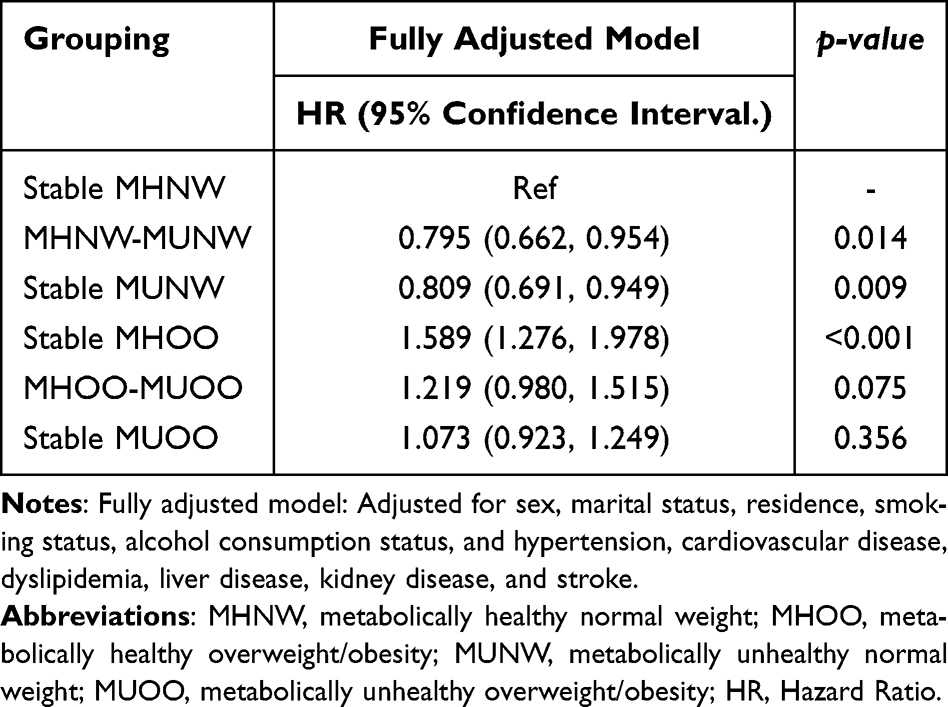 |
Table 7 Associations Between Metabolic State Transitions and Cognitive Improvement |
 |
Table 8 Associations Between Transitions in BMI-Metabolic Phenotypes and Cognitive Improvement |
In the fully adjusted Cox regression analysis model, stable MUNW (HR = 0.81; 95% CI: 0.69–0.95; p = 0.009) and stable MHOO status (HR = 1.58; 95% CI: 1.28–1.98; p < 0.001) were significantly associated with cognitive outcomes compared to stable MHNW status. Specifically, MHOO was linked to a higher likelihood of cognitive improvement, while MUNW was associated with a reduced likelihood. Transitioning from MHNW to MUNW also correlated with decreased cognitive improvement likelihood (HR = 0.79; 95% CI: 0.66–0.95; p = 0.014).
Regarding intergroup transitions (Table 8), transitioning from MUOO to MUNW was associated with a 30% reduction in the likelihood of cognitive improvement (HR = 0.70; 95% CI: 0.54–0.90; p = 0.006) compared to MHNW. Similarly, transitioning from MHNW to MUNW resulted in a 25% reduction (HR = 0.75; 95% CI: 0.63–0.90; p = 0.002). Conversely, participants who improved from MUOO to MHOO had a 29% increased likelihood of cognitive improvement (HR = 1.29; 95% CI: 1.01–1.63; p = 0.040). These results suggest that changes in metabolic health significantly influence cognitive outcomes.
Further subgroup comparisons explored the moderating effect of obesity status on cognitive improvement associated with changes in metabolic health. Compared to participants transitioning from MHNW to MUNW, those transitioning from MHOO to MUOO demonstrated a 52% higher likelihood of cognitive improvement (HR = 1.52; 95% CI: 1.19–1.94; p < 0.001). Likewise, participants transitioning from MUNW to MHNW had a 29% increased likelihood of cognitive improvement relative to those transitioning from MUOO to MHOO (HR = 1.29; 95% CI: 1.01–1.63; p = 0.040).
Discussion
The relationship between obesity and cognitive impairment is complex. Some studies report contradictory findings, exemplified by the “obesity paradox”, whereby obese individuals may exhibit a lower risk of dementia compared to those with lower BMI, and increased visceral obesity index correlates with slower cognitive decline among middle-aged and older adults in China.14,22 The mechanisms underpinning these paradoxes remain unclear but may be influenced by age, sex, genetic susceptibility, comorbidities, and the metabolic heterogeneity of obesity. In the present study, participants were categorized into four BMI-metabolic phenotypes to explore the impact of metabolic heterogeneity of obesity and transitions in obesity status on cognitive function improvement in middle-aged and older adults.
At baseline, the MUOO group exhibited the highest median values for SBP, DBP, mean arterial pressure, BMI, fasting blood glucose (FBG), TG, and HbA1c, alongside the lowest median HDL-C, consistent with prior findings.23 These data indicate that individuals classified as MUOO are predisposed to elevated blood pressure, glucose, lipid abnormalities, and increased BMI. In MUOO individuals, adipose tissue may possess greater expandability and healthier functionality (eg, lipid storage capacity and a more favorable adipokine secretion profile), allowing excess lipids to be safely stored in subcutaneous fat rather than ectopically deposited in organs such as the liver or muscle. This mechanism could help prevent the development of severe metabolic disturbances and inflammation. In our study sample, the MUOO group may differ only minimally from the MHNW group in terms of the true key risk indicators, such as levels of specific inflammatory markers. As a result, statistically significant differences between these groups were not detected.
Baseline assessments revealed that participants classified as MHOO scored significantly higher on episodic memory, mental status, and cognitive ability evaluations in both 2011 and 2015 surveys compared to other groups. Conversely, participants classified as MUNW consistently scored lower. This indicates that among metabolically healthy participants, overweight and obesity were associated with superior cognitive performance, whereas among metabolically unhealthy participants, normal weight was linked to poorer cognitive function.
The association between baseline BMI-metabolic phenotypes and cognitive improvement (Table 4) demonstrated a positive correlation for MHOO and a negative correlation for MUNW with cognitive improvements; MUOO demonstrated no significant association. Contrary to the conventional view of obesity as a risk factor exacerbating cognitive decline, the “obesity paradox” was observed, indicating limitations in using BMI alone to categorize health status.8,9 The BMI-metabolic phenotype appears critical in cognitive improvement, underscoring the need for further evaluation of its role.
Subgroup analyses largely corroborated primary findings. However, among participants with liver disease, only MHNW was associated with cognitive improvement, potentially due to liver disease-related metabolic disturbances, inflammation, and toxin accumulation impairing cognition regardless of metabolic phenotype. Male participants classified as MHOO did not exhibit increased likelihood of cognitive improvement, possibly because overweight/obesity in men correlates with lower testosterone levels, which are associated with reduced cognitive function, potentially negating MHOO metabolic advantages.24 Similarly, among smokers, the MHOO phenotype did not increase cognitive improvement likelihood, possibly because smoking exacerbates inflammation, insulin resistance, and vascular damage, diminishing MHOO benefits. Thus, smoking cessation should be prioritized along with metabolic and cognitive monitoring for smokers classified as MHOO to mitigate long-term risks.25,26
Analyses of baseline BMI-metabolic phenotypes and cognitive improvement revealed significant associations involving the MHOO phenotype, sex, marital status, hypertension, and educational attainment with improvements across three cognitive domains. Specifically, the MHOO phenotype, marital status, and higher education correlated positively with cognitive improvements (Table 3).
Additionally, changes in metabolic and obesity status over time influenced cognitive improvement. During a four-year follow-up, 7.7% of participants classified as MHNW transitioned to MHOO, while 7.2% of participants classified as MHOO transitioned to MUOO. The stable MHOO group demonstrated a significantly increased likelihood of cognitive improvement, whereas stable MUNW demonstrated decreased likelihood. Transitioning from MHNW to MUNW was also associated with reduced cognitive improvement. Compared to stable controls, transitioning from MUOO to MUNW and from MHNW to MUNW reduced cognitive improvement likelihood by 30% and 25%, respectively. Conversely, participants transitioning from MUOO to MHOO demonstrated a 29% increased likelihood of cognitive improvement. Notably, participants transitioning from MHOO to MUOO experienced a 52% greater likelihood of cognitive improvement compared to those transitioning from MHNW to MUNW.
Similarly, those transitioning from MUOO to MHOO exhibited a 29% increased likelihood of cognitive improvement relative to transitions from MUNW to MHNW. Collectively, these findings indicate that metabolic and obesity status transitions significantly affect cognitive improvement, warranting comprehensive stratified analyses for accurate evaluation.
Limitations and Future Directions: The study population consisted solely of middle-aged and older adults in China, which may limit generalizability due to cultural and regional factors. Potential confounding variables, such as dietary habits, physical activity levels, sleep quality, mental health status (eg, depression), medication use, and genetic factors may remain despite adjustment for multiple covariates. In addition, although this study monitored transitions in BMI–metabolic phenotypes over time, it did not investigate the potential drivers of these transitions, such as intentional weight management, pharmacological treatment, or lifestyle modifications. This may limit the ability to draw conclusions about the mechanisms underlying cognitive changes. This study excluded individuals with BMI <18.5 kg/m2 to avoid confounding effects arising from the distinct metabolic and cognitive mechanisms associated with underweight status. However, this strategy may limit the generalizability of our findings, and future research with larger samples or stratified analyses is needed to further examine differences across body types. In addition, the follow-up sample included in 2015 was smaller than the baseline cohort, which may introduce a degree of selection bias. Nevertheless, the analytic sample retained the main characteristics of the baseline cohort, and statistical models were adjusted for key confounders, supporting the validity of our conclusions. Future research should involve larger sample sizes and incorporate cognitive-related biomarkers and objective neuroimaging data to further elucidate mechanisms linking obesity heterogeneity to cognitive outcomes. Lastly, the assessment of cognitive function in this study was based on available data within the CHARLS database, which may not comprehensively capture all relevant cognitive domains. Future studies should expand the scope of cognitive assessments to include additional domains in order to provide a more complete understanding of cognitive changes.
Conclusion
The findings of this study indicate that metabolic health status is associated with higher baseline cognitive scores and a slower rate of cognitive decline, regardless of body weight. Distinct BMI-metabolic phenotypes were found to exert differential effects on improvements in episodic memory, mental status, and overall cognitive abilities. In particular, the MHOO phenotype demonstrated a significant positive association with cognitive improvement, whereas the MUNW phenotype was generally associated with poorer cognitive outcomes. The MUOO phenotype exhibited no significant relationship with cognitive improvement. Moreover, transitions in metabolic status were demonstrated to influence the likelihood of cognitive improvement over time. These findings emphasize the limitations of using BMI alone as a measure of health and underscore the importance of considering metabolic phenotypes when evaluating cognitive trajectories and developing targeted intervention strategies. Neurologists, geriatricians, and general practitioners should be aware that assessing cognitive risk cannot rely solely on body weight or body shape. A comprehensive panel of metabolic indicators, including blood lipids, glucose, HbA1c, and blood pressure, should be integrated into the risk assessment framework for cognitive health. For patients seeking to maintain cognitive function or those already experiencing early cognitive impairment, the primary goal of clinical intervention should not be limited to “weight reduction”. Instead, priority should be given to improving metabolic health.
Abbreviations
CHARLS, China Health and Retirement Longitudinal Study; MHNW, Metabolically Healthy Normal Weight; MHOO, Metabolically healthy overweight/obesity; MUNW, Metabolically unhealthy normal weight; MUOO, Metabolically unhealthy overweight/obesity; BMI, Body Mass Index; LDL-C, Low-Density Lipoprotein Cholesterol; HDL-C, High-Density Lipoprotein Cholesterol; TG, Triglyceride; TC, Total Cholesterol; FBG, Fasting blood glucose; HbA1c, Glycated Hemoglobin A1c; WGOC, Chinese Working Group on Obesity; SBP, Systolic Blood Pressure; DBP, Diastolic Blood Pressure; TICS, Telephone Interview for Cognitive Status; TLR4, Toll-like Receptor 4; NF-κB, Nuclear factor kappa-B; TNF-α, Tumor necrosis factor-α; IL-6, Interleukin-6.
Data Sharing Statement
The data that support the findings of this study are available from the corresponding author, Bei Kang, upon reasonable request.
Ethics Approval
This study was conducted in accordance with the declaration of Helsinki. This study was conducted with approval from the Ethics Committee of Shaanxi Provincial People’s Hospital. Informed consent was obtained from all participants.
Funding
This study was supported by a grant from Shaanxi Province Natural Science Basic Research Program Project (2023-JC-YB-830).
Disclosure
None of the authors have any financial disclosure or conflict of interest.
References
1. Wu Y, Yao JJ, Chen DH, Yang QP, Zhou DX, Peng W. Investigation on mild cognitive impairment among the elderly in the community of Wuxi and analysis of its influencing factors. Mod Preventive Med. 2017;44(2):259–263.
2. Notice of the state council on issuing the 13th five-year plan for the development of national aging affairs and the construction of the pension system. (2017-03-06)[2024-04-12].
3. Posar A, Visconti P. Autism spectrum disorder and the diagnostic and statistical manual of mental disorders-fifth edition (DSM-5): the experience of 10 years. Turk Arch Pediatr. 2023;58(6):658–659. doi:10.5152/TurkArchPediatr.2023.23149
4. Olsthoorn L, Vreeken D, Kiliaan AJ. Gut microbiome, inflammation, and cerebrovascular function: link between obesity and cognition. Front Neurosci. 2021;15:761456. doi:10.3389/fnins.2021.761456
5. American Heart Association Council on Lifestyle and Cardiometabolic Health; Council on Cardiovascular and Stroke Nursing; Council on Clinical Cardiology; Council on Epidemiology and Prevention; and Stroke Council; Powell-Wiley TM, Poirier P, Burke LE, et al. Obesity and cardiovascular disease: a scientific statement from the americana heart association. Circulation. 2021;143(21):e984–e1010. doi:10.1161/CIR.0000000000000973
6. Canadian Alliance of Healthy Hearts and Minds (CAHHM) and the Prospective Urban and Rural Epidemiological (PURE) Study Investigators; Anand SS, Friedrich MG, Lee DS, et al. Evaluation of adiposity and cognitive function in adults. JAMA Network Open. 2022;5(2):e2146324. doi:10.1001/jamanetworkopen.2021.46324
7. Liu J, Fox CS, Hickson DA, et al. Impact of abdominal visceral and subcutaneous adipose tissue on cardiometabolic risk factors: the jackson heart study. J Clin Endocrinol Metab. 2010;95(12):5419–5426. doi:10.1210/jc.2010-1378
8. Livingston G, Huntley J, Sommerlad A, et al. Dementia prevention, intervention, and care: 2020 report of the lancet commission. Lancet. 2020;396(10248):413–446. Erratum in: Lancet. 2023 Sep 30;402(10408):1132. doi:10.1016/S0140-6736(20)30367-6
9. Li G, Hu Y, Zhang W, et al. Brain functional and structural magnetic resonance imaging of obesity and weight loss interventions. Mol Psychiatry. 2023;28(4):1466–1479. doi:10.1038/s41380-023-02025-y
10. Tang X, Zhao W, Lu M, et al. Relationship between central obesity and the incidence of cognitive impairment and dementia from cohort studies involving 5,060,687 participants. Neurosci Biobehav Rev. 2021;130:301–313. doi:10.1016/j.neubiorev.2021.08.028
11. Woo A, Botta A, Shi SSW, Paus T, Pausova Z. Obesity-related neuroinflammation: magnetic resonance and microscopy imaging of the brain. Int J Mol Sci. 2022;23(15):8790. doi:10.3390/ijms23158790
12. Bao Y, Chen X, Li Y, et al. Chronic low-grade inflammation and brain structure in the middle-aged and elderly adults. Nutrients. 2024;16(14):2313. doi:10.3390/nu16142313
13. Zhang Q, Jin K, Chen B, et al. Overnutrition induced cognitive impairment: insulin resistance, gut-brain axis, and neuroinflammation. Front Neurosci. 2022;16:884579. doi:10.3389/fnins.2022.884579
14. Zeng Z, Huang K, Cen Y, et al. Elevated visceral adiposity index linked to improved cognitive function in middle-aged and elderly Chinese: evidence from the China health and retirement longitudinal study. Front Aging Neurosci. 2023;15:1270239. doi:10.3389/fnagi.2023.1270239
15. He D, Qiu Y, Yan M, et al. Associations of metabolic heterogeneity of obesity with frailty progression: results from two prospective cohorts. J Cachexia, Sarcopenia Muscle. 2023;14(1):632–641. doi:10.1002/jcsm.13169
16. Chen C, Lu FC. Department of disease control ministry of health, PR China. The guidelines for prevention and control of overweight and obesity in Chinese adults. Biomed Environ Sci. 2004;17 Suppl:1–36.
17. Zhou Y, Zhang X, Zhang L, et al. Increased stroke risk in metabolically abnormal normal weight: a 10-year follow-up of 102,037 participants in China. Transl Stroke Res. 2021;12(5):725–734. doi:10.1007/s12975-020-00866-1
18. Lee H, Choi EK, Lee SH, et al. Atrial fibrillation risk in metabolically healthy obesity: a nationwide population-based study. Int J Cardiol. 2017;240:221–227. doi:10.1016/j.ijcard.2017.03.103
19. Alberti KG, Zimmet P, Shaw J; IDF Epidemiology Task Force Consensus Group. The metabolic syndrome--a new worldwide definition. Lancet. 2005;366(9491):1059–1062. doi:10.1016/S0140-6736(05)67402-8
20. Sol J, Ortega-Bravo M, Portero-Otín M, et al. Human lifespan and sex-specific patterns of resilience to disease: a retrospective population-wide cohort study. BMC Med. 2024;22(1):17. doi:10.1186/s12916-023-03206-w
21. Cui C, Liu L, Li H, et al. Childhood exposure to interparental physical violence and adult cardiovascular disease. JAMA Network Open. 2024;7(12):e2451806. doi:10.1001/jamanetworkopen.2024.51806
22. Qizilbash N, Gregson J, Johnson ME, et al. BMI and risk of dementia in two million people over two decades: a retrospective cohort study. Lancet Diabetes Endocrinol. 2015;3(6):431–436. doi:10.1016/S2213-8587(15)00033-9
23. He Q, Zheng R, Song W, Sun X, Lu C. The impact of metabolic heterogeneity of obesity and transitions on cardiovascular disease incidence in Chinese middle-aged and elderly population: a nationwide prospective cohort study. Diabetes Obes Metab. 2025;27(2):501–510. doi:10.1111/dom.16040
24. Chu HX, Li XY. Androgen and Alzheimer’s disease in men. Chinese J Geriatrics. 2007;(01):73–75.
25. Jamal O, Aneni EC, Shaharyar S, et al. Cigarette smoking worsens systemic inflammation in persons with metabolic syndrome. Diabetol Metab Syndr. 2014;6:79. doi:10.1186/1758-5996-6-79
26. Damasceno DC, Sinzato YK, Bueno A, et al. Metabolic profile and genotoxicity in obese rats exposed to cigarette smoke. Obesity. 2013;21(8):1596–1601. doi:10.1002/oby.20152
 © 2025 The Author(s). This work is published and licensed by Dove Medical Press Limited. The
full terms of this license are available at https://www.dovepress.com/terms
and incorporate the Creative Commons Attribution
- Non Commercial (unported, 4.0) License.
By accessing the work you hereby accept the Terms. Non-commercial uses of the work are permitted
without any further permission from Dove Medical Press Limited, provided the work is properly
attributed. For permission for commercial use of this work, please see paragraphs 4.2 and 5 of our Terms.
© 2025 The Author(s). This work is published and licensed by Dove Medical Press Limited. The
full terms of this license are available at https://www.dovepress.com/terms
and incorporate the Creative Commons Attribution
- Non Commercial (unported, 4.0) License.
By accessing the work you hereby accept the Terms. Non-commercial uses of the work are permitted
without any further permission from Dove Medical Press Limited, provided the work is properly
attributed. For permission for commercial use of this work, please see paragraphs 4.2 and 5 of our Terms.